
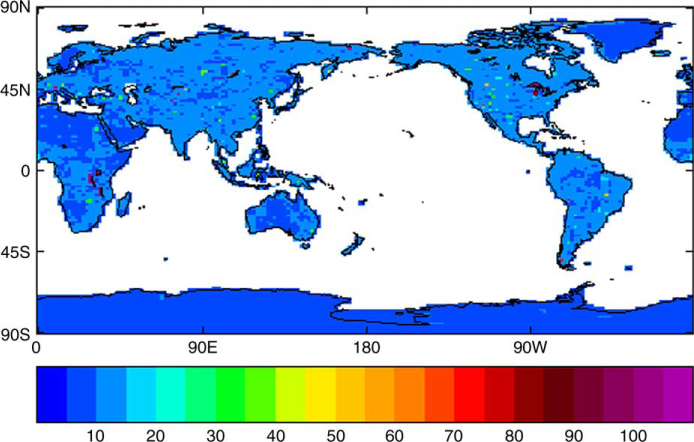
Fig. 1
Lake-depth (m) for climate testing, generated using FLake software and then bounded between 5 m and 100 m.
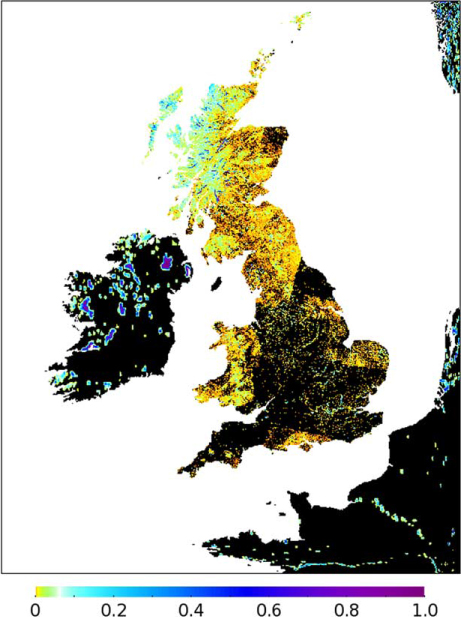
Fig. 2
Inland-water tile fraction in the UKV. Zero fraction is shown as black, other values up to 1 are shown on the colour scale. The model domain is as described in Section 3.1. Note that the stretched model grid produces distortion around the edges of the plot, e.g., the thinning of the Finistère peninsula.
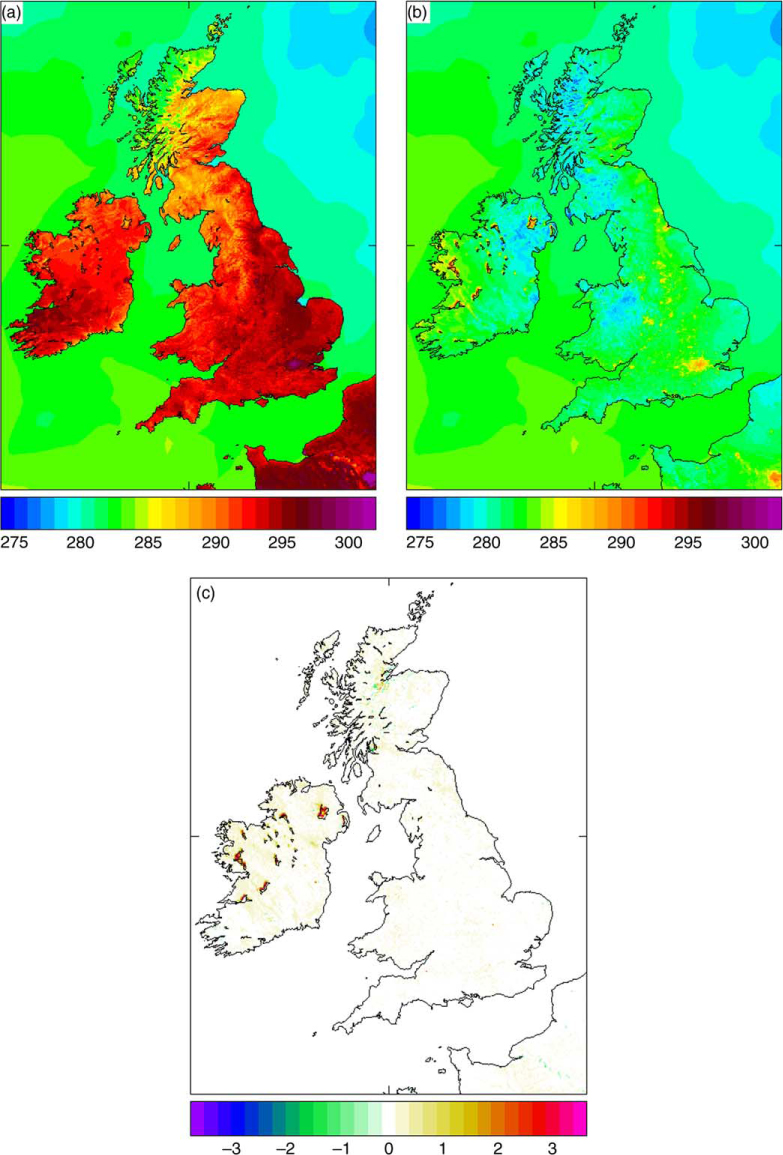
Fig. 3
Gridbox-mean surface temperature, T* (K), around the 8/9 April 2011. (a) T* at 12 UTC on 8 April, MetUM-FLake; (b) T* at 00 UTC on 9 April, MetUM-FLake; (c) T* difference at 00 UTC on 9 April, MetUM-FLake minus control.
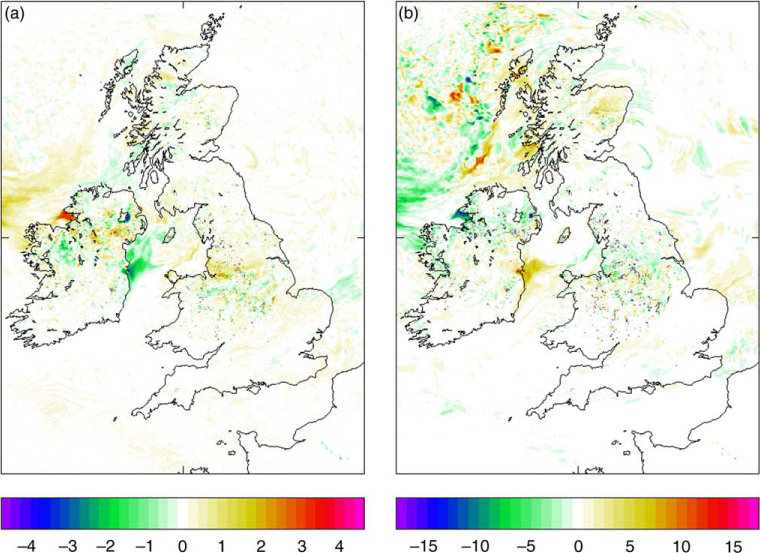
Fig. 4
MetUM-FLake minus control: (a) screen temperature (K) and (b) relative humidity (%) at 6 UTC on 24 March 2011.
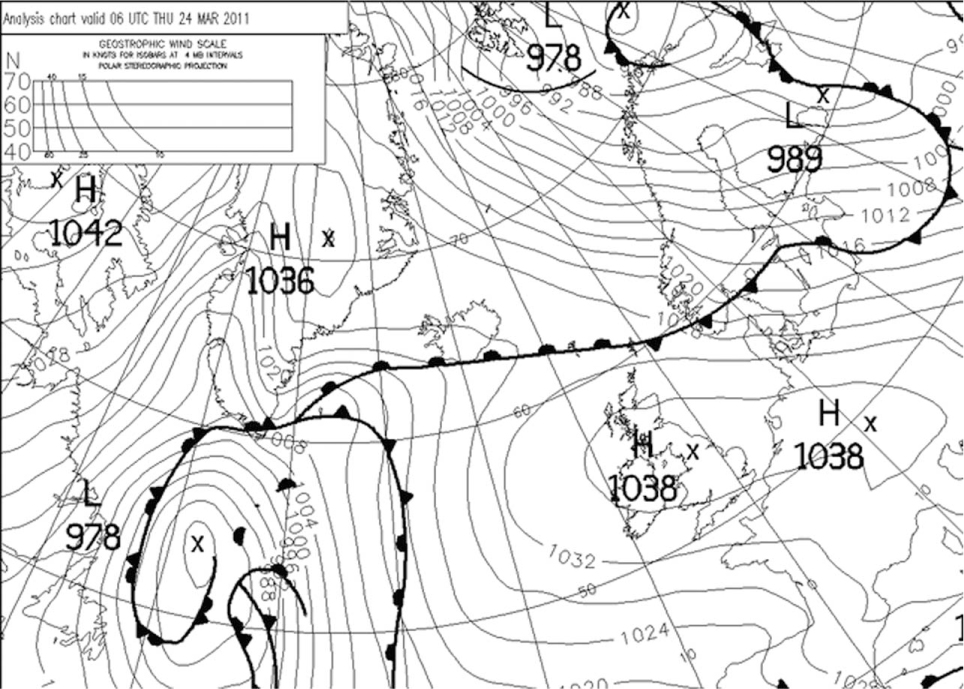
Fig. 5
Section of analysis chart at 6 UTC on 24 March 2011.
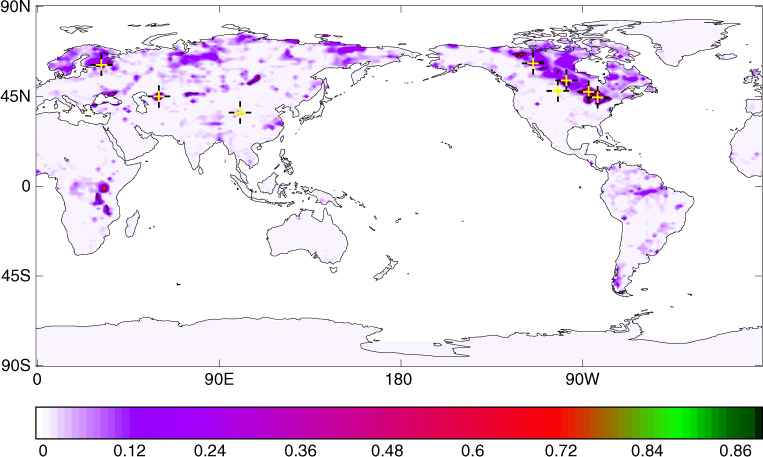
Fig. 6
Lake fraction in MetUM, global climate model domain. The positions of the eight locations examined in detail are marked with yellow-on-black crosses and listed in Table 1.
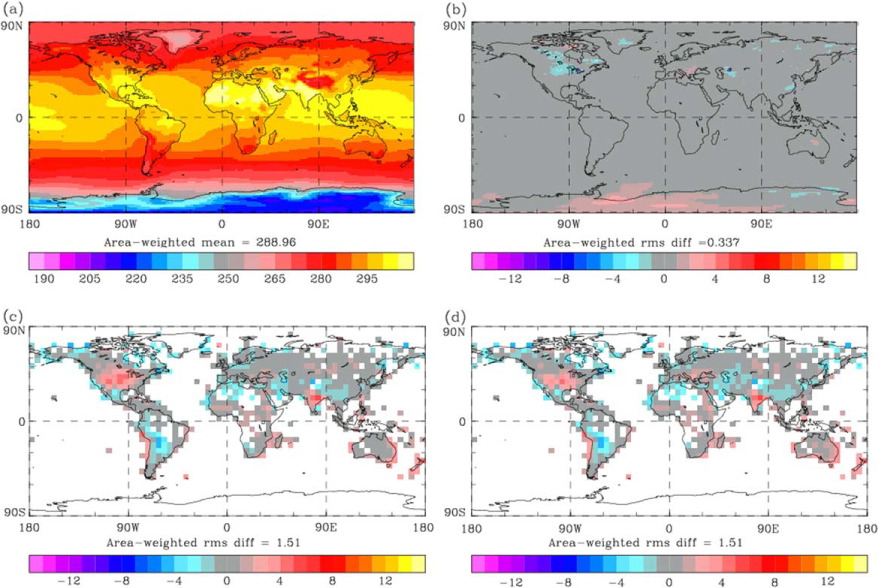
Fig. 7
Ten-year mean 1.5 m temperature (K), summer months June, July and August: (a) MetUM-FLake mean temperature; (b) MetUM-FLake minus MetUM control; (c) MetUM control minus climatology from CRUTEM3 (Brohan et al., 2006); and (d) MetUM-FLake minus climatology from CRUTEM3.
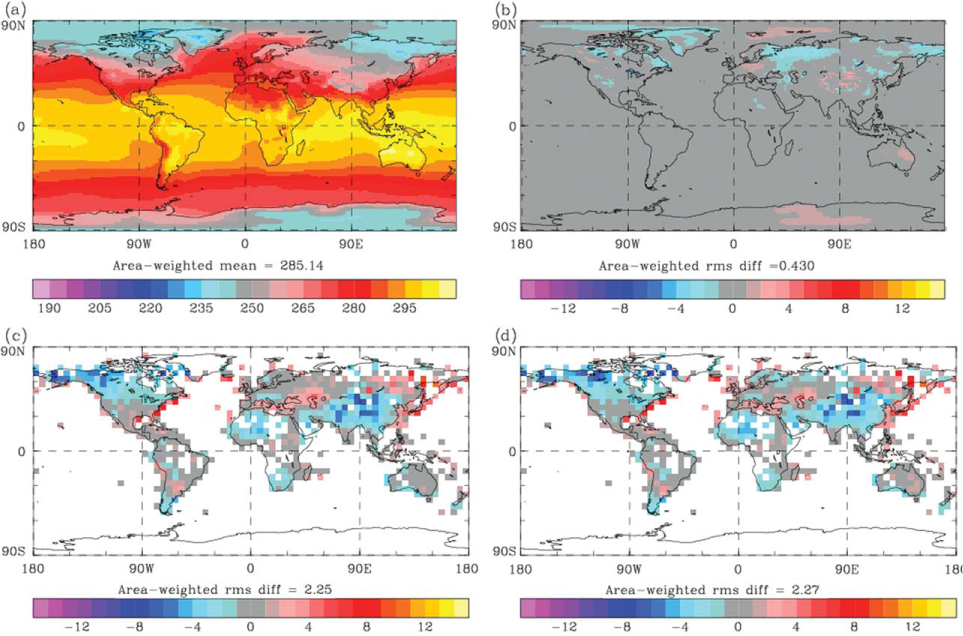
Fig. 8
Ten-year mean 1.5 m temperature (K), winter months December, January and February: (a) MetUM-FLake mean temperature; (b) MetUM-FLake minus MetUM control; (c) MetUM control minus climatology from CRUTEM3 (Brohan et al., 2006); and (d) MetUM-FLake minus climatology from CRUTEM3.
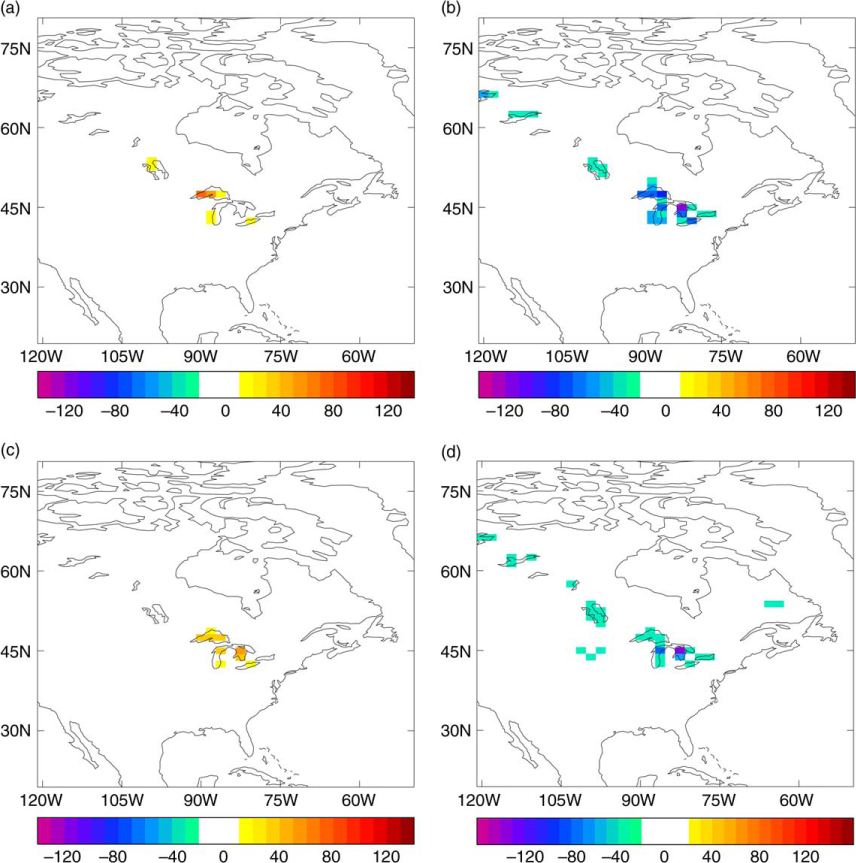
Fig. 9
Differences in the surface energy balance, MetUM-FLake minus MetUM control, zoomed in to the area around the Laurentian Great Lakes. Fields shown are means for the summer (June, July and August) period. (a) Sensible heat flux (W m−2), upward positive; (b) latent heat flux (W m−2), upward positive; (c) net downwelling surface long-wave irradiance (W m−2); and (d) 1.5 m temperature (K).
Table 1. Characteristics of points extracted for month-by-month evaluation
1Great Slave Lake61.59−114.580.685.0212.22.62Lake Winnipeg53.01−98.030.625.0238.61.83Lake Superior47.35−86.990.95100.0267.111.34Lake Huron44.58−82.540.9870.0225.65.95Lake Sakakawea47.80−102.310.0327.0706.910.46Aral Sea45.0060.000.9810.057.32.07Lake Ladoga60.8631.530.607.065.86.08Qinghai Lake36.91100.230.0818.03691.065.0
[i] The locations are also plotted in Fig. 6. The model data are taken from the gridboxes containing each point.
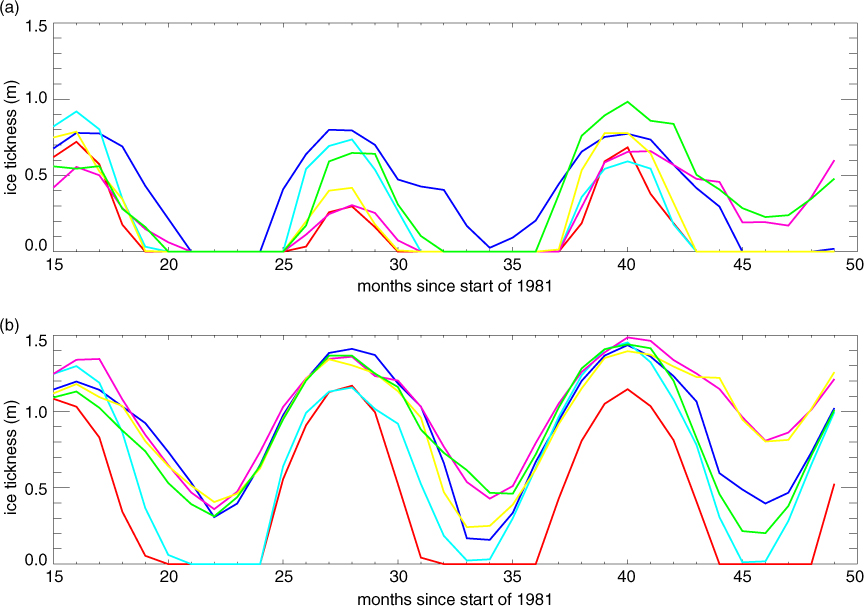
Fig. 10
Results of testing modifications to MetUM-FLake, in terms of the effects on lake-ice thickness at (a) Lake Sakakawea (USA) and (b) Qinghai Lake (China). These are locations 5 and 8 in Table 1, see also Fig. 6. The configurations which the colours represent are as follows: Green – unmodified MetUM-FLake. Blue – changes to the FLake code (A). Cyan – switching the MetUM drag scheme (B). Pink – increasing z 0 (C). Yellow – decreasing z 0 (D). Red – a combination of (B) and (D). The modifications (A)–(D) are described further in Section 4.
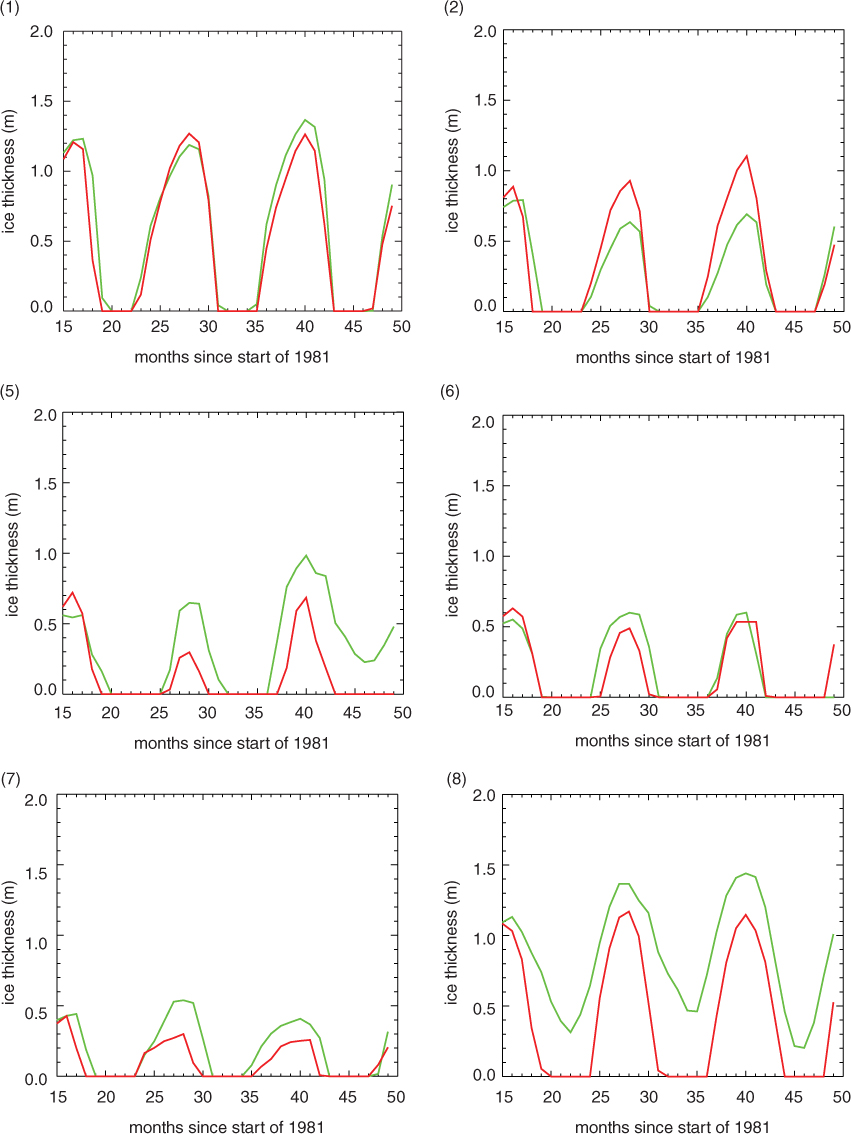
Fig. 11
Timeseries of monthly ice thickness at those test locations which formed lake ice, see Table 1 and Fig. 6. Green shows the original MetUM-FLake run. Red shows the MetUM-FLake run with modifications (B) and (D).
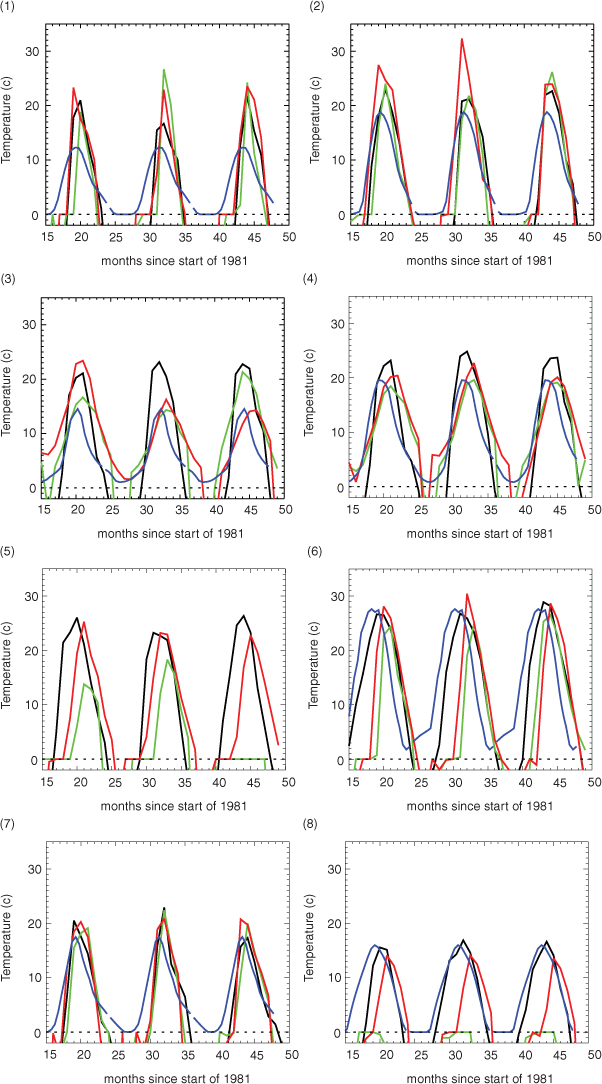
Fig. 12
Timeseries of monthly lake-tile surface temperature at the eight test locations, see Table 1 and Fig. 6. Black shows the control MetUM run. Green shows the original MetUM-FLake run. Red shows the MetUM-FLake run with modifications (B) and (D). Blue shows the ARC-Lake LWST climatology. Note that the climatology does not provide surface temperatures for frozen lakes, but instead defaults to 0°C, which then indicates the frozen period. No climatology data were available for location 5.
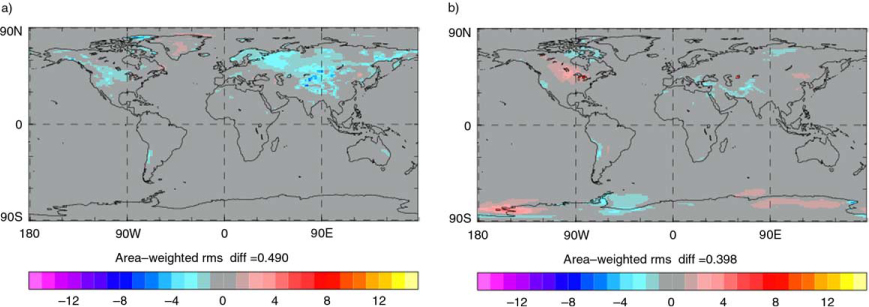
Fig. 13
Ten-year mean seasonal screen-temperature differences, computed as modified minus default MetUM-FLake configurations: (a) winter (December, January and February) and (b) summer (June, July and August).