
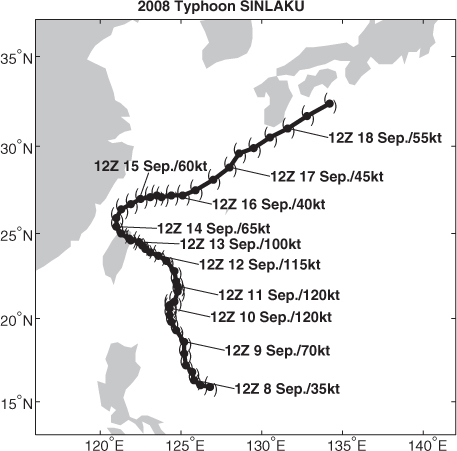
Fig. 1
JTWC best track and intensity of typhoon Sinlaku 2008. Data are plotted every 6-hour.
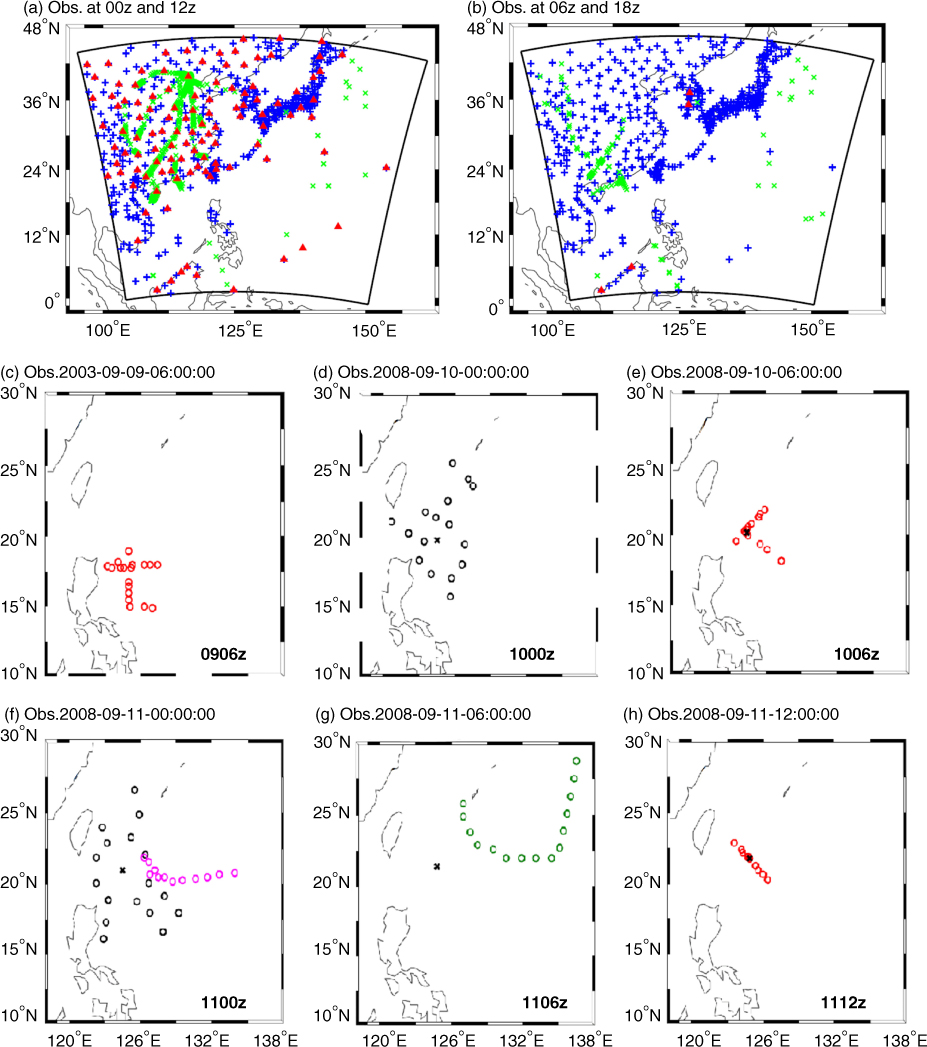
Fig. 2
Observation distributions at different times: (a) typical distributions for upper air soundings and surface stations at 0600 UTC and 1800 UTC; (b) the same as (a), but for 0000 UTC and 1200 UTC; (c)–(h) are dropsondes available at different analysis times. Dropsondes from the USAF C130, DLR Falcon, NRL P-3 and ROTSTAR ASTRA flights are indicated by red, green, purple and black open circles. The box shown in Fig. 2a and 2b is the model domain used in this study.
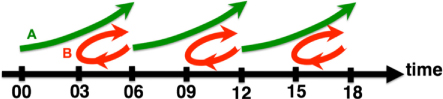
Fig. 3
Implementation of the LETKF-RIP scheme in the WRF model. Loop A is the zero iteration performing regular LETKF with a 6-hour ensemble forecast. Loop B includes the use of the no-cost smoother and forecast-analysis steps with a cycle shorter than Loop A. Adopted from Kalnay and Yang (2010).
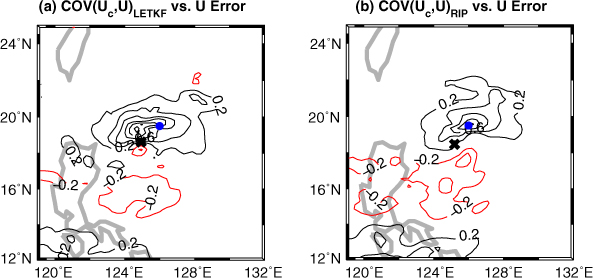
Fig. 4
Error covariance structure (contours) between the zonal wind speed at the location (126°E, 19.5°N and about 750 hPa) marked with a ‘•’ and the zonal wind speed on the WRF eta level near 750 hPa from the LETKF-RIP background ensemble at the first iteration at 1200 UTC 9 September. (b) The same as in (a), except the error covariance is derived from the LETKF background. Black contours denote the positive values and red contours the negative values. The cross marks (×) denote the centre of the typhoon.
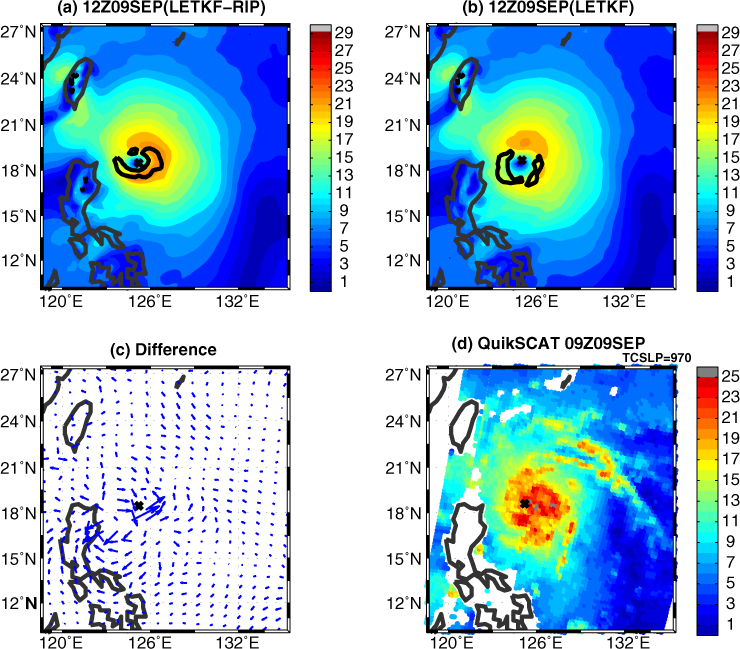
Fig. 5
(a) Near-surface wind speed of the LETKF-RIP analysis at 1200 UTC 9 September, (b) the same as (a), except from the LETKF analysis, (c) the difference of the near-surface wind speed between the LETKF-RIP and LETKF analysis and (d) wind speed from the QuikSCAT at 1200 UTC 9 September. The cross marks (×) denote the centre of the typhoon.
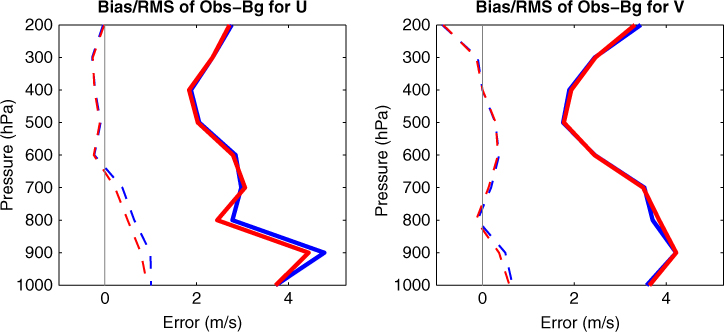
Fig. 6
(a) Bias (dashed lines) and RMS (solid lines) of the innovation vectors for the zonal velocity, (b) the same as (a) except with meridional velocity. Results with the LETKF and LETKF-RIP background are denoted in blue and red colours, respectively.
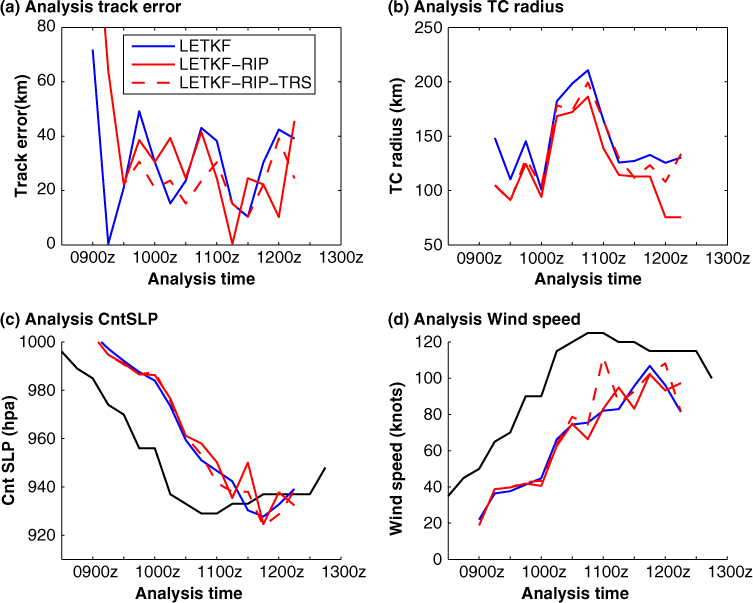
Fig. 7
Analysis errors of typhoon-related parameters: (a) track, (b) 30-kts wind radii, (c) sea-level pressure at typhoon centre and (d) maximum surface wind.
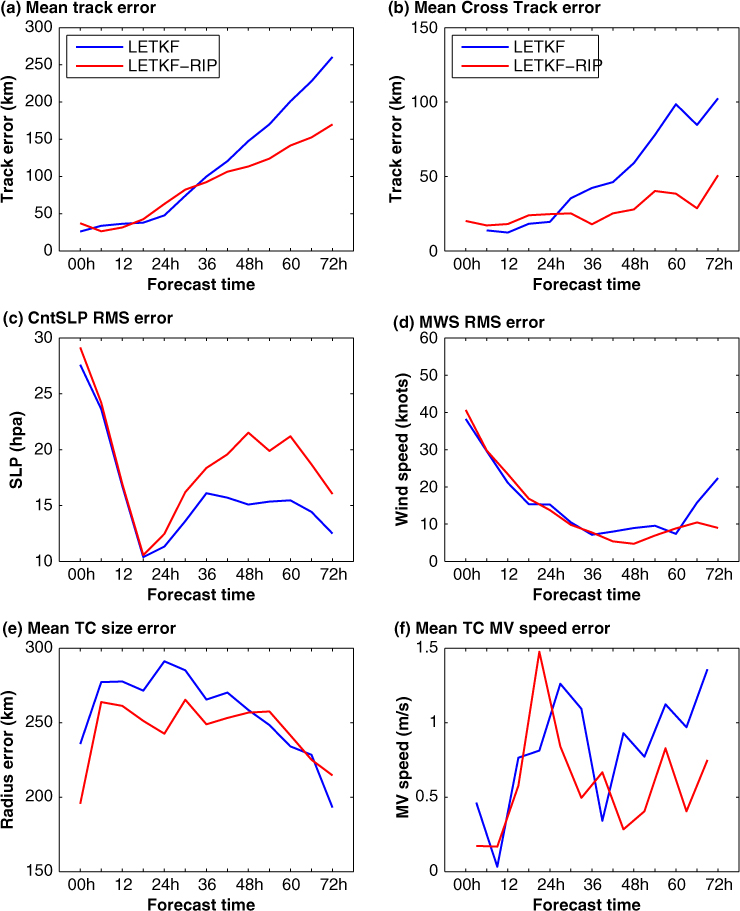
Fig. 8
Mean errors associated with typhoon parameters from the LETKF and LETKF-RIP forecasts at different forecast hours: (a) absolute track; (b) cross track error; (c) sea-level pressure at typhoon centre; (d) maximum wind speed; (e) size of the typhoon; and (f) the mean translation speed of the typhoon
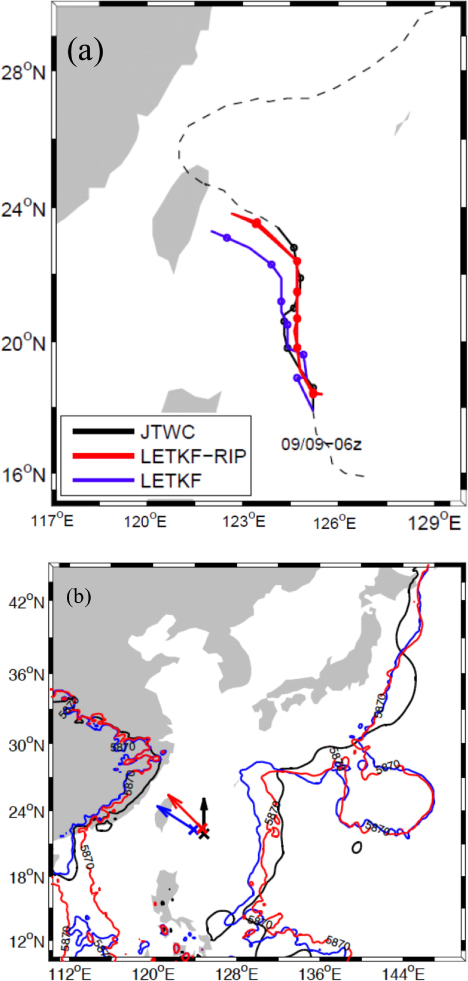
Fig. 9
(a) Typhoon track prediction initialised at 0600 UTC 9 September with the LETKF (blue) and LETKF-RIP analysis (red line). (b) The 5880 isolines of the 500 hPa geopotential height at 1200 UTC 11 September with the same initial conditions as used in (a). The arrows indicate the typhoon moving direction at 1200 UTC 11 September from the forecasts and observation (in black).
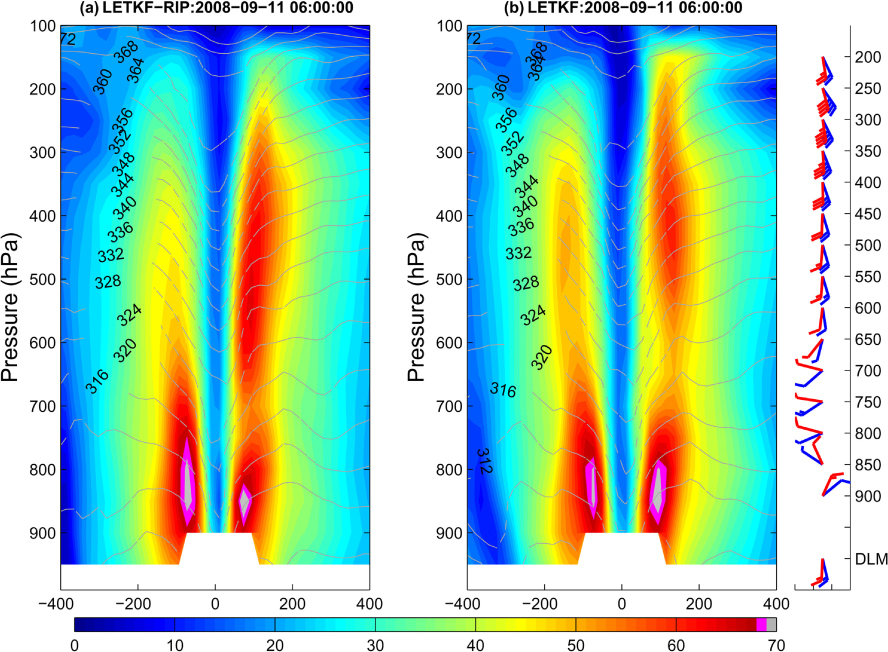
Fig. 10
East–west cross section of the typhoon vertical structure from the 2-day forecasts initialised by: (a) the LETKF-RIP and (b) the LETKF analyses at 0600 UTC 9 September 2008. The colour shading denotes the wind speed and the contours denote the potential temperature. The blue (red) wind bars on the right-hand side denote the steering flow for the typhoon in the LETKF (LETKF-RIP) forecast in the vertical, and those at the bottom are the deep layer mean wind.
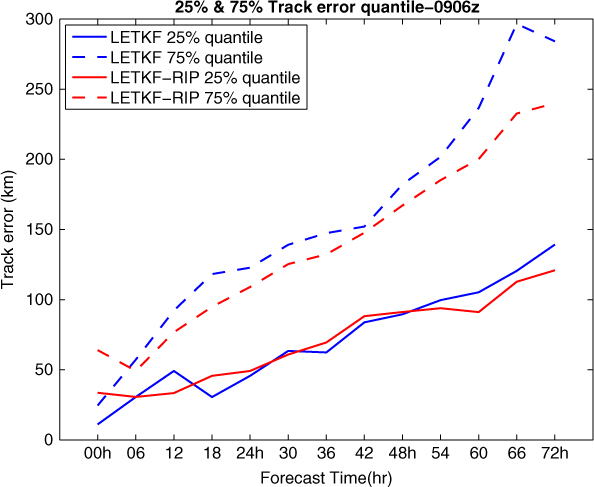
Fig. 11
The 25% and 75% quantiles of the ensemble track errors from the LETKF and LETKF-RIP ensemble forecasts initialised at 0600 UTC 9 September.
Table 1
Errors of the typhoon landfall (km) from the forecasts initialised during 9–10 September 2008
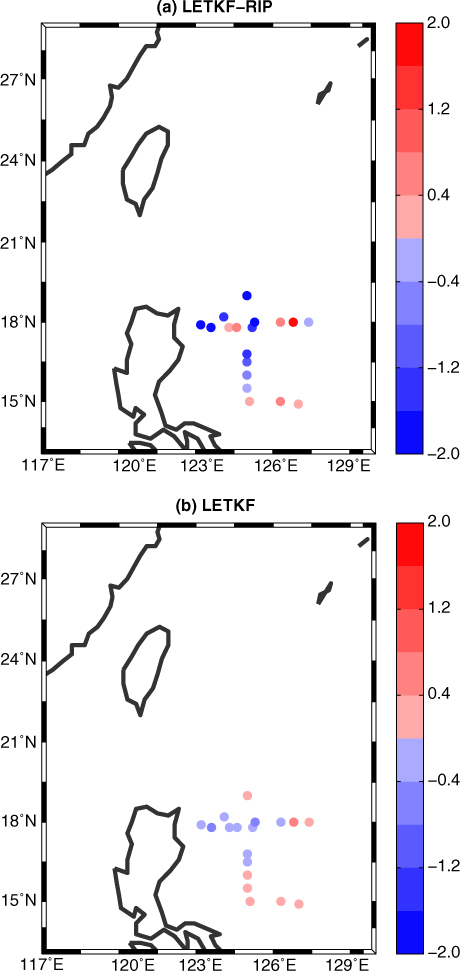
Fig. 12
Forecast sensitivity verified at 0600 UTC 11 September with respect to the dropsondes at 0600 UTC 9 September with results of the (a) LETKF-RIP and (b) LETKF analyses and forecasts. The unit of the colour bar is JKg−1.
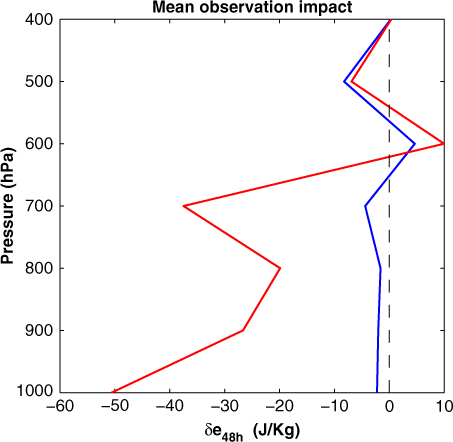
Fig. 13
Vertical distribution of the observation impact per dropsonde. The red line denotes the results obtained with the LETKF-RIP experiment and the blue line denotes the LETKF results.
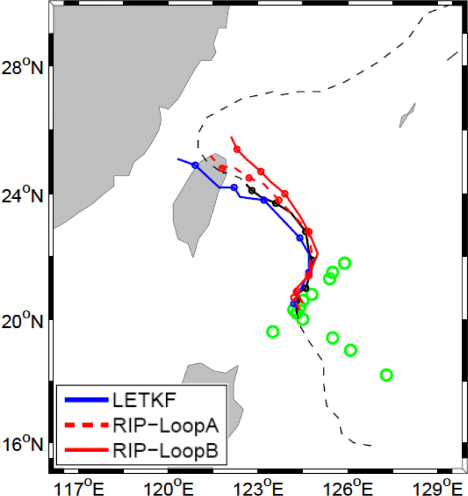
Fig. 14
Typhoon track prediction initialised at 0600 UTC 10 September with the LETKF (blue) and LETKF-RIP analysis from Loop A (red dashed line, also the first iteration) and from Loop B (red solid line, also the second iteration). Green dots are the locations of the dropsondes.
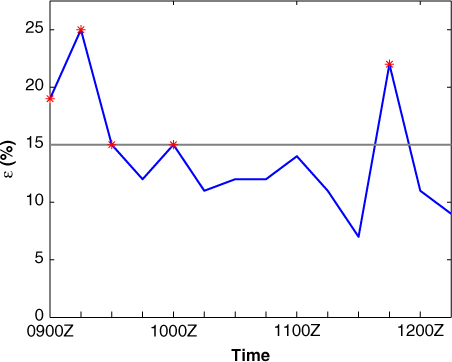
Fig. 15
Time series of the ratio ɛ. The grey line indicates the stopping criterion (15%) to automatically switch the RIP iterations on (ɛ≥15%) or off.
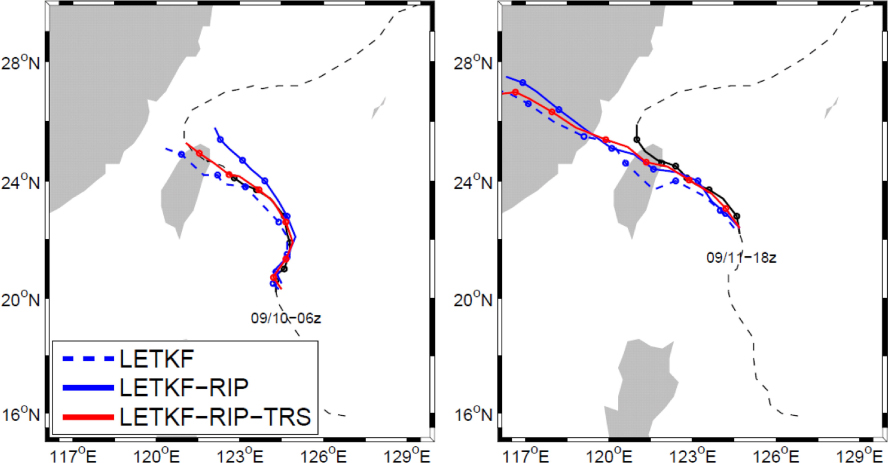
Fig. 16
(a) Typhoon track prediction initialised at 0600 UTC 10 September with the LETKF (blue dashed line), LETKF-RIP analysis (blue solid line) and LETKF-RIP-TRS analysis (red solid line). (b) Same as (a) except the initial time is 1800 UTC 11 September.
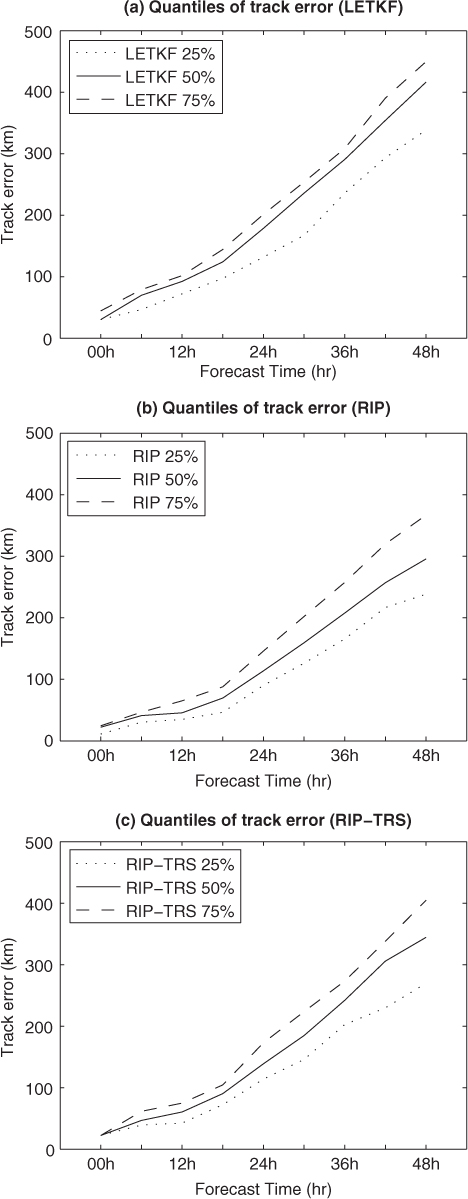
Fig. 17
The 25%, 50% and 75% quantiles of the ensemble track errors from: (a) the LETKF, (b) LETKF-RIP and (c) LETKF-RIP-TRS ensemble forecasts initialised at 1800 UTC 11 September.
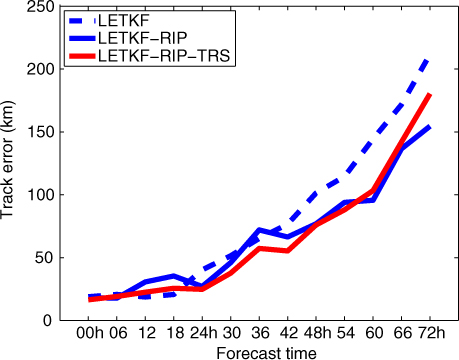
Fig. 18
Mean cross track error from the LETKF and LETKF-RIP forecasts at different forecast hours averaged from the cases initialised at 0000 UTC 9 September to 0600 UTC 12 September with a 6-hour interval.