
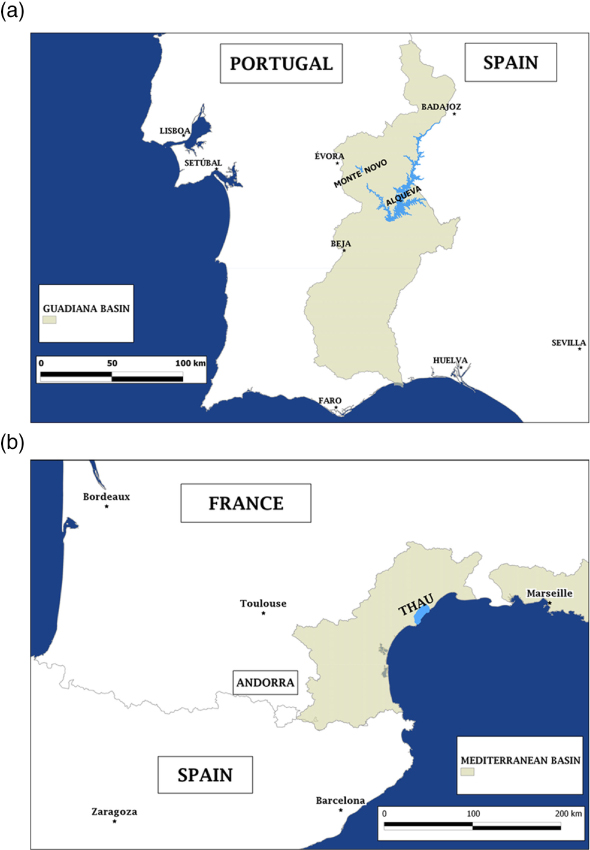
Fig. 1
Location of (a) Alqueva and Monte Novo reservoirs and (b) Thau lagoon.
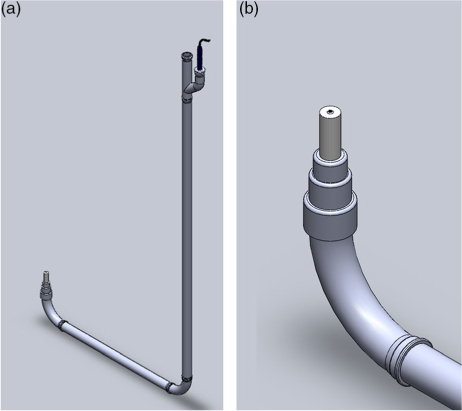
Fig. 2
(a) Second version of the frame for underwater measurements of spectral downwelling zenith radiance and (b) the tip in detail.
Table 1. Field campaign details
24 August 2011Thau52.43.10.5–22 June 2012Pool86.64.3––9 July 2012Pool42.92.7––12 July 2012Monte Novo26.61.214.850.331 August 2012Alqueva37.88.413.833.26 September 2012Alqueva41.52.614.941.713 September 2012Pool78.53.2––
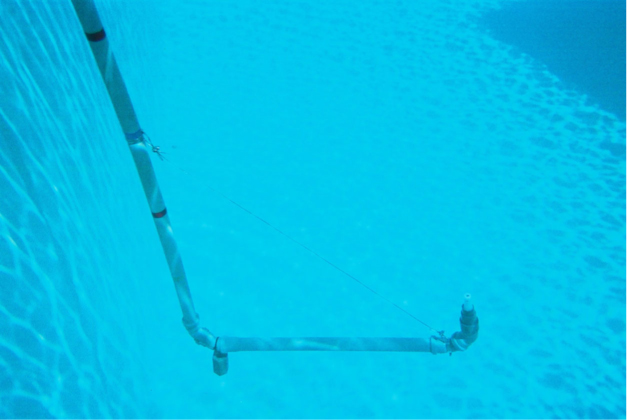
Fig. 3
Underwater environment in a 5-m deep pool from the municipal swimming complex of Évora.
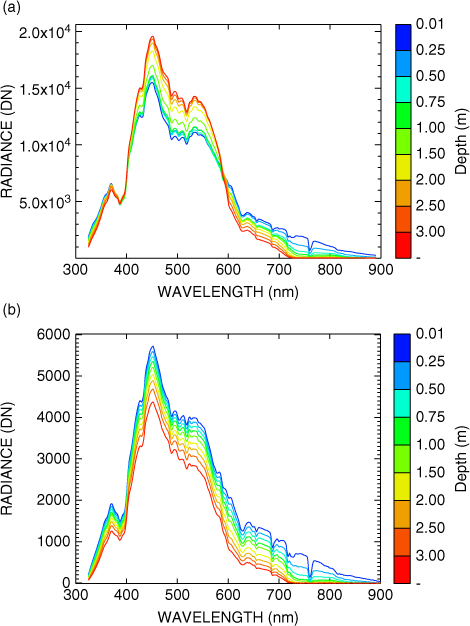
Fig. 4
Measurements of spectral downwelling zenith radiance at several levels deep in a 5-m pool with clean water for two different zenith angles: (a) 42.9° on 9 July 2012 and (b) 86.6° on 22 June 2012.
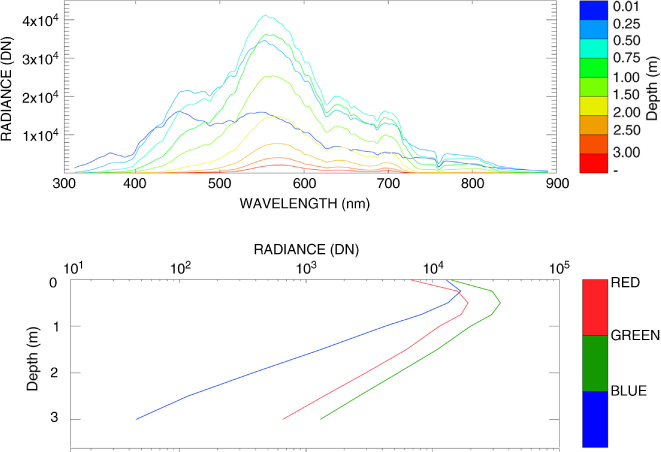
Fig. 5
Measurements of spectral downwelling zenith radiance at several levels deep in Monte Novo reservoir on 12 July 2012, for a sun zenith angle of 26.6°. In the lower panel the average radiance profiles for the blue (400–500 nm), green (500–600 nm) and red (600–700 nm) parts of the spectrum.
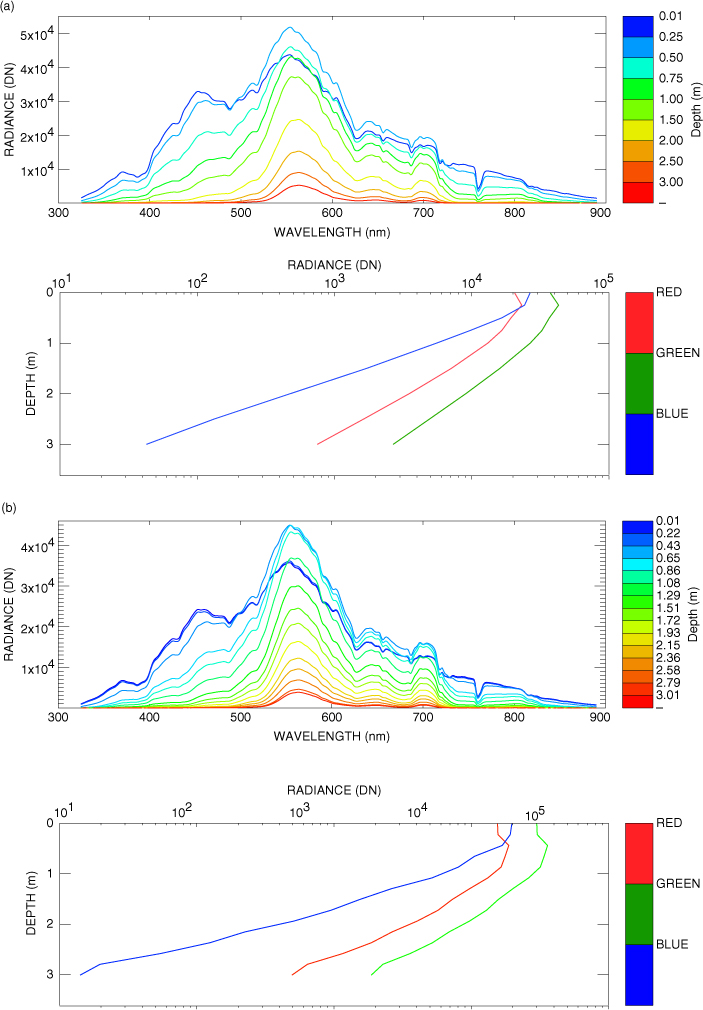
Fig. 6
Measurements of spectral downwelling zenith radiance at several levels deep in Alqueva reservoir on (a) 31 August 2012 with a wind speed of 8.4 m s−1 and sun zenith angle of 37.8° and on (b) 6 September 2012 with a wind speed of 2.6 m s−1 and sun zenith angle of 41.5° (right panel). In the lower panels the average radiance profiles for the blue (400–500 nm), green (500–600 nm) and red (600–700 nm) parts of the spectrum.
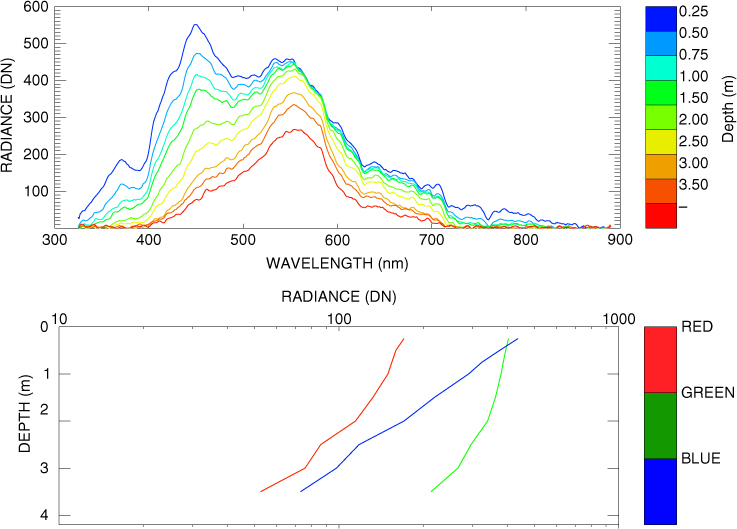
Fig. 7
Measurement of spectral downwelling zenith radiance at several levels deep in Thau lagoon on 24 August 2011. In the lower panel the average radiance profiles for the blue (400–500 nm), green (500–600 nm) and red (600–700 nm) parts of the spectrum.
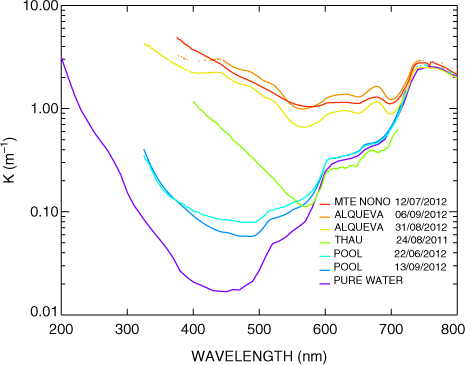
Fig. 8
Spectral attenuation coefficient for pure water obtained from Smith and Baker (1981) and for five cases of the campaigns during the summers of 2011 and 2012, derived from eq. (5).
Table 2. PAR attenuation coefficients calculated using eq. (5) for the field campaigns
24 August 2011Thau0.37N/AN/A122 June 2012Pool0.21N/AN/A19 July 2012PoolN/AN/AN/A112 July 2012Monte Novo1.651.410.37631 August 2012Alqueva1.281.310.23106 September 2012Alqueva1.161.260.22813 September 2012Pool0.200.170.042
Table 3. Relationships between attenuation coefficient (K) and turbidity (T) for several authors and for this work
Walmsley et al.1980South AfricaK=0.10(T) + 0.440.7143Grobler et al.1983South AfricaK=0.13(T) + 0.551.005Roos and Pieterse1994South AfricaK=0.06(T) + 2.350.9439Oliver et al.1999AustraliaK=0.04(T) + 0.730.9816Giblin et al.2010United StatesK=0.69(T) + 0.530.82360This work2012PortugalK=0.07(T) − 0.240.975