
Table 1. Model experiments and the corresponding set-up of external forcing agents
ControlConstantConstantConstantConstantNATVariableVariableConstantConstantANTConstantConstantVariableVariableALLVariableVariableVariableVariable
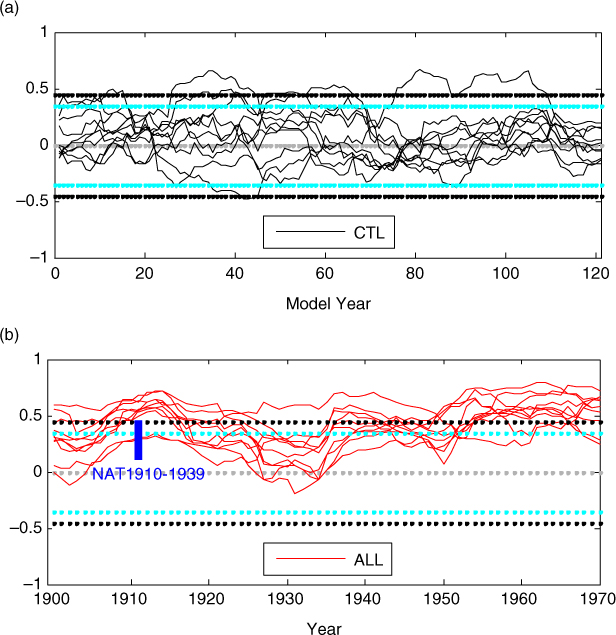
Fig. 1
Thirty-year running inter-correlations of the Arctic (north to 60°N) mean SAT annual time series among all five ensemble members (a) in CTL; (b) in ALL. The blue bar in (b) shows the range of the 10 inter-correlation coefficients over the early warming period 1910–1939 in NAT. The black/cyan dotted lines refer to the 99%/95% significance level of the correlation coefficients. The labelled year is the first year to compute the correlation; for example, the values marked at year 1910 represent the correlation coefficients computed from 1910 to 1939.
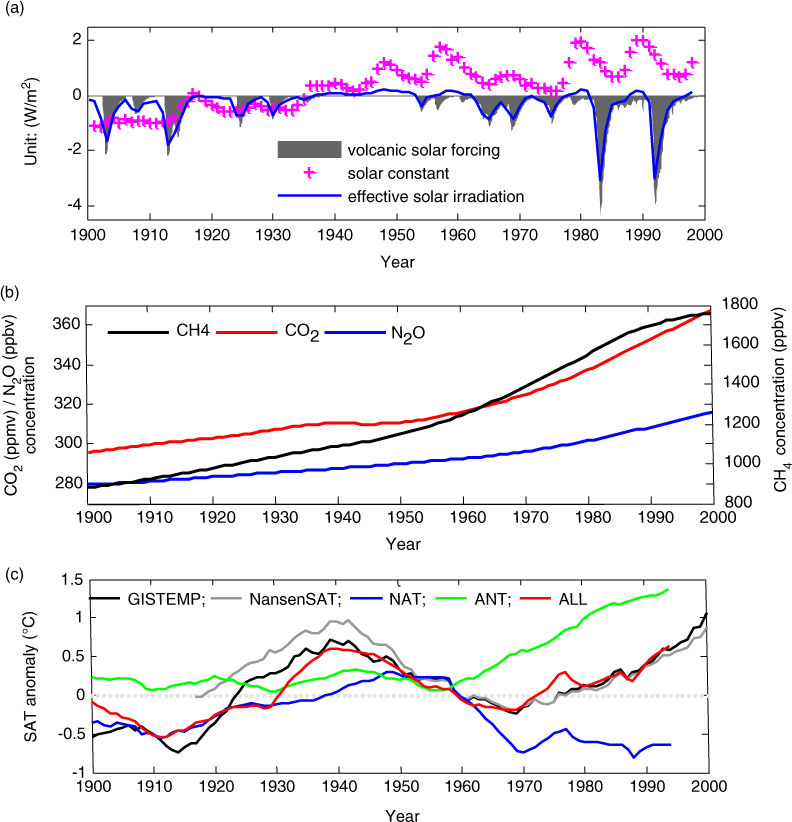
Fig. 2
(a) Anomalies of annual effective solar irradiation (30°N–90°N) and annual solar constant relative to the 1850–1999 mean and monthly solar irradiation changes caused by volcanic eruptions (30°N–90°N); (b) CO2 (unit: ppmv), N2O (unit: ppbv) and CH4 (unit: ppbv) concentrations; (c) 11-yr running-mean annual-mean surface air temperature (SAT) anomaly in the Arctic (north to 60°N) in observations and BCM simulation; the labelled year is the middle of the 11 yr used for computation.
Table 2. The trends of 11-yr running-mean annual-mean SAT in the Arctic (north to 60°N) during selected periods in observations and ALL (unit: °C/decade)
NansenSATUnavailable−0.420.27GISTEMP0.54−0.320.30ALL0.38−0.320.23
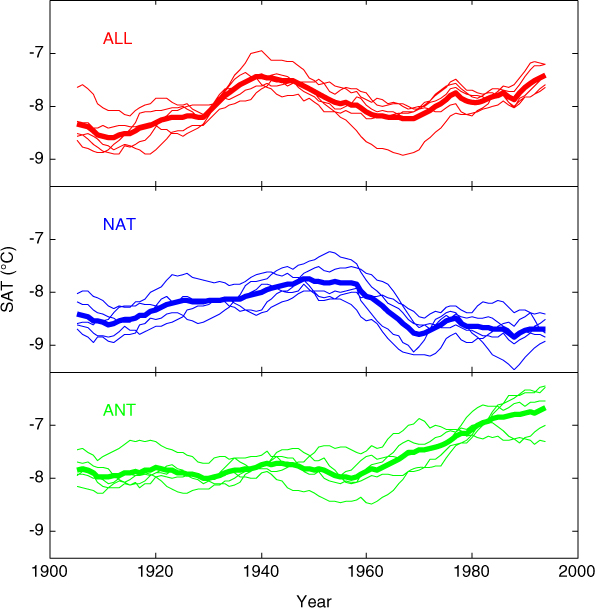
Fig. 3
Eleven-year running-mean annual-mean Arctic SAT averages in five ensembles (thin lines) and ensemble mean (thick lines) of ALL, NAT and ANT experiments.
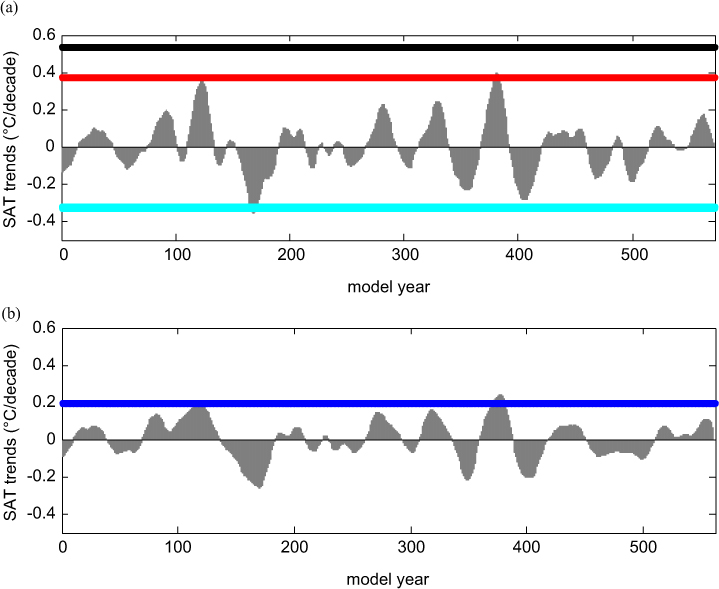
Fig. 4
The running trends of the 11-yr running-mean SAT in 600-yr control run with the running window width as (a) 30 yr and (b) 40 yr. The red/black lines in (a) indicate the 1910–1939 warming trend in ALL/GISTEMP. The cyan line in (a) indicates the 1940–1969 cooling trend in ALL and GISTEMP. The blue line in (b) indicates the 1910–1949 warming trend in NAT (unit: °C/decade).
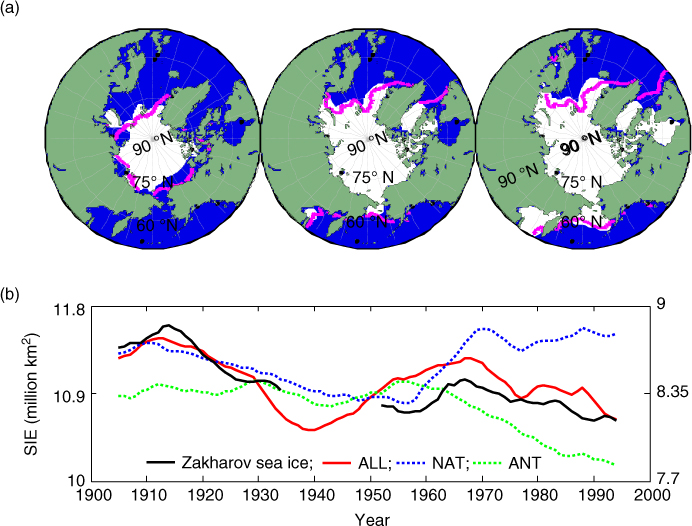
Fig. 5
(a) Sea-ice extent climatology in BCM simulation (white shading, 600-yr mean of a pre-industrial control run) and HadISST1 (solid purple line, 1979–1988 averages) in September (left), December (middle) and March (right); (b) 11-yr running-mean annual-mean sea-ice extent (SIE, left ordinate for model experiments and right ordinate for Zakharov data) variations.
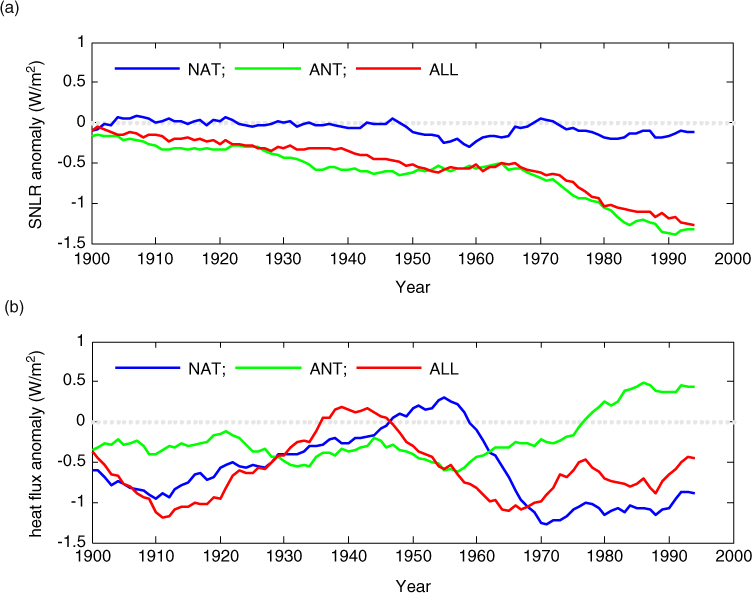
Fig. 6
Eleven-year running-mean anomaly of simulated annual-mean (a) surface net long-wave radiation (SNLR, upward is positive) and heat flux (latent heat flux plus sensible heat flux, upward is positive) in the Arctic (north to 60°N).
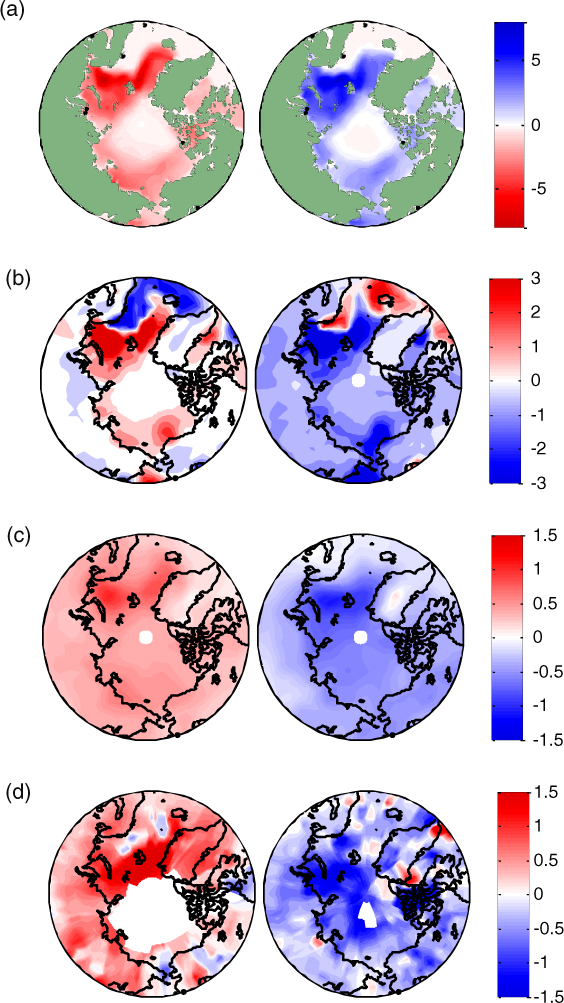
Fig. 7
Trends of annual-mean (a) sea-ice concentration (unit: percent/decade); (b) surface upward heat flux (unit: Wm−2/decade); (c) surface air temperature (unit: °C/decade) in ALL forcing run and (d) surface air temperature (unit: °C/decade) in NansenSAT (blank: missing value regions) during 1910–1939 (left) and 1940–1969 (right). We adopt only the grids with more than 20 yr of available observations in NansenSAT in the 30-yr periods from 1910–1939 or 1940–1969 to calculate the trends which are shown in Fig. 6d.
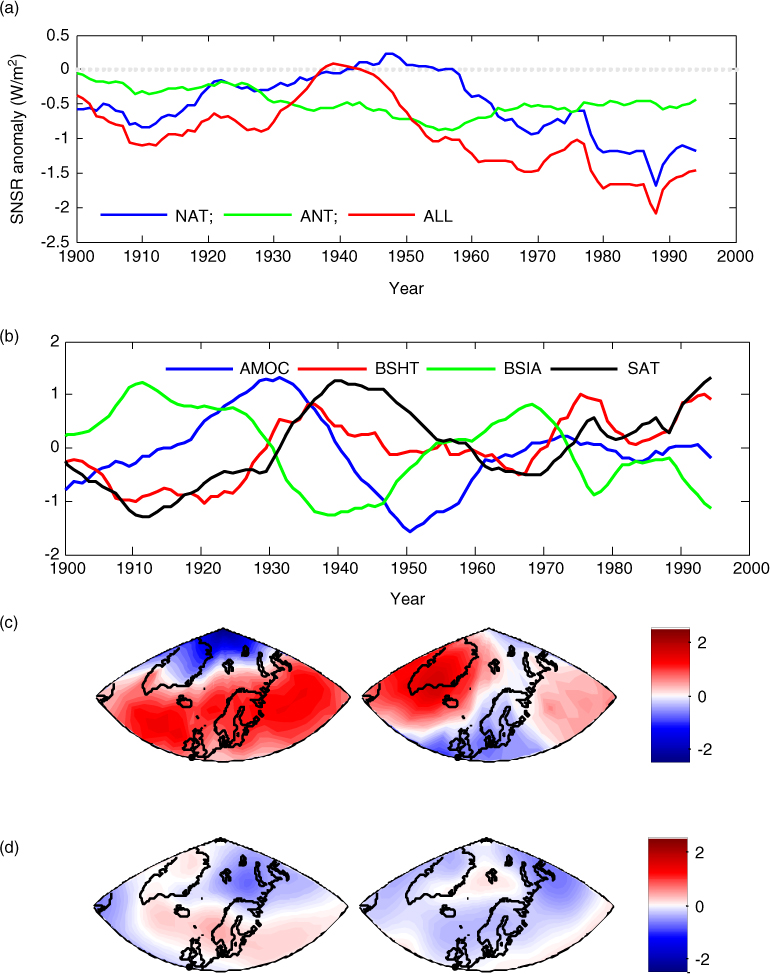
Fig. 8
(a) Eleven-year running-mean anomaly of simulated annual-mean surface net short-wave radiation (SNSR, downward is positive) in the Arctic (north to 60°N); (b) 11-yr running-mean standardized annual-mean Atlantic meridional overturning circulation (AMOC), Barents Sea heat transport (BSHT), Barents Sea ice area (BSIA) with surface air temperature (SAT) in the ALL experiment; trends of sea level pressure in (c) HadSLP2 and (d) ALL (unit: hPa/decade) during 1910–1939 (left) and 1940–1969 (right) (50°N–90°N, 300°W–80°E).