Fig. 1.
The Mediterranean basin region. The black squares indicate the location of the studied events.
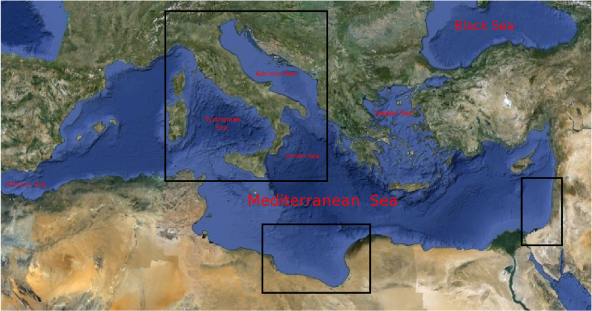
Fig. 2.
Smallest domain (1 km horizontal resolution) defined in WRF simulation for the Israel–Lebanon event. The blue line AA’ indicates the projection of the vertical cross section used to analyse the episode.
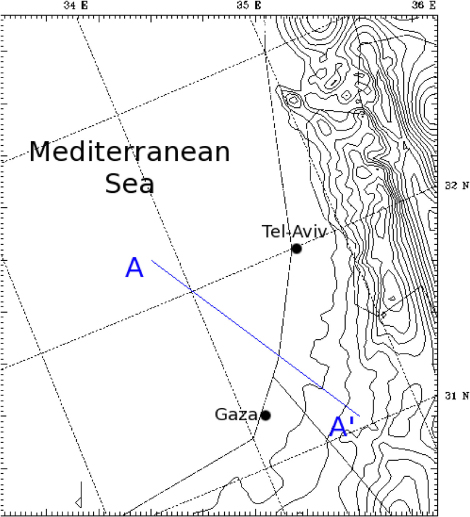
Fig. 3.
Simulated divergence (negative convergence, colour contours) and wind field (arrows) in the smallest domain at (a) 00 UTC, (b) 04 UTC and (c) 08 UTC on 6 January 2011. The black dot indicates the city of Tel-Aviv. The maximum wind speed is 7.4 m s−1.
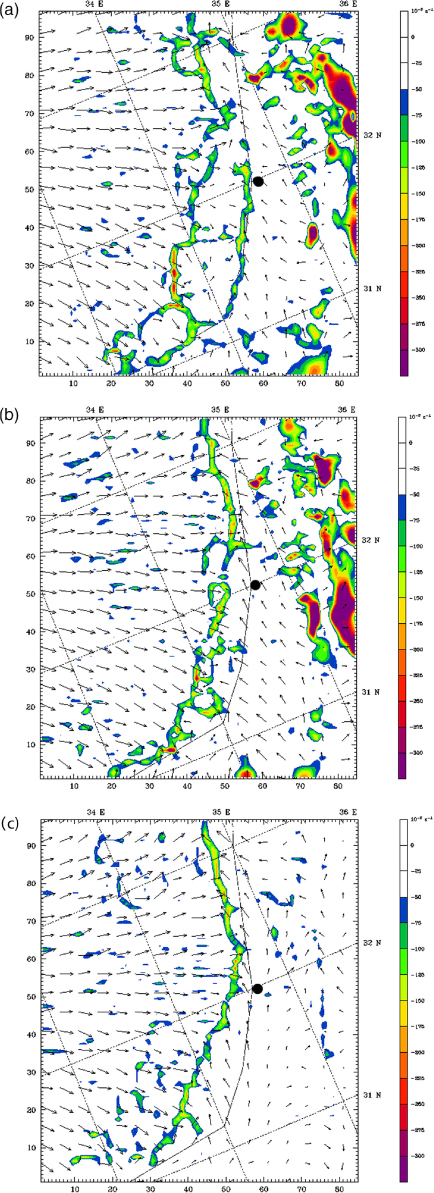
Fig. 4.
Simulated hourly accumulated precipitation (colour contours) and wind field (arrows) at (a) 00 UTC, (b) 04 UTC, (c) 06 UTC and (d) 08 UTC on 6 January 2011. The black dot indicates the city of Tel-Aviv. The maximum wind speed is 6.8 m s−1 (a), 6.1 m s−1 (b), 7.3 m s−1 (c) and 6 m s−1 (d).
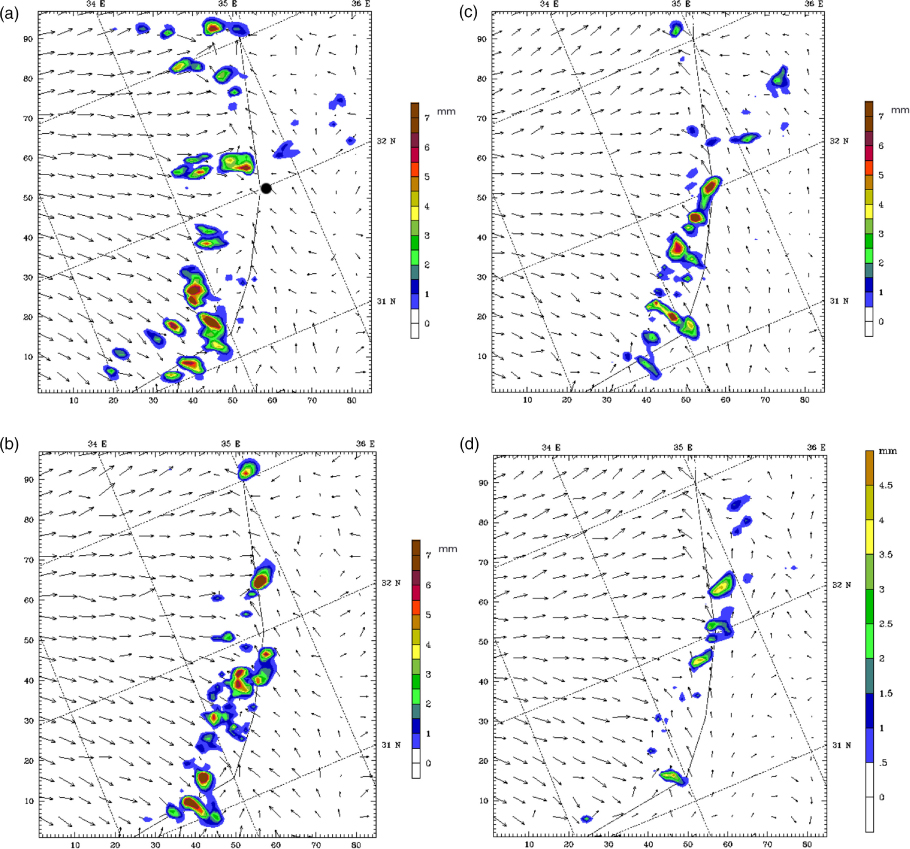
Fig. 5.
Vertical cross section defined along the blue line AA’ shown in Fig. 1 of the simulated potential temperature (colour contours), equivalent potential temperature (line contours) and wind field (arrows) at (a) 00 UTC, (b) 04 UTC, (c) 06 UTC and (d) 08 UTC on 6 January 2011.
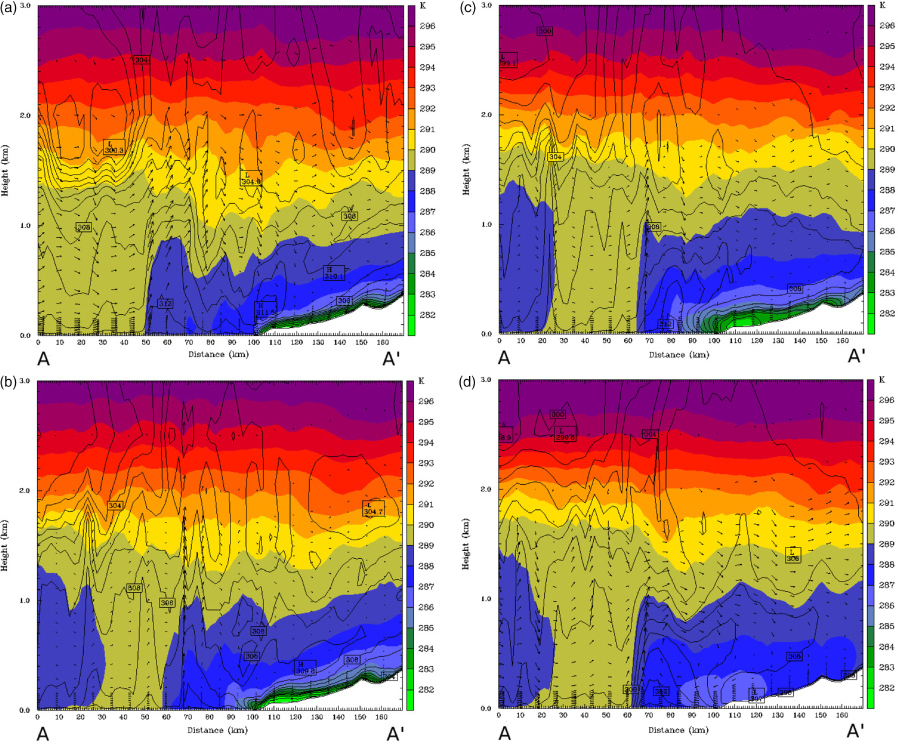
Table 1. The simulated depth of the cold drained air (h), LFC, the frontal relative velocity of synoptic and drainage winds (U), parameters NLFC/U and B at several hours during the night of 6 January 2011
Fig. 6.
Smallest domain defined in WRF simulation on 30 January 2011. The red (BB’) and blue (AA’) lines are the projection of the vertical cross section.
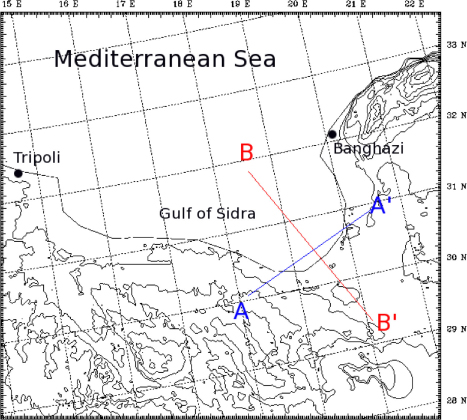
Fig. 7.
Simulated hourly accumulated precipitation (colour contours) and wind field (arrows) in the smallest domain at 03 UTC (a) and 08 UTC (b). The maximum wind speed is 11.3 m s−1 at 03 UTC and 12.1 m s−1 at 08 UTC.
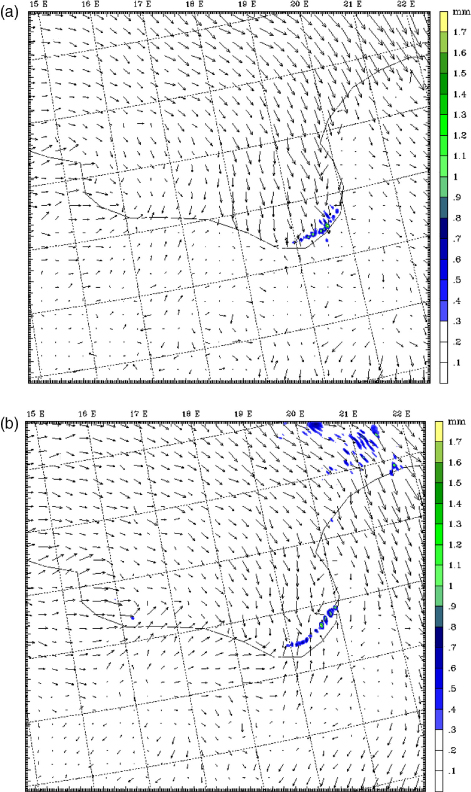
Fig. 8.
Vertical cross section defined along the blue line AA’ shown in Fig. 6 of the simulated potential temperature (colour contours), equivalent potential temperature (line contours) and the wind field (arrows) on 30 January 2011 at (a) 03 UTC, (b) 06 UTC and (c) 08 UTC. The maximum vertical velocity is 1.3 m s−1.
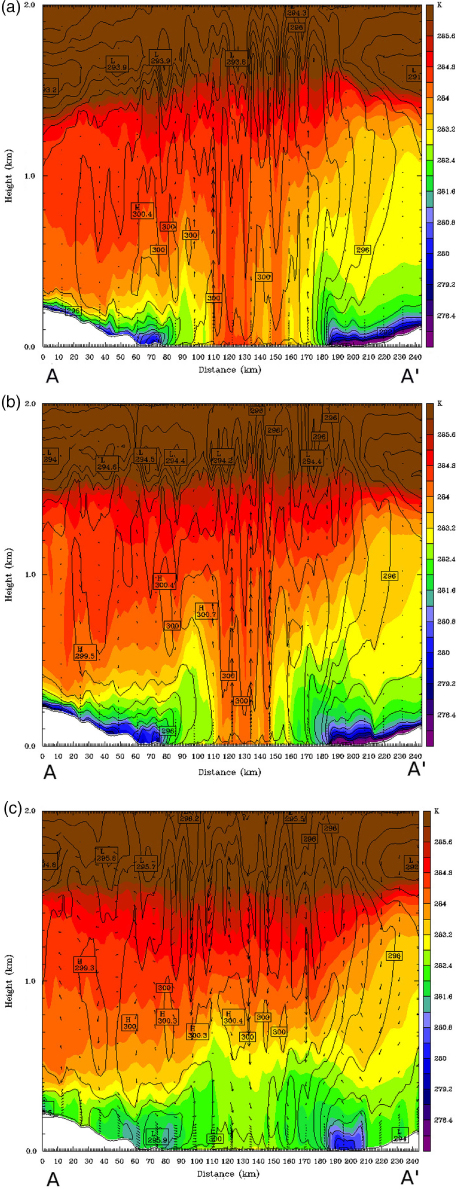
Fig. 9.
WRF domain defined for the 27 September 2004 event.
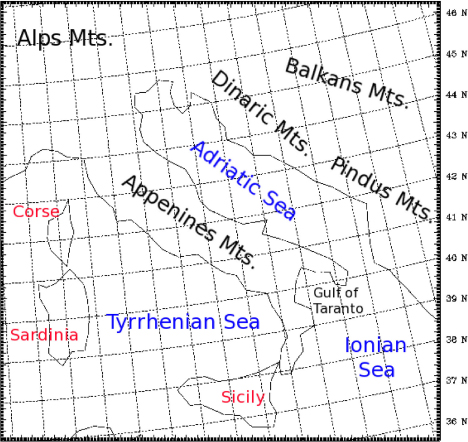
Fig. 10.
Simulated accumulated precipitation (colour contours) and wind field (arrows) at (a) 03 UTC and (b) 08 UTC on 27 September 2004. The maximum wind speed is 11.1 m s−1 and 12.5 m s−1 in upper and lower panels, respectively.
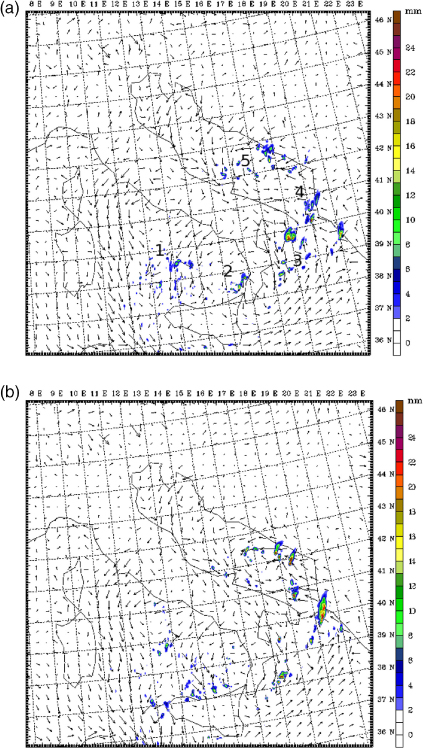
Fig. 11.
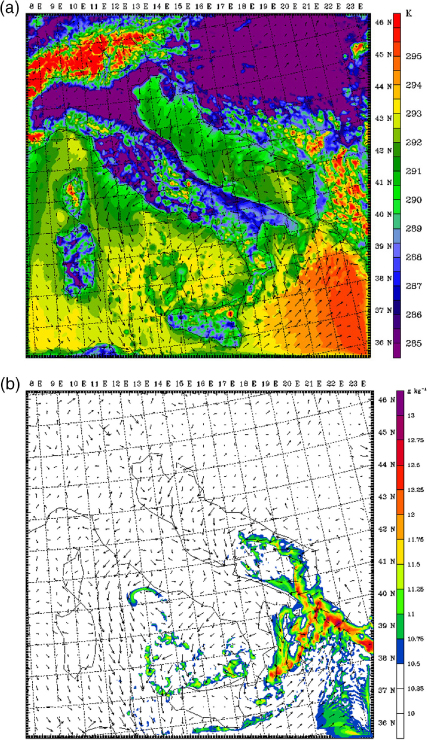
Simulated wind field (arrows) and (a) potential temperature (colour contours) and (b) vapour mixing ratio at 06 UTC on 27 September 2004.