
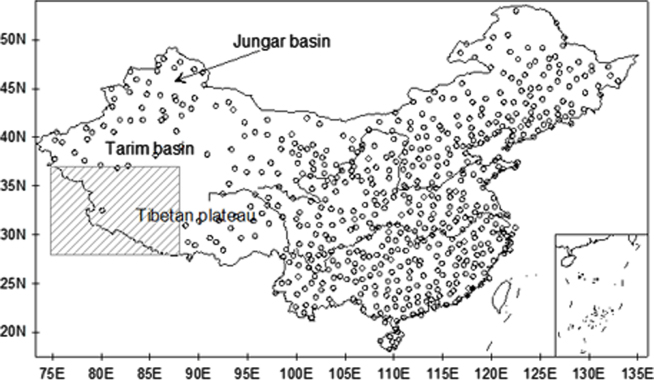
Fig. 1
Geographic location of the 592 stations with daily precipitation during 1961–2000 over Mainland China. (The western Tibet Plateau region (south of 37°N, west of 88°E, shaded box) contains few instrumental observations and was excluded in the comparison between model simulations and observations).
Table 1. Definition of the 10 precipitation indices used (most of them indicate extreme precipitation conditions)
Table 2. Horizontal resolution (longitude×latitude in degrees) of the 21 CMIP5 global climate models used
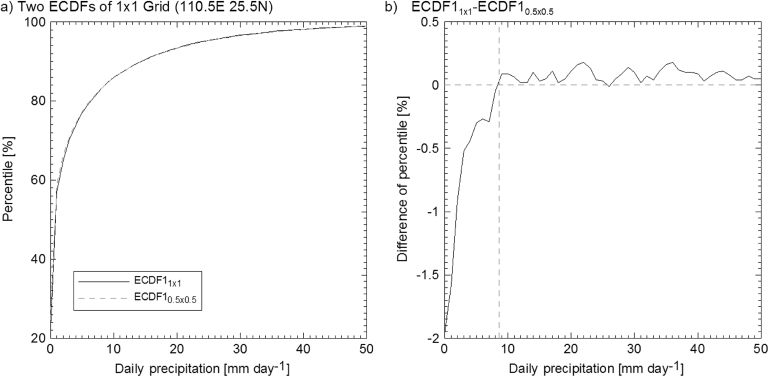
Fig. 2
Empirical cumulative distribution function (ECDF) of 1×1° grid-cell centered at (110.5°E, 25.5°N) as an example (a) (ECDF11×1 indicates the ECDF of 1×1° by calculating the ECDF for the 1×1° grid box directly, ECDF10.5×0.5 indicates the ECDF of 1×1° by averaging the ECDFs of all 0.5×0.5° grids falling in 1×1° grid-box), and (b) shows the difference between two types of ECDF of 1×1° (ECDF11×1−ECDF10.5×0.5) in (a).
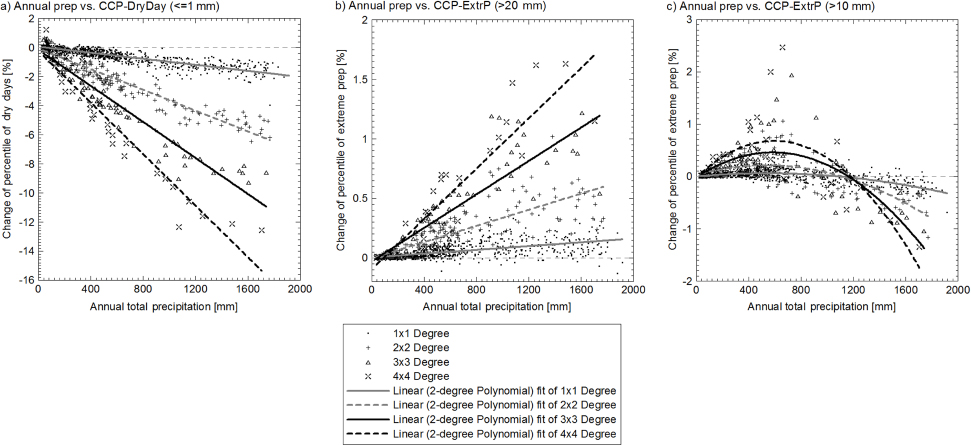
Fig. 3
The relationship between annual total precipitation and the change of cumulative percentage of dry day (prep≤1 mm) (CCP-DryDay) for four resolutions (CCP-DryDay is the difference of cumulative percentage of dry day for i×i° (i indicates 1, 2, 3 and 4, which means four different resolutions from 1×1° to 4×4°) between the cumulative percentage of dry day calculated from i×i° precipitation directly and the mean of the cumulative percentage of dry day of all the 0.5×0.5° grid falling in the i×i° grid-box) (a), (b) same as (a) but for the change of cumulative percentage of extreme precipitation day (CCP-ExtrP) with daily precipitation higher than 20 mm, and (c) same as (b) but for daily precipitation higher than 10 mm.
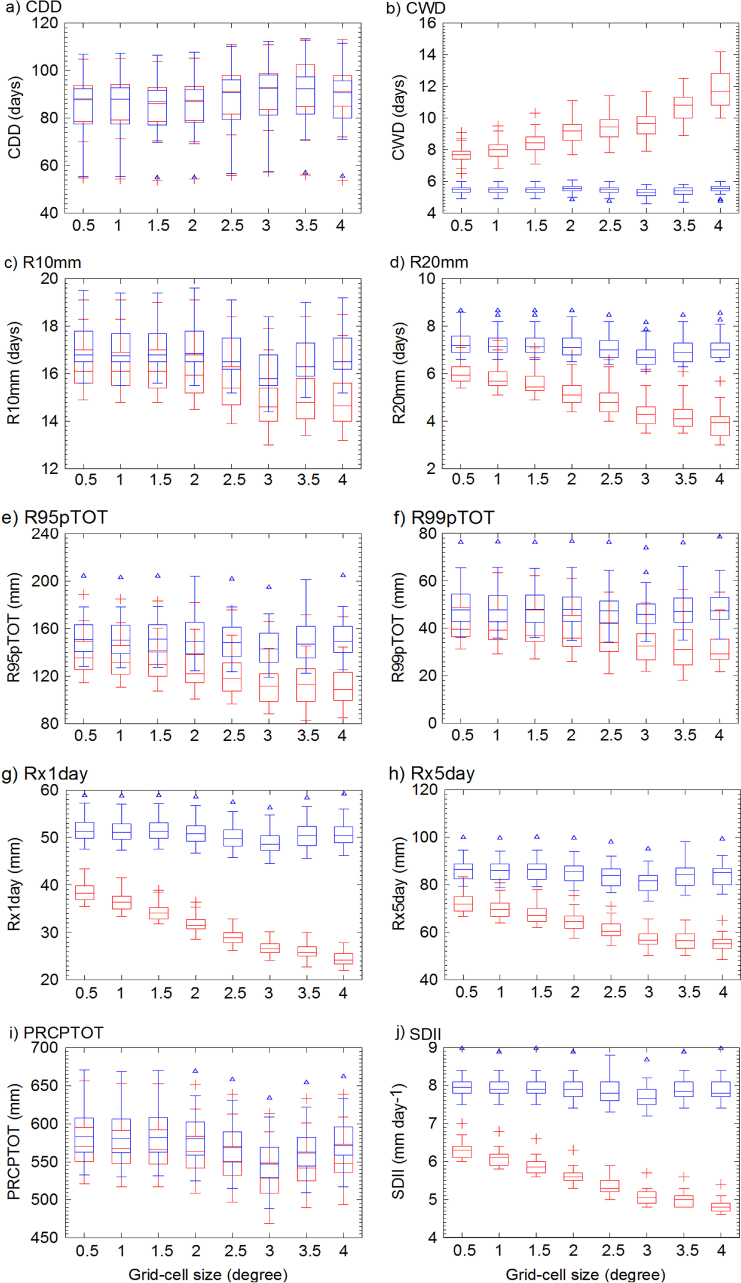
Fig. 4
Comparison between extreme precipitation indices based on EISTA (Blue) and EIGRID (Red) over Mainland China with 8 different horizontal resolutions (0.5×0.5, 1×1, 1.5×1.5, 2×2, 2.5×2.5, 3×3, 3.5×3.5, and 4×4 degree) for the 10 indices (a–j) listed in Table 1. The Box–Whisker plots show the statistic characteristic of the indices at the selected resolution during 1961–2000. The lower, middle and upper lines of the box show the lower quartile (Q1, QL is the value of Q1), median (Q2), upper quartile (Q3, QU is the value of Q3) respectively, while the ends of the whiskers shows the lowest datum still within 1.5 interquartile range (IQR, IQR = QU-QL) of the Q1, and the highest datum still within 1.5 IQR of the Q3. Data fall below QL−1.5×IQR or above QU−1.5×IQR have been shown as outliers.
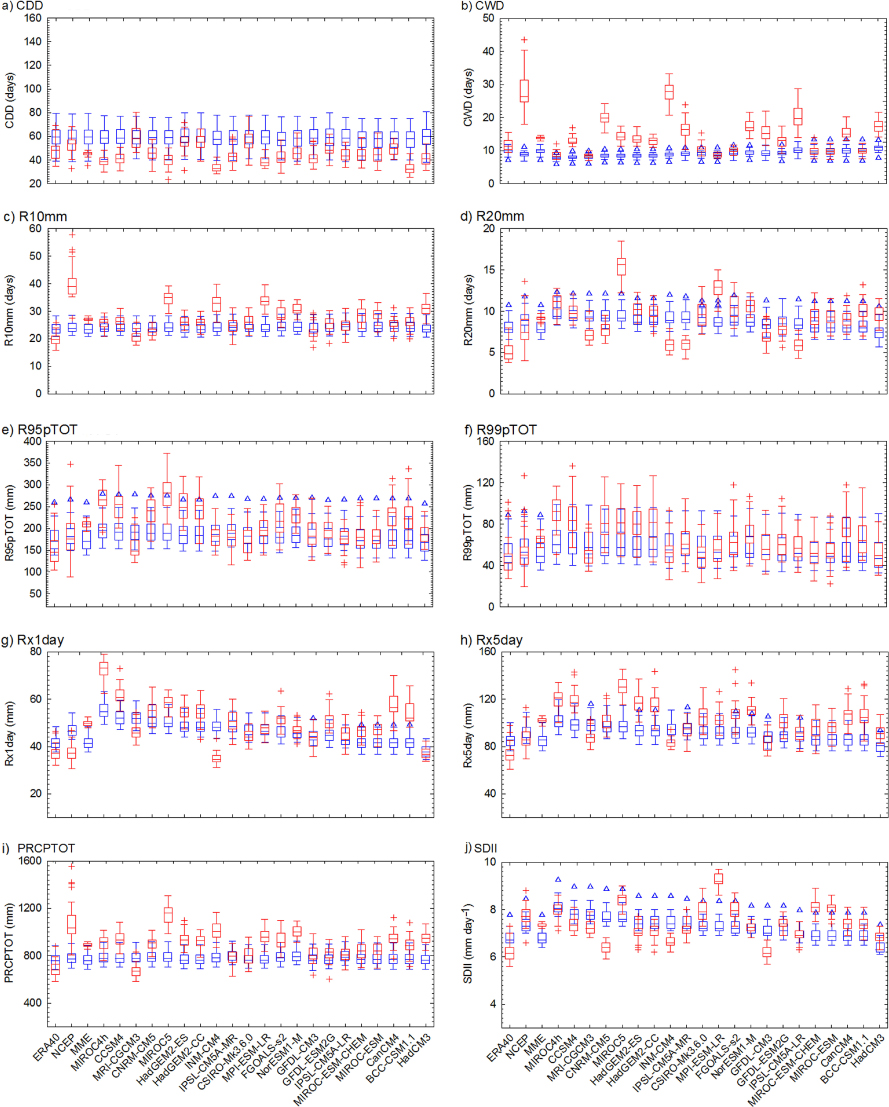
Fig. 5
Comparison of extreme indices from 21 CMIP5 global climate models, multi-model ensemble (MME) and two reanalysis (Red) and gridded observation based on EIGRID with the same resolution (Blue) over Eastern China (south of 21°N is not counted) for 10 precipitation indices (a–j) (Same Box–Whisker Plots as in Fig. 4 have been used).
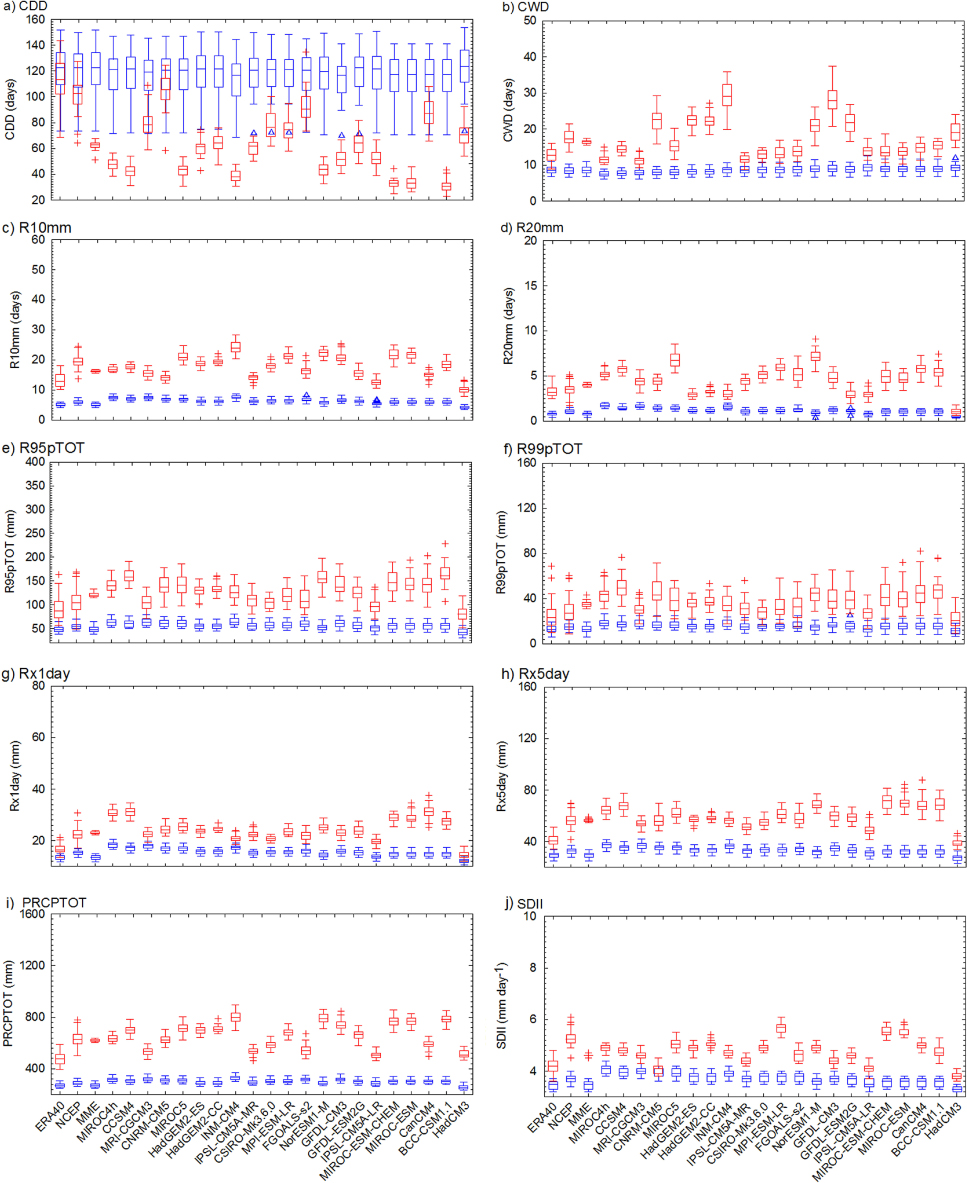
Fig. 6
Same as Fig. 5, but for western China (the west Tibet Plateau region (south of 37°N, west of 88°E) is not included).
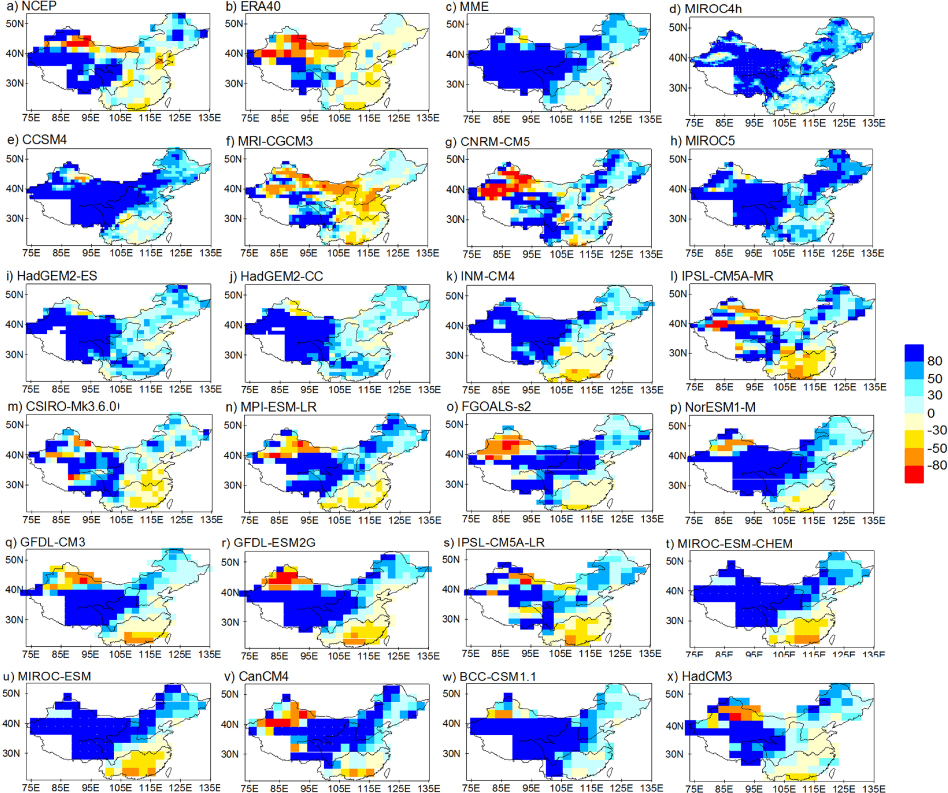
Fig. 7
Relative error of mean R95pTOT during 1961–2000 for two reanalysis (a, b), multi-model ensemble (MME) (c) and 21 CMIP5 global climate models (d–x) (units: % of observation values).
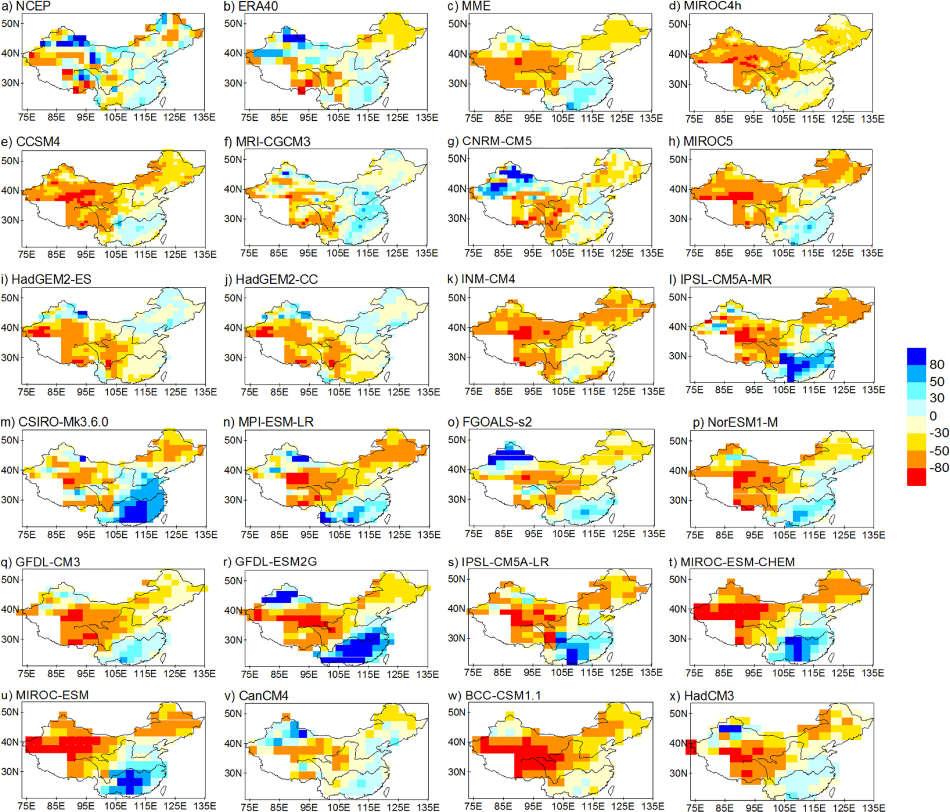
Fig. 8
Same as Fig. 7, but for CDD.
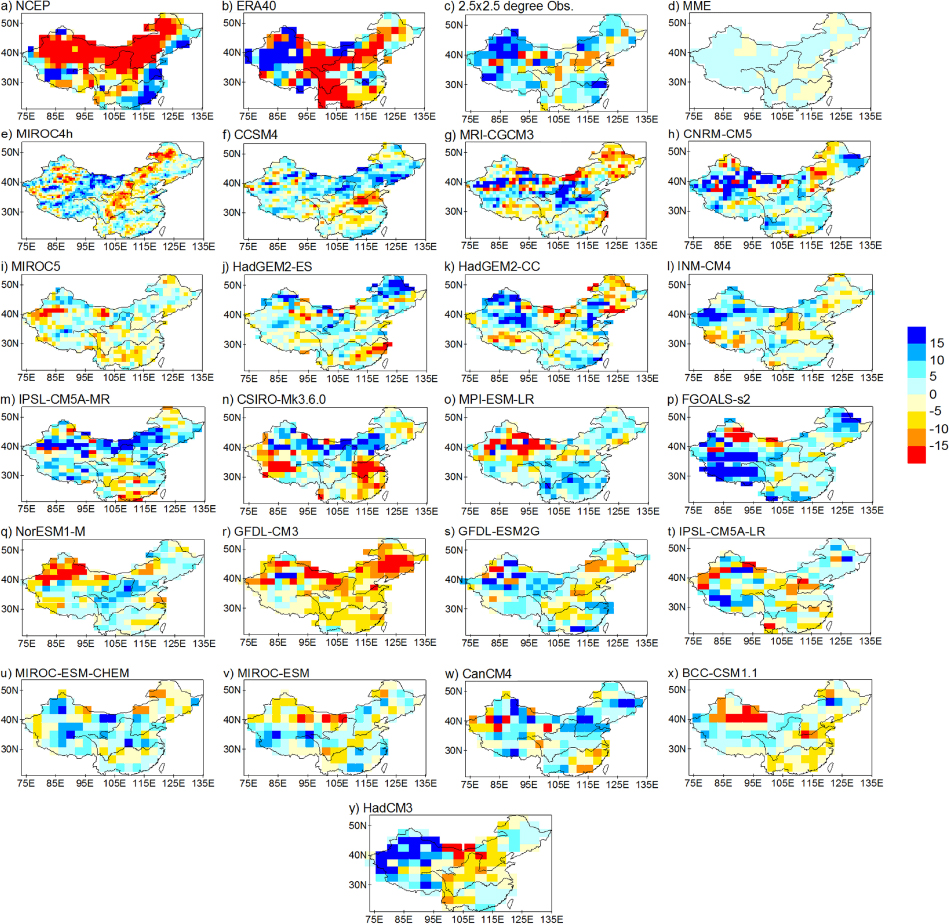
Fig. 9
Linear trend of R95pTOT during 1961–2000 (units: % per 10 yr) for two reanalysis (a, b), gridded observation based on EIGRID at 2.5×2.5° resolution (c), multi-model ensemble (MME) (d) and 21 CMIP5 global climate models (e–y).
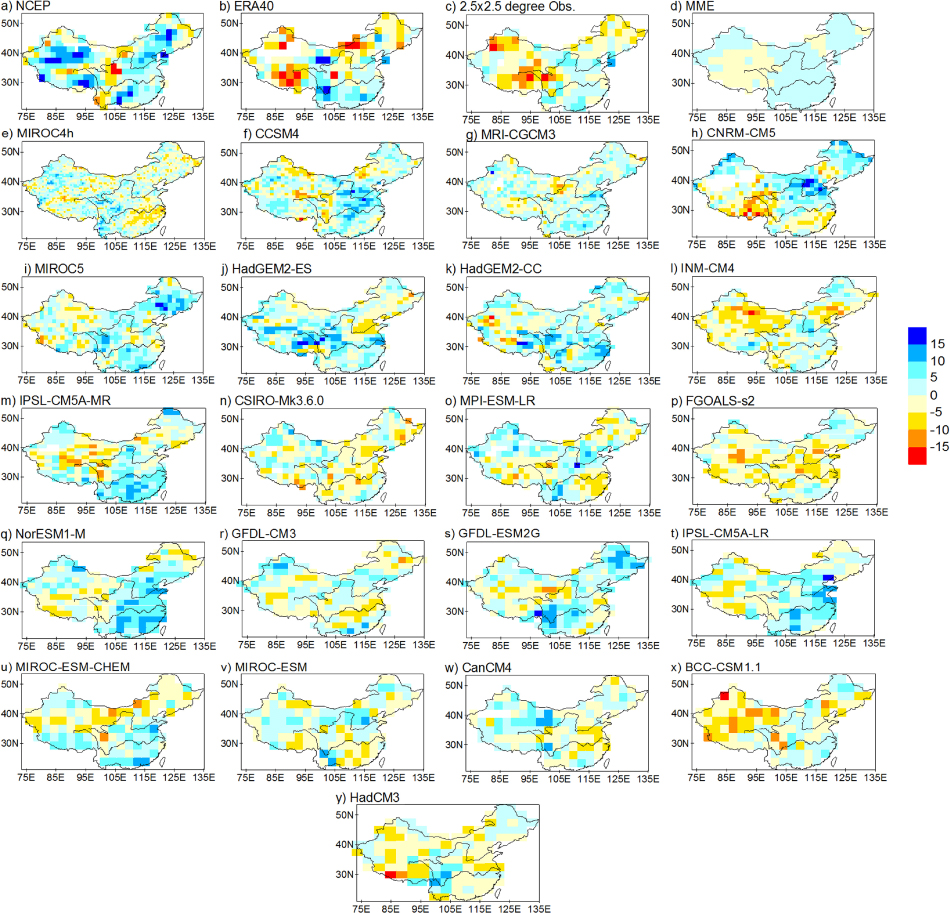
Fig. 10
Same as Fig. 9, but for CDD.