
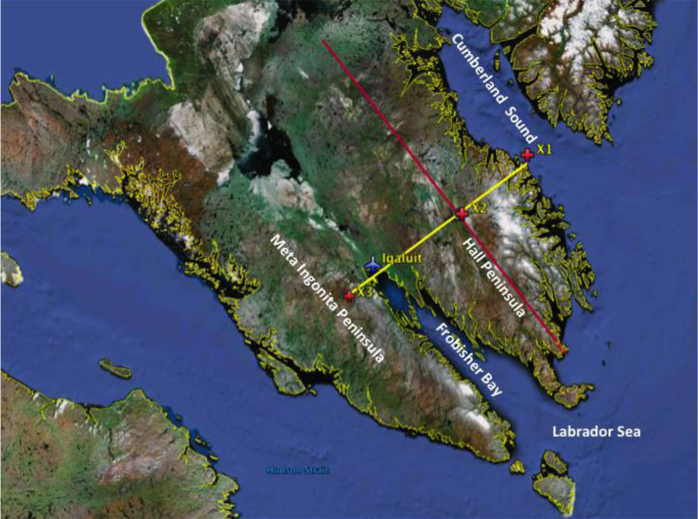
Fig. 1
Study area over Baffin Island. The location of Iqaluit is indicated by the aircraft symbol. The locations X1, X2 and X3 are discussed in the text. The cross-sections in Section 5 are along the yellow transect (X1–X3). The pressure gradients at 1 km ASL in Table 1 are calculated along the red transect along the Hall Peninsula.
Table 1
Summary of properties of key wind parameters for the northeasterly wind events at Iqaluit discussed in the paper
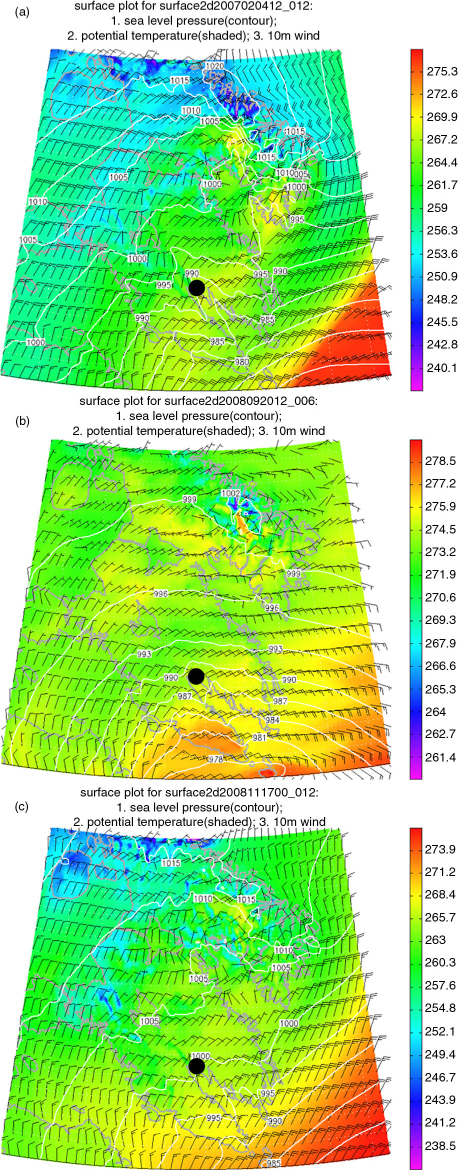
Fig. 2
The predicted 2-m potential temperature, sea-level pressure, and 10-m wind barbs near the time of maximum observed winds for a) 4 February 2007; b) 20 September 2008; and c) 17 November 2008. Location of Iqaluit is shown by a black dot.
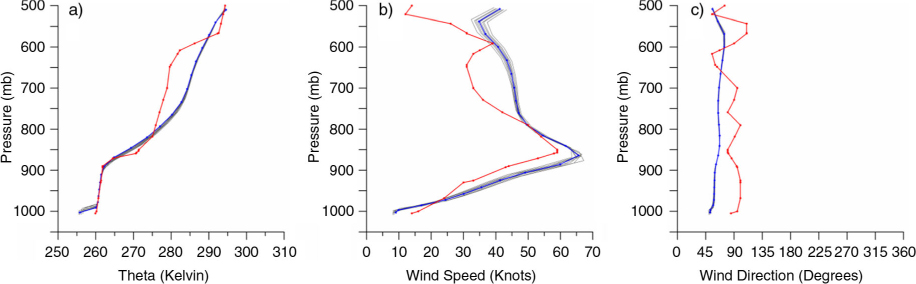
Fig. 3
Comparison of modelled versus observed vertical profiles at Iqaluit for 12 UTC on 4 February 2007. Left panel is the potential temperature (κ), middle panel is the wind speed, and right panel is the wind direction. Red traces represent the observed sounding data, blue traces the mean of the predicted data for the nine GEM-LAM grid points surrounding Iqaluit airport, and the grey traces the data for the individual nine data points. Only data below 500 mb are shown.
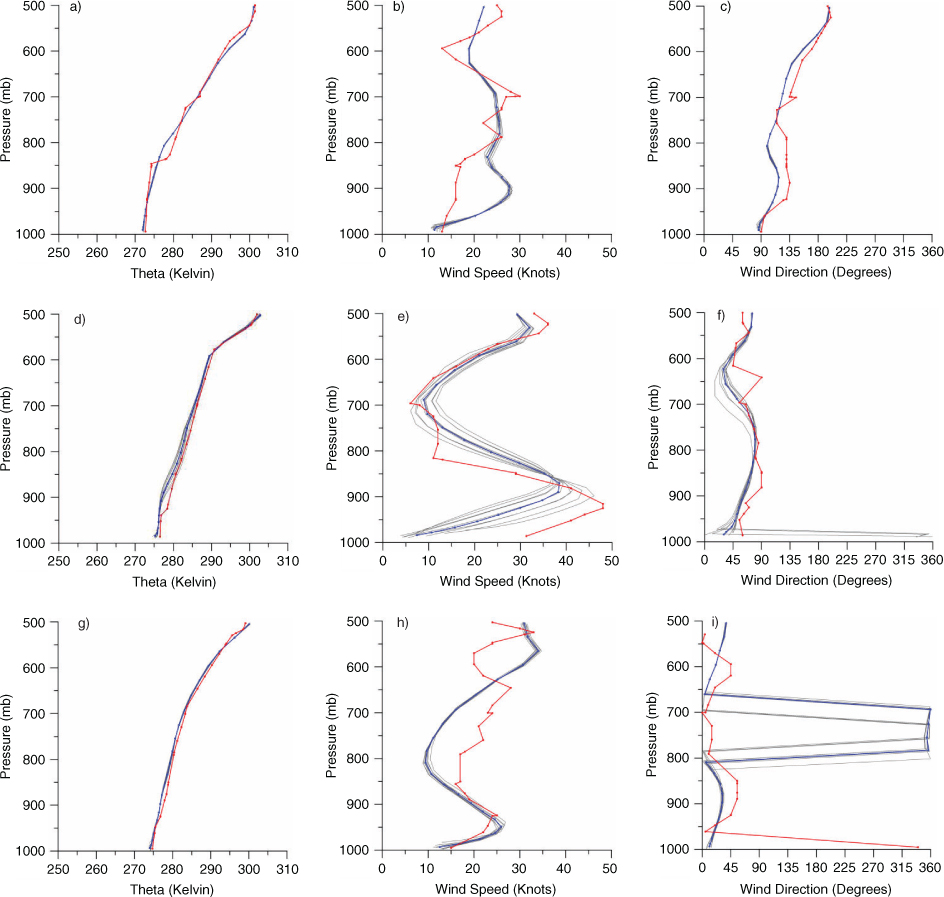
Fig. 4
Comparison of modelled versus observed vertical profiles at Iqaluit for the 20 September 2008 event. Top panel is for 12 UTC 20 September, middle panel for 00 UTC 21 September and bottom panel is for 12 UTC 21 September.
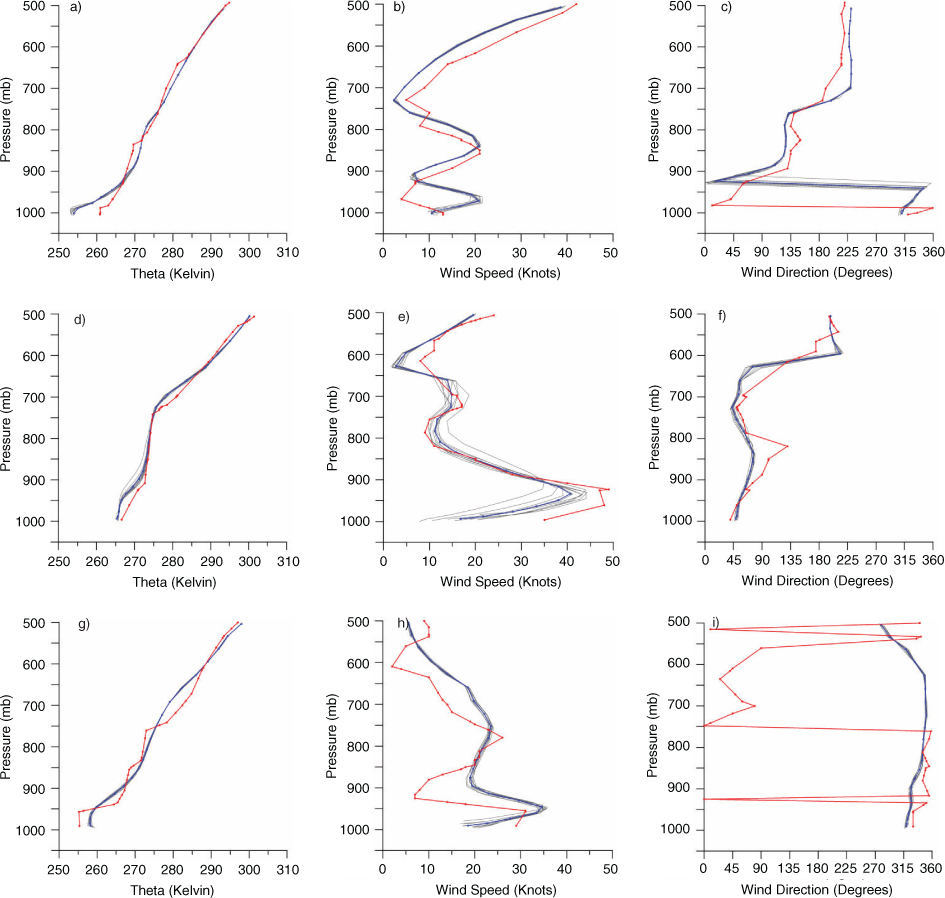
Fig. 5
Comparison of modelled versus observed vertical profiles at Iqaluit for the 17 November 2008 event. Top panel is for 00 UTC 17 November, middle panel for 12 UTC 17 November and bottom panel is for 00 UTC 18 November.
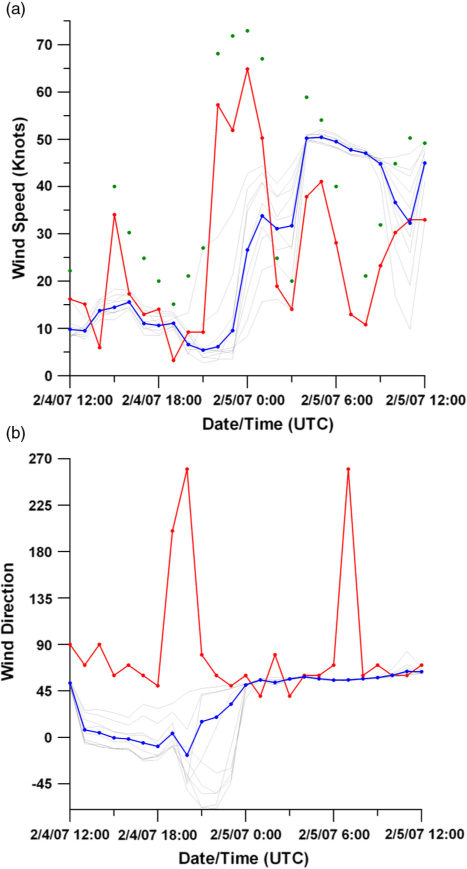
Fig. 6
Comparison of modelled and observed hourly 10-m wind speeds at Iqaluit for the 4 February 2007 event. Top panel is for wind speed and bottom panel is for wind direction. Red traces represent the observed data, blue traces the mean of the predicted data for nine GEM-LAM grid points surrounding Iqaluit airport, and grey traces the data for the individual nine data points. Green dots represent observed wind gusts. 360 has been subtracted from wind directions between 180 and 360 degrees.
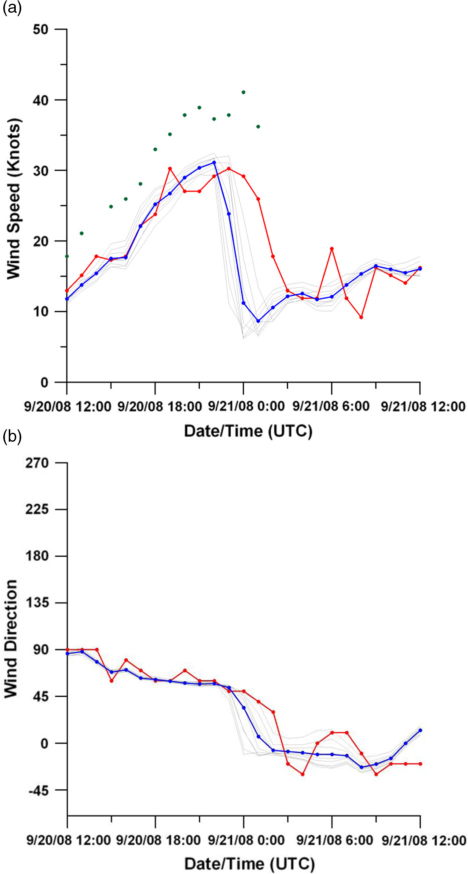
Fig. 7
Comparison of modelled and observed hourly 10-m wind speeds at Iqaluit for the 20 September 2008 event.
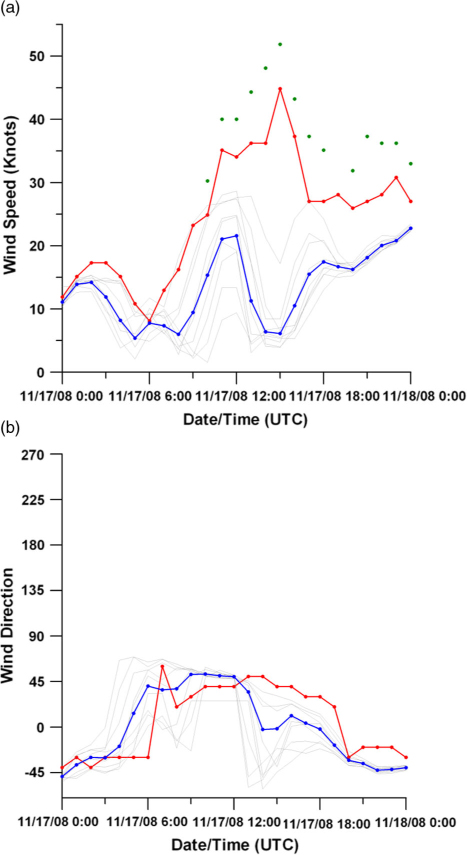
Fig. 8
Comparison of modelled and observed hourly 10-m wind speeds at Iqaluit for the 17 November 2008 event.
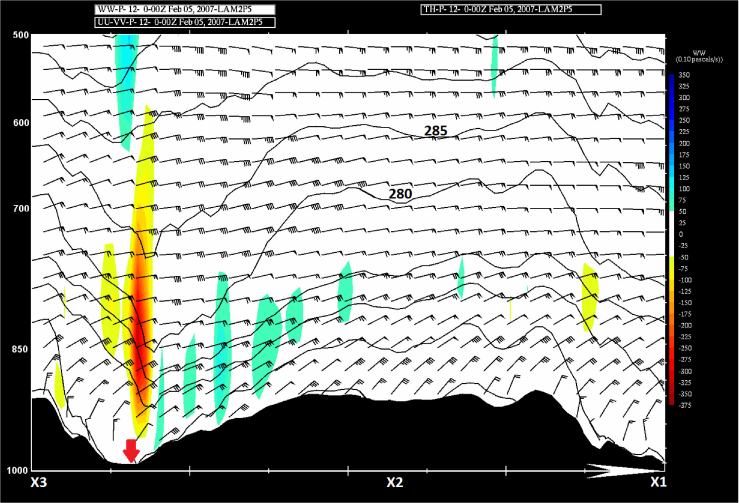
Fig. 9
Vertical cross-section between points X1 (right-hand side) and X3 (left-hand side; see Fig. 1) for 00 UTC on 5 February 2007. Potential temperature is contoured, winds barbs are in knots, and vertical velocity (Pa s−1) is shaded (warm hues ascent; cool hues descent). Red arrow indicates the approximate location of Iqaluit.
Table 2
Parameters derived from forecast profiles at points X1 and X2 around the time a hydraulic jump (or strong wave) was predicted to develop over the lee slope
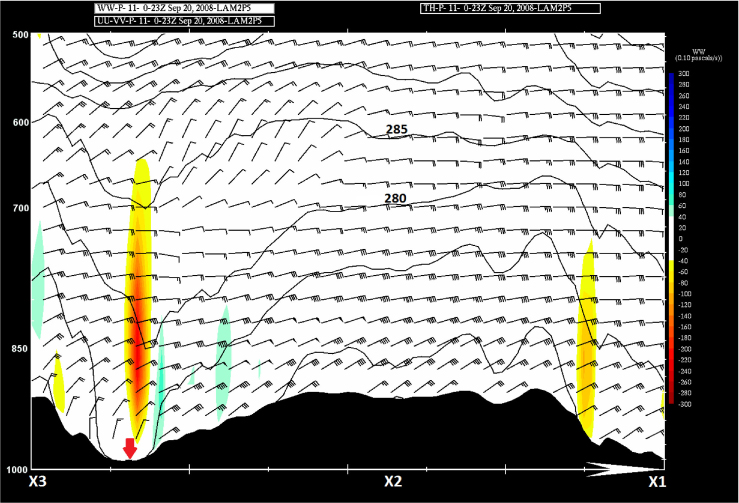
Fig. 10
Vertical cross-section between points X1 (right-hand side) and X3 (left-hand side) for 23 UTC on 20 September 2008.
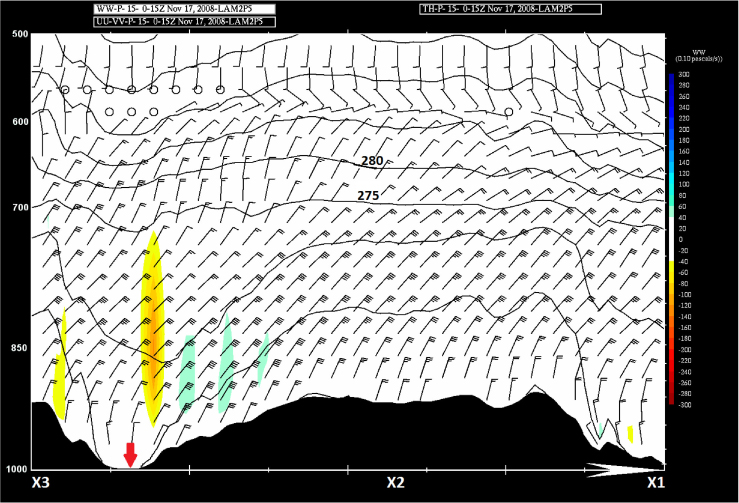
Fig. 11
Vertical cross-section between points X1 (right-hand side) and X3 (left-hand side) for 15 UTC on 17 November 2008.
Table 3
Summary of the impact of cross-barrier flow on modelled low-level winds near the time when the maximum northeasterly winds were forecast at Iqaluit and when maximum winds were predicted over the lee slope
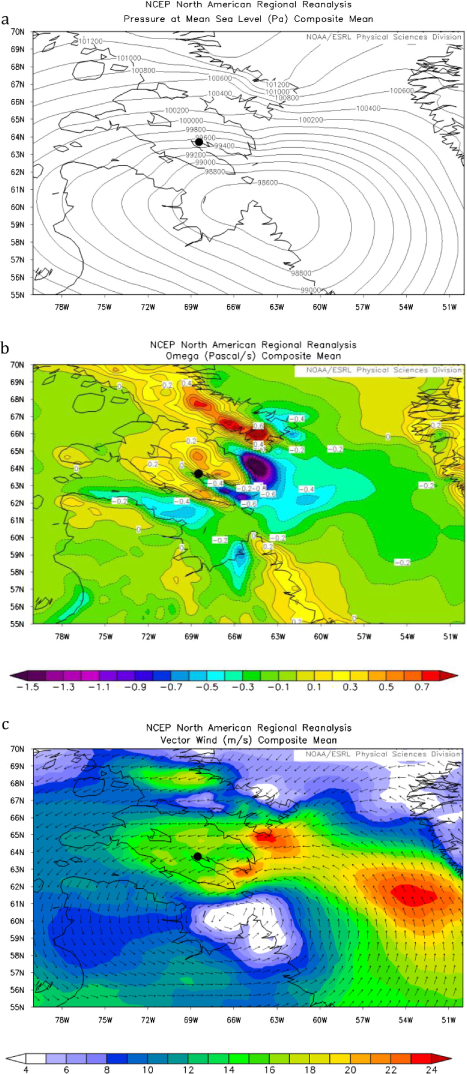
Fig. 12
NARR composite fields for 13 strong northeasterly (or easterly) wind events at Iqaluit between late 2005 and early 2012 (i.e. 1 September and 30 April) with winds of ≥ 30 kn for ≥ 3 h. (a) Top panel mean sea-level pressure (Pa), (b) middle panel 850-mb vertical velocity (Pa s−1) and (c) bottom panel 900-mb wind speed (m s−1) and direction. Iqaluit is shown by a black dot.