Fig. 1.
Location of the Poyang catchment (light grey area) and the 13 rain gauges (dark grey points) in China.
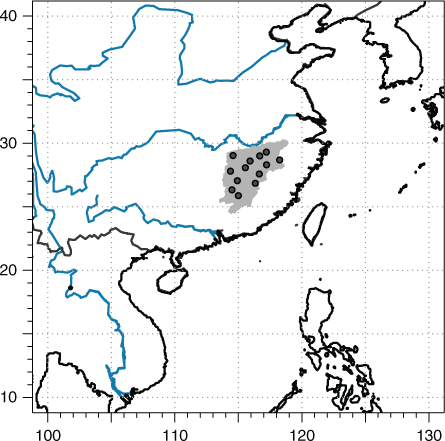
Fig. 2.
Climatological exceedance rates conditional on the different thresholds. Each box contains the expectation values E(y) for the 13 stations.
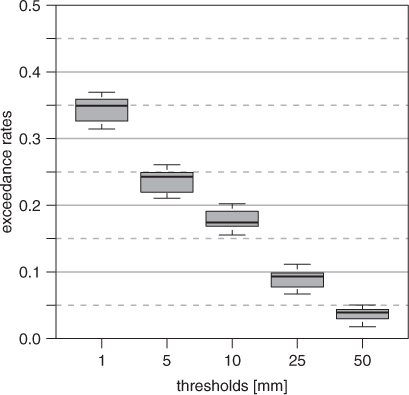
Fig. 3.
Comparison of different setups for the EOF analysis and the subsequent forward regression. Each box-whisker-plot shows the distribution of the Brier skill score over all stations in the catchment. These results are based on a threshold of u =25 mm. The letters refer to the different input sets: A – UV850, B – W500, C – TCW, D – Vo850, E – Vo850 and W500, F – Vo850 and W500 and TCW. Note: The boxes are grey shaded only for visual convenience.
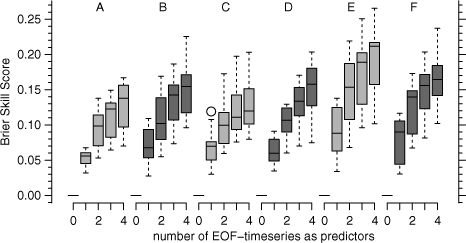
Fig. 4.
Comparison of the symmetric Brier skill score (dark grey shaded boxes) and the asymmetric Winkler skill score (light grey shaded boxes) conditioned on the different thresholds. Each box-whisker-plot shows the distribution of one skill score over all stations in the catchment. The first and the third EOF mode of the set Vo850 and W500 were used as predictors.
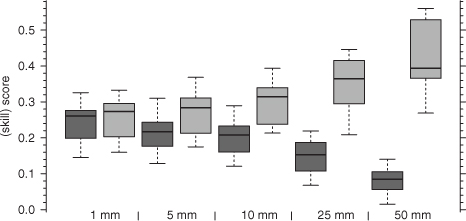
Fig. 5.
Validation of the probability of threshold exceedance model with Vo850 and W500 as input variables of the EOF analysis. The predicted was calculated from the precipitation observations at Yushan (No. 58634) with the threshold u=25 mm [cf. eq. (1)].
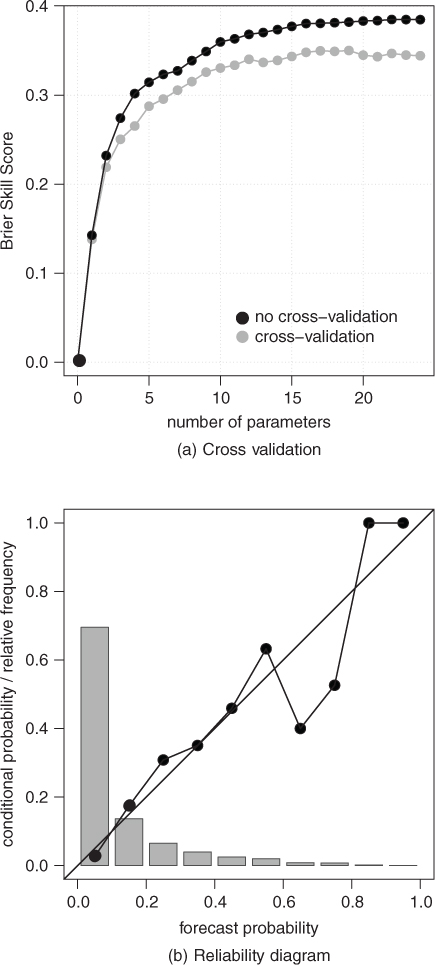
Table 1. Order of selected EOF-predictors for all 13 stations in the Poyang lake catchment. The threshold is set to u=25 mm for all stations
Fig. 6.
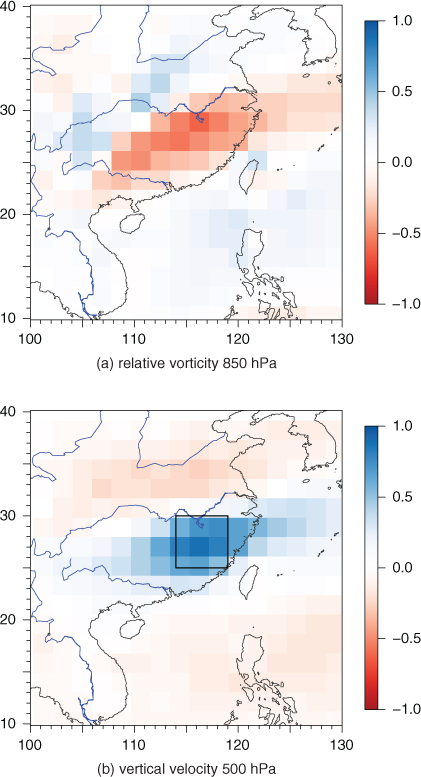
The first EOF mode of ERA-40 output variables relative vorticity at 850 hPa and vertical velocity at 500 hPa. Explained variance 8.3%.
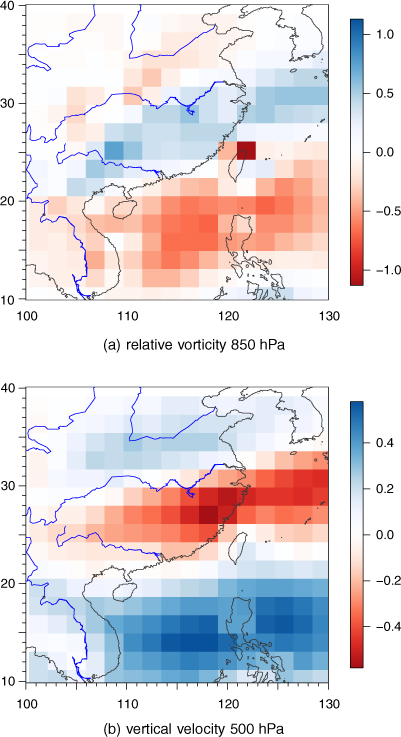
Fig. 7.
The third EOF mode of ERA-40 output variables relative vorticity at 850 hPa and vertical velocity at 500 hPa. Explained variance 4.4%.
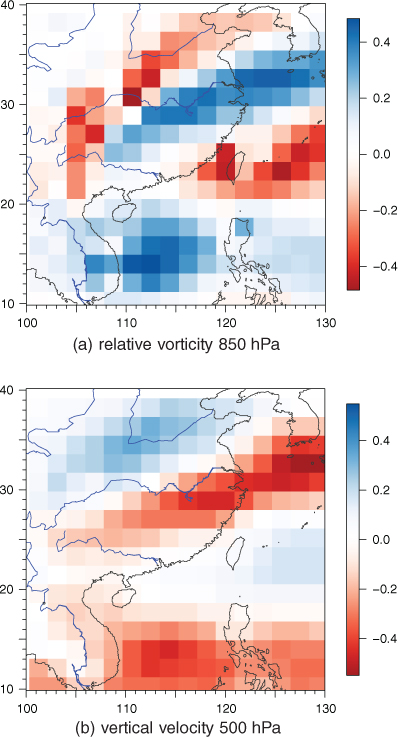
Fig. 8.
Example application of the statistical model with EOF predictors for the rain gauge at Yushan (No. 58634). The training period is from 1960 to 1989. The model is applied to 1998. Dashed lines denote climatological exceedance probabilities. Solid lines denote modelled exceedance probabilities. The intensity of the lines stands for the different thresholds, from light to dark u={1,5,10,25,50} (mm). The dots show the observed precipitation at the rain gauge.
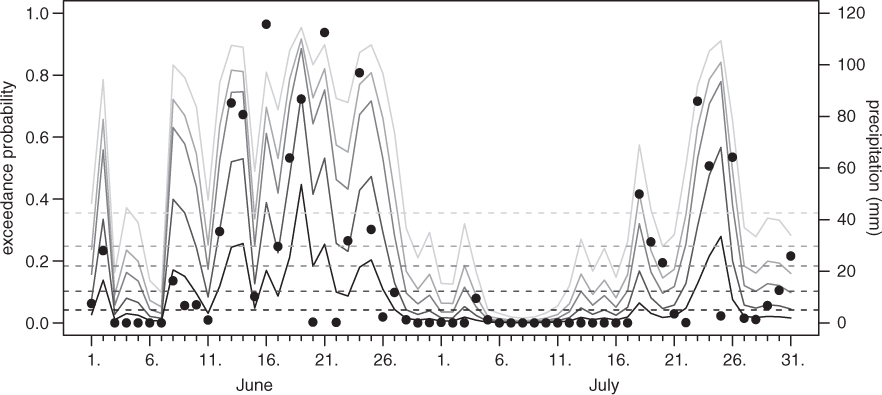
Fig. 9.
Validation of the probability of threshold exceedance model, same as in Fig. 5, but with Vo850 and W500 as input variables of the VARIMAX rotated EOF analysis. The predicted was calculated from the precipitation observations at Yushan (No. 58634) with the threshold u=25 mm [cf. eq. (1)].
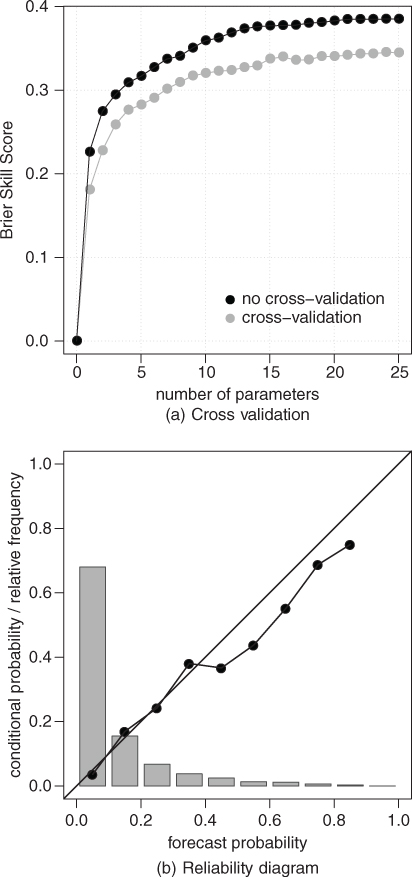
Fig. 10.
The second vEOF mode of ERA-40 output variables relative vorticity at 850 hPa and vertical velocity at 500 hPa. Explained variance 6.3%.
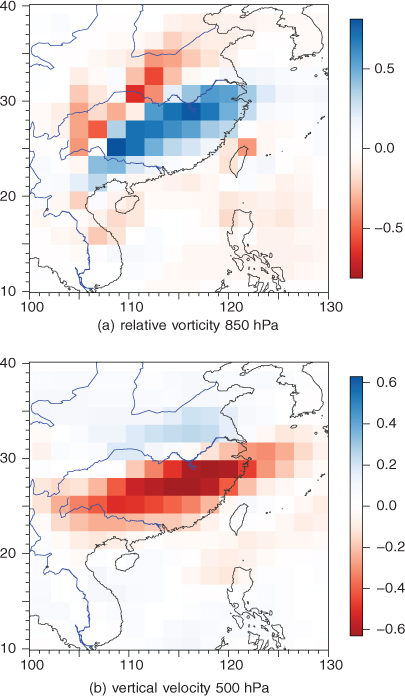
Fig. 11.
Gridpoint-wise correlation to the averaged vertical velocity over Poyang (box).