
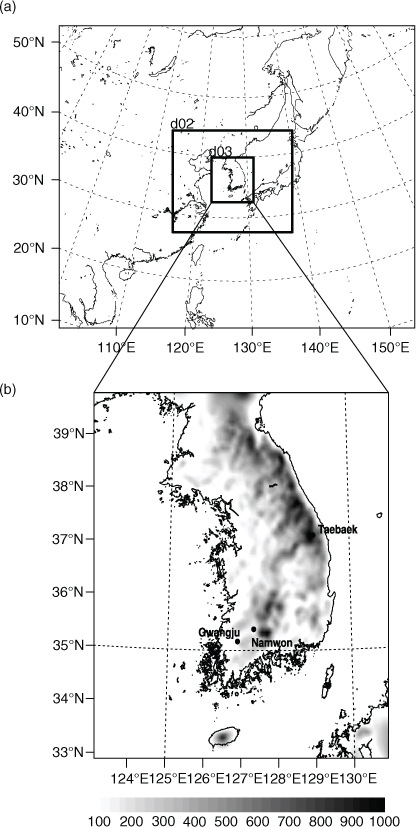
Fig. 1
Domain configuration. (a) Geographical area for domains 1, 2 and 3 and (b) model terrain height (m) for domain 3. Locations of Namwon, Taebaek and Gwangju cities are also indicated.
Table 1
Brief description for each numerical experiment
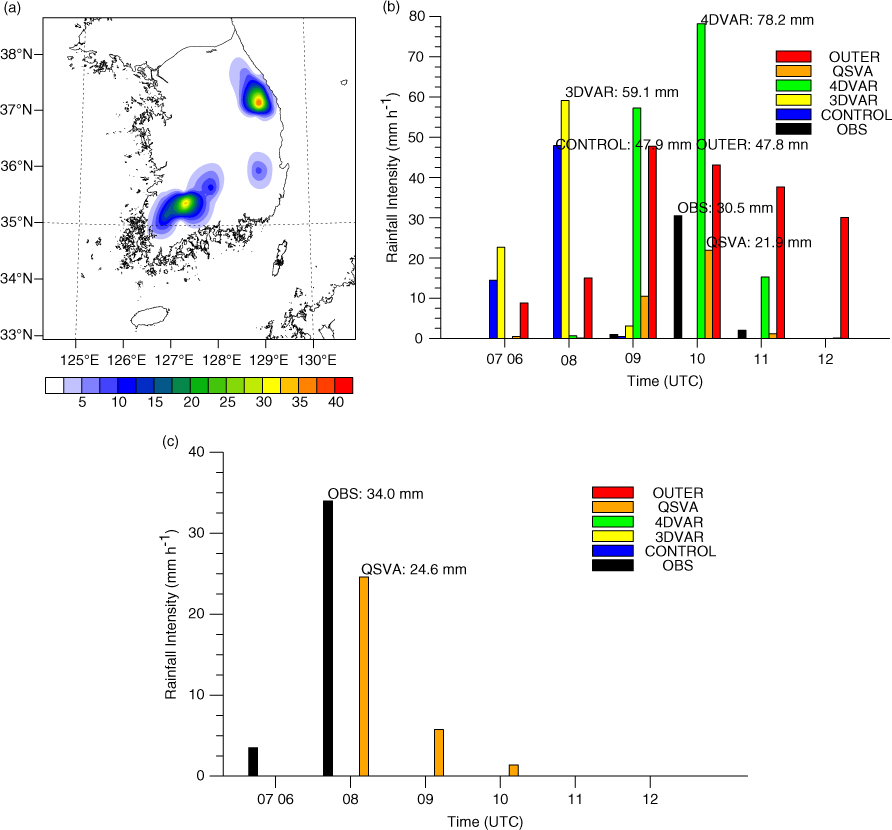
Fig. 2
(a) Observed 6 hours accumulated rainfall (mm 6 h−1) distribution over South Korea from 0600 UTC to 1200 UTC, 6 August 2006. Time series of hourly rainfall (mm h−1) from 0600 UTC to 1200 UTC, 6 August 2006 for the observations (black), CONTROL (blue), 3DVAR (yellow), 4DVAR (green), QSVA (orange) and OUTER (red) experiments at (b) Namwon and (c) Taebaek. Rainfall observations are from the Korea Meteorological Administration (KMA) surface observations. In the case of numerical experiments, hourly rainfalls at the grid points corresponding to Namwon and Taebaek are shown.
Table 2
Convective available potential energy (CAPE, J kg−1), convective inhibition (CIN, J kg−1), lifting condensation level (LCL, m) and level of free convection (LFC, m) computed from sounding observations of Gwangju at 0000 UTC and 0600 UTC, 6 August 2006
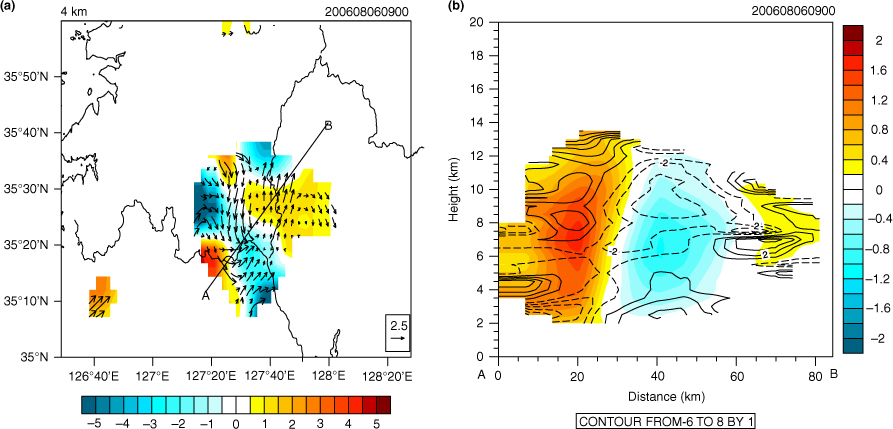
Fig. 3
Radar analyses near Namwon area at 0900 UTC, 6 August 2006. (a) Horizontal distribution of divergence (10−4 s−1, shading) and winds (m s−1, vector) at 4-km height. (b) Vertical cross section along the line shown in (a) of vertical wind (m s−1, shading) and divergence (10−4 s−1, negative values are denoted by dashed contours).
Table 3
Cost-function values at the first and last iterations and total number of iterations for the 3DVAR, 4DVAR, OUTER and QSVA experiments
Table 4
Root mean square errors (RMSEs, m s−1) of O−B (or O−FG) and O−A for zonal wind, meridional wind and radial velocity using radiosonde and radar observations over the Korean Peninsula for the 3DVAR, 4DVAR, OUTER and QSVA experiments
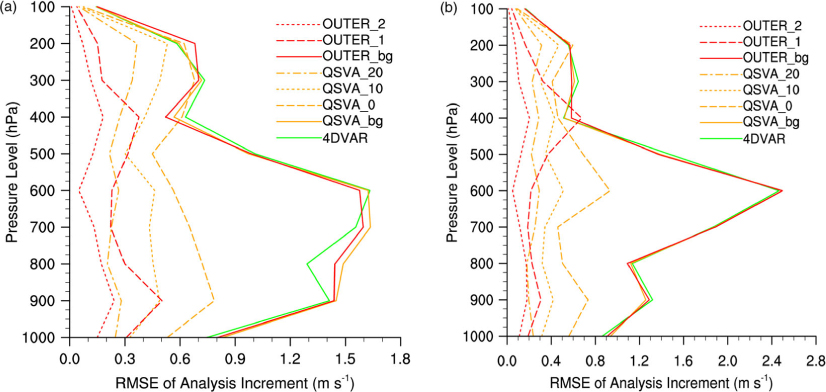
Fig. 4
Vertical distribution of RMSD of analysis increment for the 4DVAR (green), QSVA (orange) and OUTER (red) experiments. (a) Zonal wind (m s−1) and (b) meridional wind (m s−1). For the QSVA experiment, original first guess (solid) and updated first guesses from analysis of assimilation task with 0 min (dashed), 10 min (dotted) and 20 min (dash-dotted) assimilation window are used in calculating analysis increment. Similarly, for the OUTER experiment, original first guess (solid) and updated first guesses from analysis of the first (dashed) and second (dotted) outer loop are used.
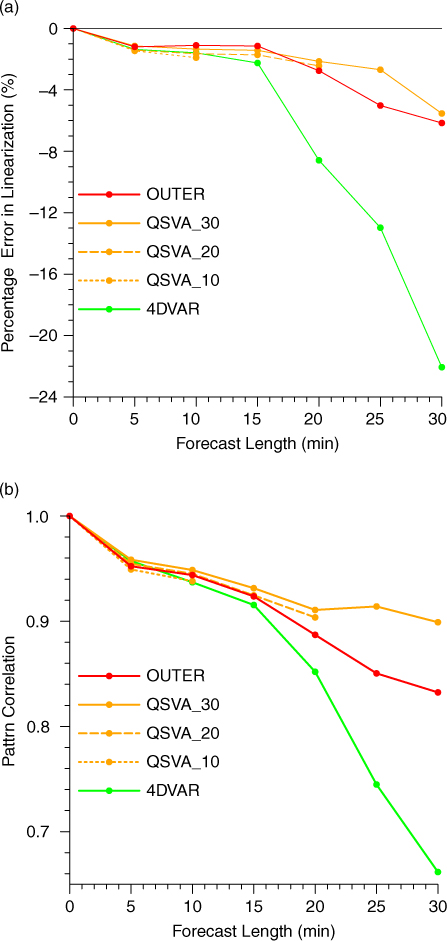
Fig. 5
(a) Percentage error in linearisation (%) and (b) pattern correlation as a function of forecast length for the 4DVAR (green solid line), QSVA_10 (orange dotted line), QSVA_20 (orange dashed line), QSVA_30 (orange solid line) and OUTER (red solid line) experiments.
Table 5
Computing time (hours) and total number of iterations in minimisations of the 4DVAR, OUTER, QSVA and QSVA_LC experiments
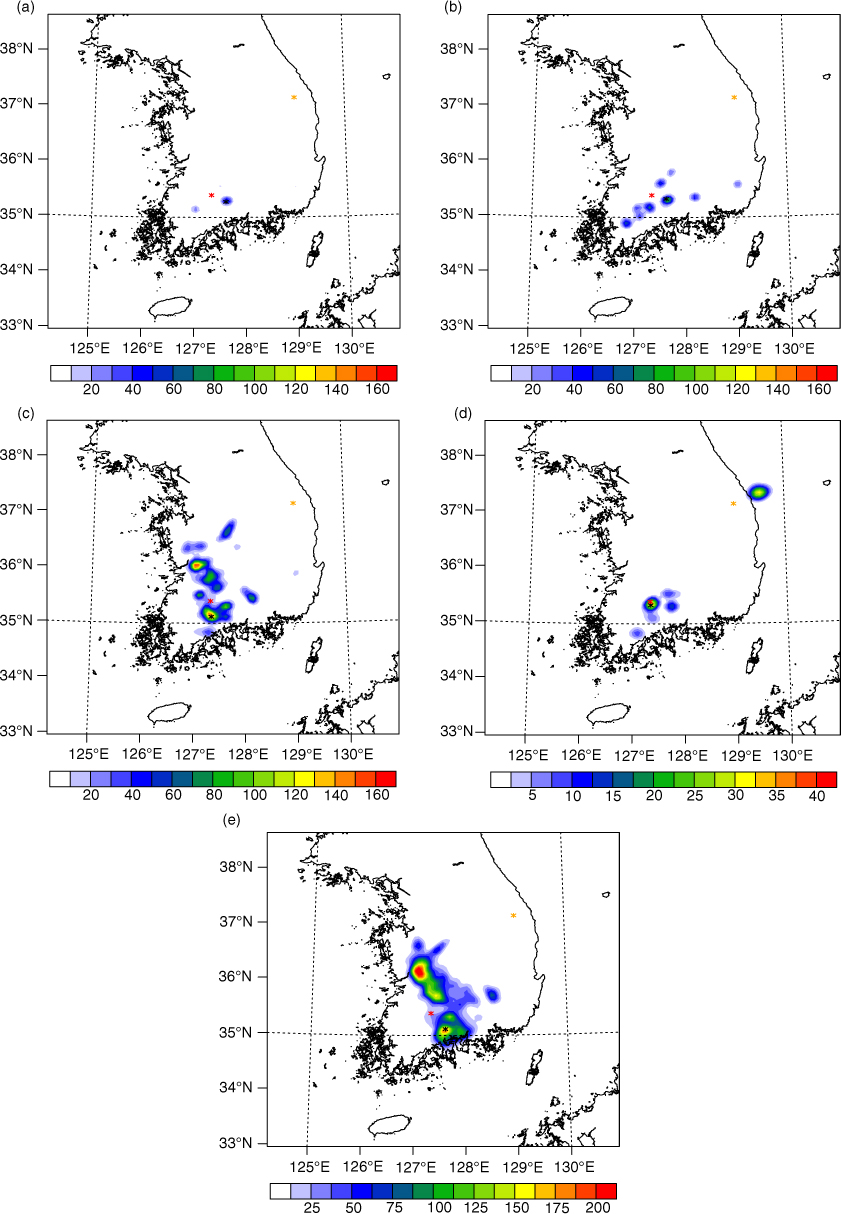
Fig. 6
Six hours accumulated rainfall (mm 6 h−1) distribution over South Korea from 0600 UTC to 1200 UTC, 6 August 2006 for the (a) CONTROL, (b) 3DVAR, (c) 4DVAR, (d) QSVA and (e) OUTER experiments. Note that different colour scales are used for the QSVA and OUTER experiments.
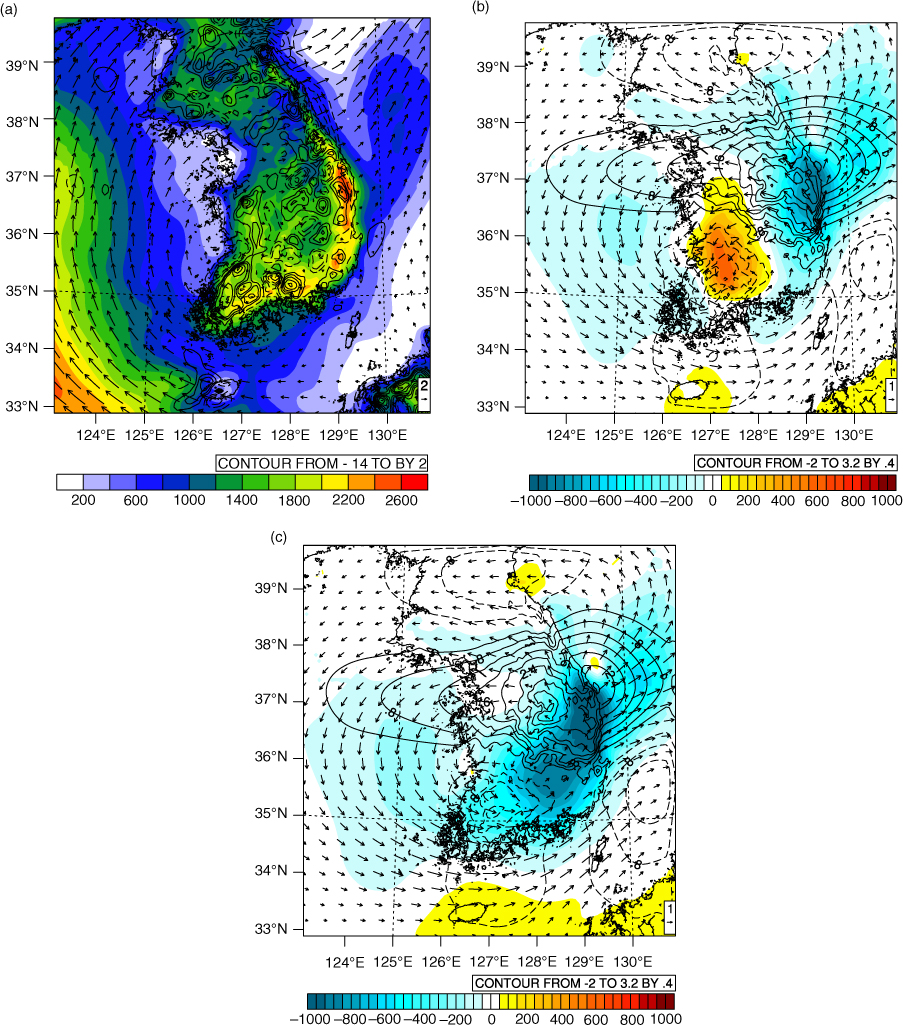
Fig. 7
(a) Convective available potential energy (CAPE, J kg−1, shading), divergence (10−5 s−1, negative values are denoted by dashed contours) and winds (m s−1, vector) of 850 hPa at 0600 UTC, 6 August 2006 for the CONTROL experiment. Analysis increments of CAPE (J kg−1, shading), divergence (10−5 s−1, negative values are denoted by dashed contours) and winds (m s−1, vector) at 850 hPa for the (b) 4DVAR and (c) QSVA experiments.