
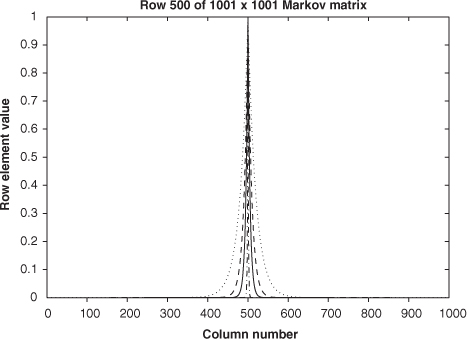
Fig. 1
Middle row of a 1001×1001 Markov matrix, (9). Dash–dot line L R =0.01m, full line L R =0.05m, dashed line L R =0.1m and dotted line L R =0.2 m.
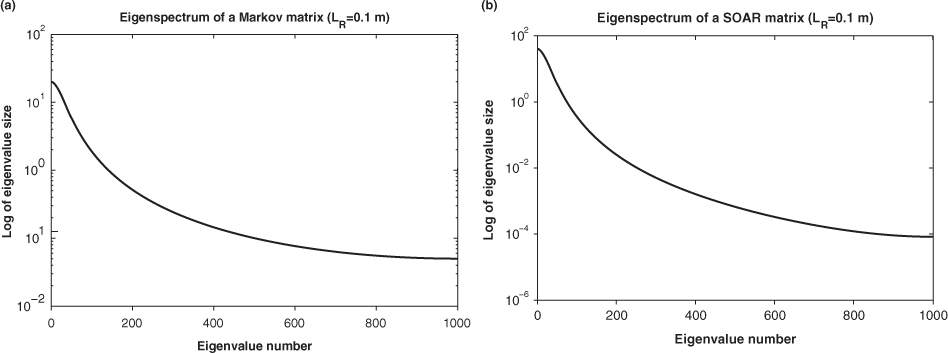
Fig. 2
(a) Eigenspectrum of a 1001×1001 Markov error correlation matrix; (b) Eigenspectrum of a 1001×1001 SOAR error correlation matrix.
Table 1. Analysis errors in u field at t=0 for different approximations to a Markov error covariance matrix ()
Table 2. Analysis errors in φ field at t=0 for different approximations to a Markov error covariance matrix ()
Table 3. Analysis errors in u field at t=0 for different approximations to a SOAR error covariance matrix ()
Table 4. Analysis errors in φ field at t=0 for different approximations to a SOAR error covariance matrix ()
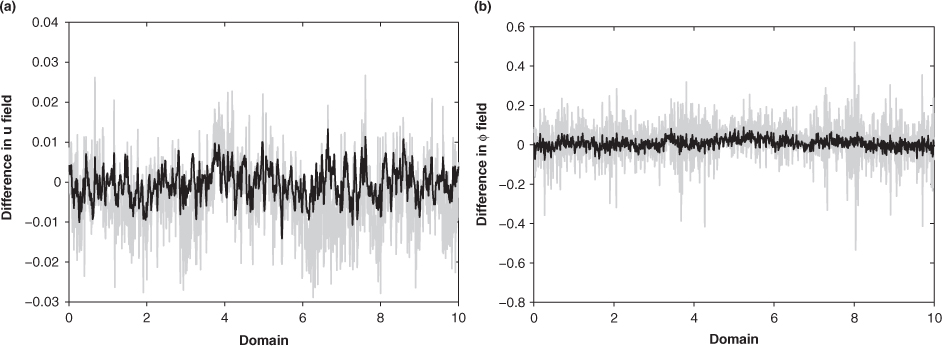
Fig. 3
Analysis errors in (a) u field and (b) φ field at the start of the time window. The grey line is for a diagonal approximation and the black line is for a Markov approximation with L R =0.2m.
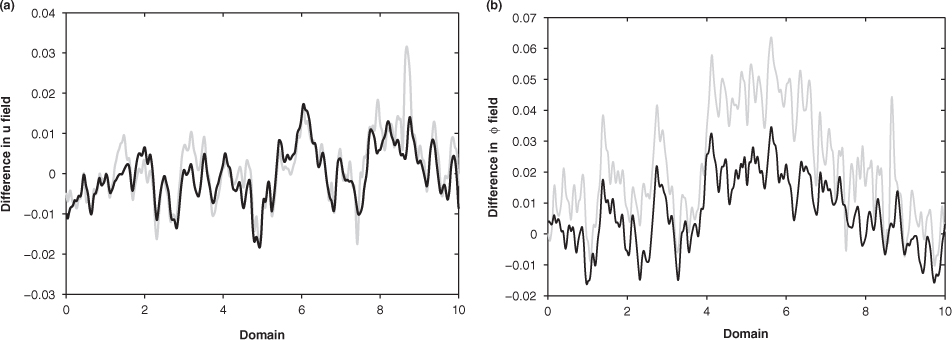
Fig. 4
Analysis errors in (a) u field and (b) φ field at the centre of the time window, t=50. The grey line is for a diagonal approximation and the black line is for a Markov approximation with L R =0.2m. Note that the scale in panel (b) is different from Fig. 3b.
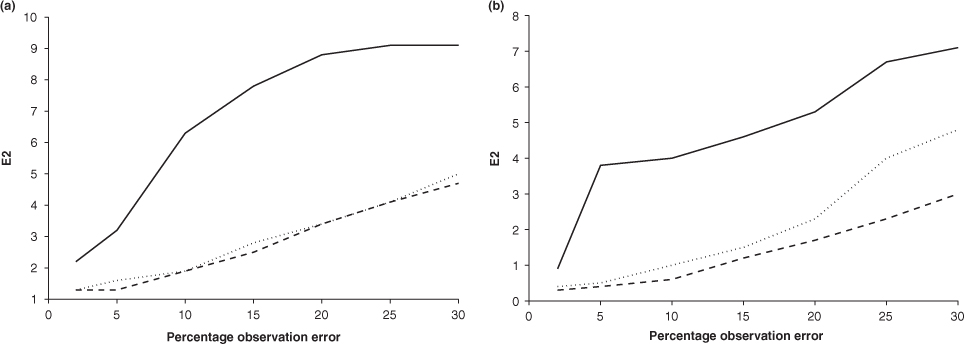
Fig. 5
Plot of E2 against level of observation noise for (a) u field, (b) φ field. The solid line is for the diagonal approximation, the dashed line for the ED approximation with K=50 and the dotted line for the Markov approximation with L R =0.05m.
Table 5. Analysis errors in u field at t=0 for different approximations to a Markov observation error covariance matrix, with correlated background errors
Table 6. Analysis errors in φ field at t=0 for different approximations to a Markov observation error covariance matrix, with correlated background errors