
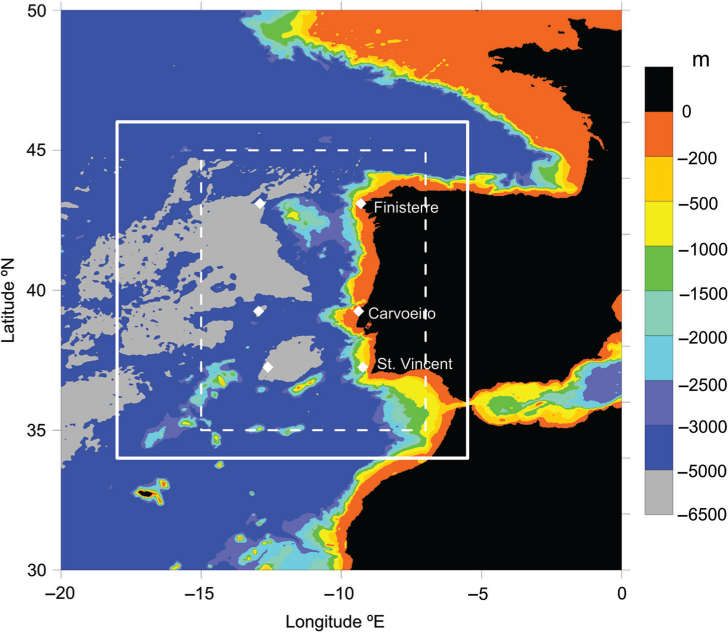
Fig. 1
Bathymetry and limits of the computational domain applied in the ROMS ERA-Interim (white solid rectangle) and ERA-40 (white dashed rectangle) simulations. The location of the three main capes and corresponding offshore points are also shown.
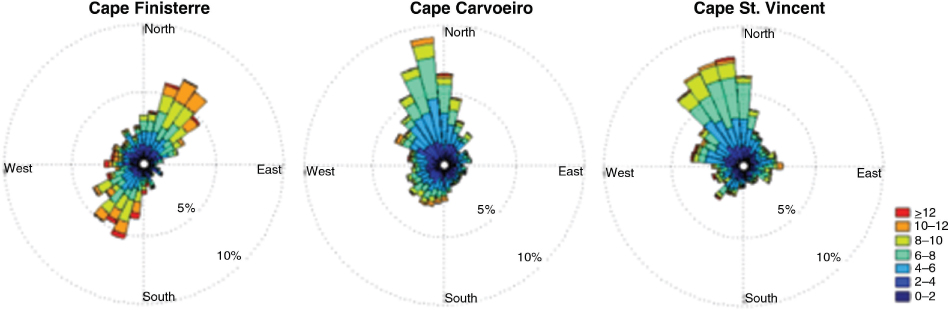
Fig. 2
Summer (JJA) wind roses for the period 1989–2008 (ERA-Interim) at (from North to South): Cape Finisterre, Cape Carvoeiro and Cape St. Vincent. It was considered the closest point to each cape over the ocean.
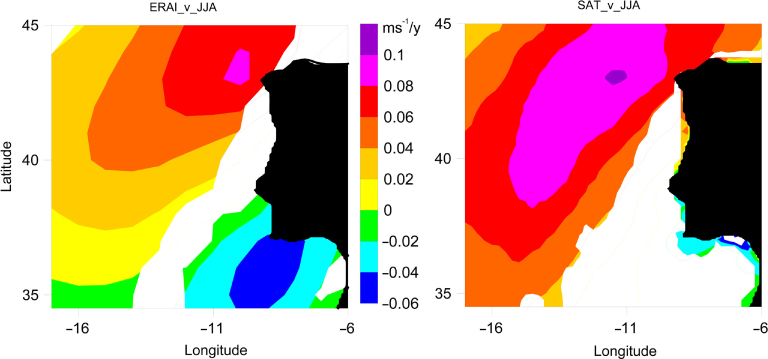
Fig. 3
Trends of the southerly wind in summer (JJA) from (a) ERA-Interim for the period 1989–2008 and (b) satellite scatterometer data for the period 1988–2007. Colour fill is applied only for those that are statistically significant at the 95% level.
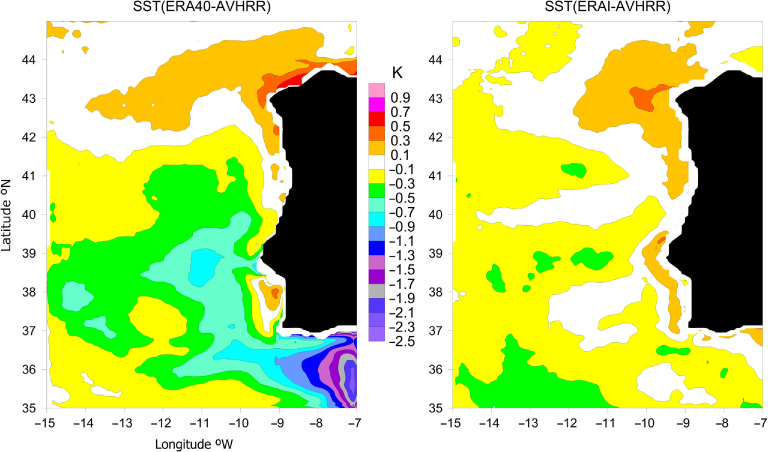
Fig. 4
Difference between simulated and observed mean daily SST in the common period of the two simulations (1989–2001): (left) ROMS with ERA-40, (right) ROMS with ERA-Interim.
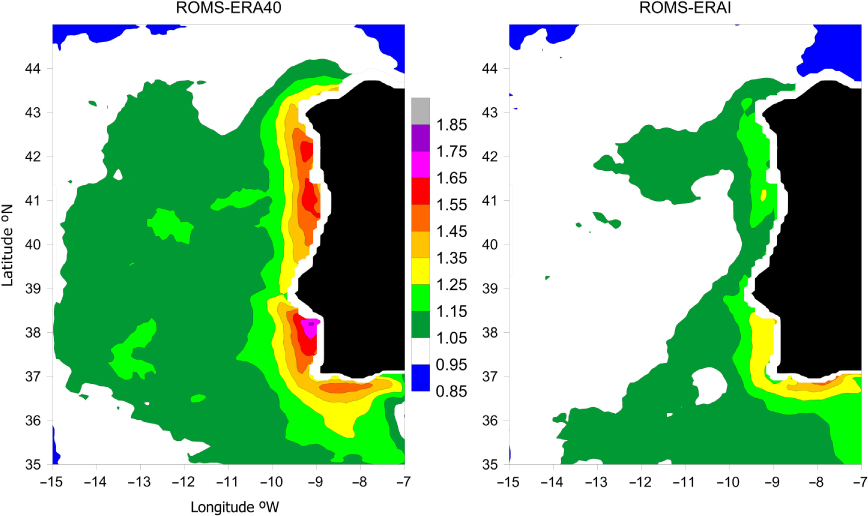
Fig. 5
Intra-annual variability of the SST field in the 1989–2001 period: (a-left) ratio between the intra-annual standard deviation of the SST field in the ROMS +ERA-40 simulation and the intra-annual standard deviation of the AVHRR SST field; (b-right) the same for the ROMS+ERA-Interim simulation.
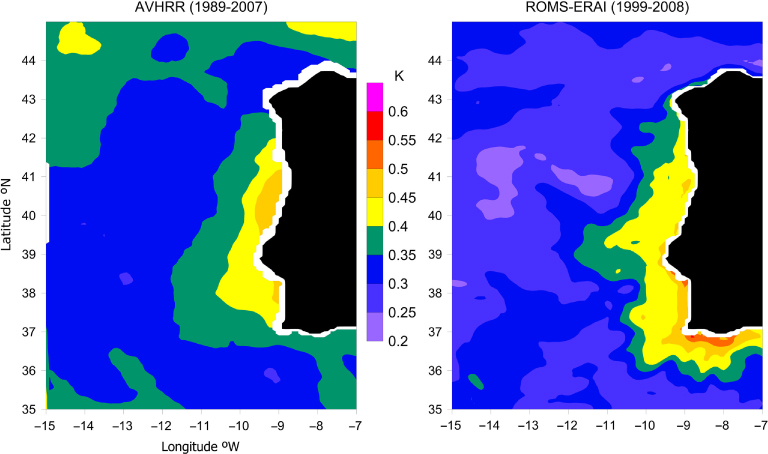
Fig. 6
Inter-annual standard deviation of the SST field in (left) the AVHRR satellite data 1989–2007, and (right) the ROMS+ERA-Interim simulation 1989–2008.
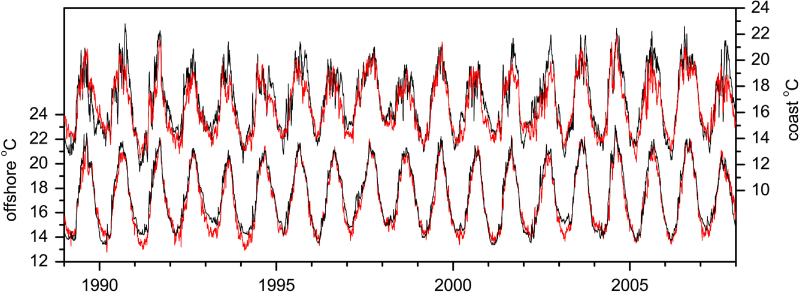
Fig. 7
Evolution of SST near Cape Carvoeiro (coast, top lines) and at an offshore location 300 m to the west: ROMS results (black lines) and AVHRR data (red lines).
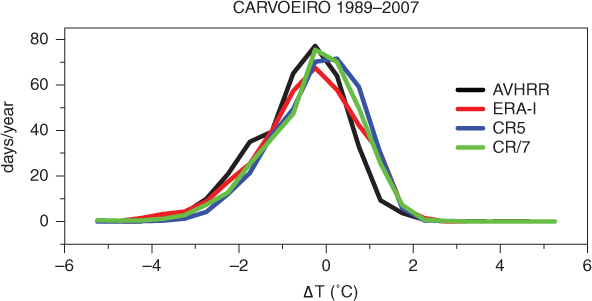
Fig. 8
Histograms of the daily SST anomaly near Cape Carvoeiro (SST nearshore – SST 300 km offhore): ROMS results (red) and AVHRR data (black). Curve CR7 corresponds to a ROMS simulation where the coastal atmospheric data were pre-processed following Kara et al. (2007), CR5 uses the same methodology but only for the thermodynamic variables.
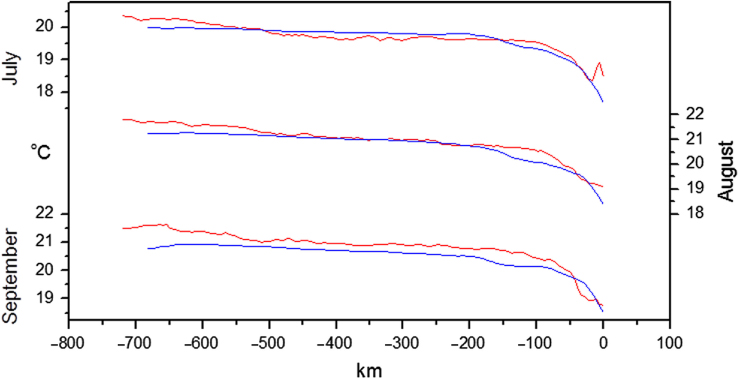
Fig. 9
Zonal distribution of the daily mean SST along the Cape Carvoeiro parallel, obtained from the ROMS simulation with ERA-Interim forcing (blue) and from AVHRR Optimum Interpolated satellite data (red).
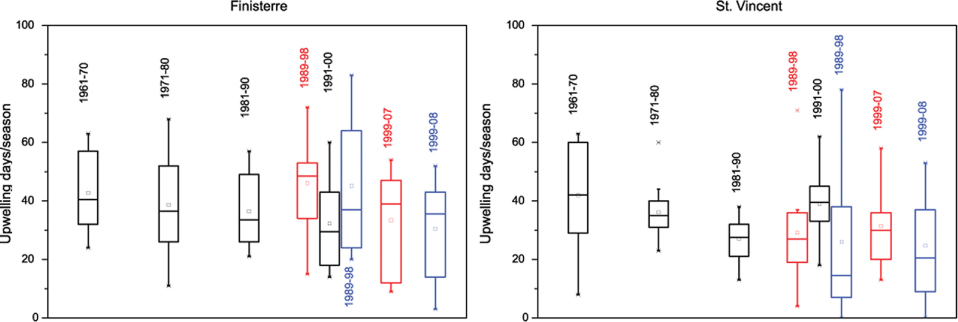
Fig. 10
Intra-decadal distribution of the mean number of upwelling days during the late summer months (JAS) near Finisterre and St. Vincent, as given by ROMS+ERA-40 (black boxes), ROMS+ERA-Interim (blue) and AVHRR (red). Upwelling days are defined as days with a near-coast SST 2°C colder than 300-km offshore. Boxes show 25, 50 and 75 percentiles; the mean value is represented by the small square.
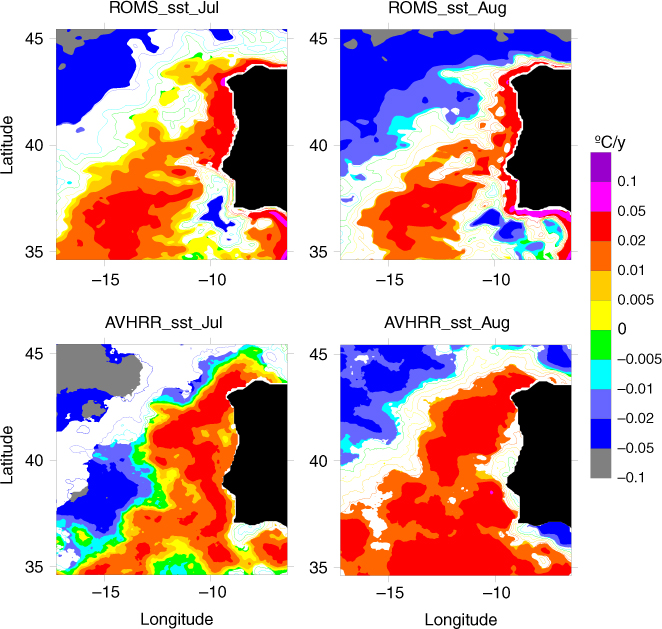
Fig. 11
Monthly SST trends in the period 1989–2007 computed from: (top row) ROMS+ERA-Interim simulation, (bottom row) AVHRR data. Colour fill is only applied in regions where trends are significant at the 95% level.