
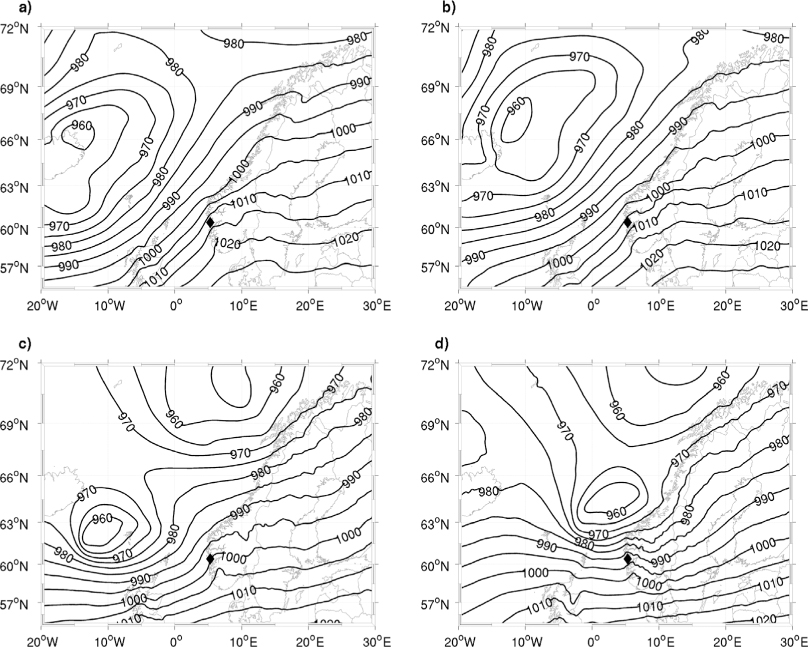
Fig. 1
Mean sea-level pressure at 1200 and 1800 UTC on 10 January 2009 (a, b) and 25 December 2011 (c, d) based on the analysis from the European Centre for Medium-Range Weather Forecasts (ECMWF). The location of Bergen is indicated with a black diamond.
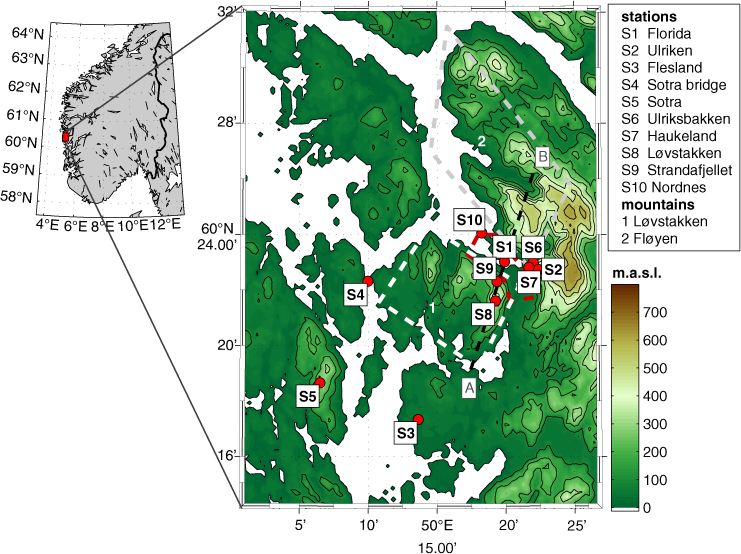
Fig. 2
The topography of the area of main interest, the locations and names of the AWSs (S1–S10), and indications of the geographical extent of the two dominating mountain massifs in the area: Løvstakken (1) and Fløyen (2). The dashed, red line indicates the approximate extent of the centre of Bergen. The dashed, black line between the points ‘A’ and ‘B’ indicates the position of the cross section in Fig. 14.
Table 1. Automatic weather stations
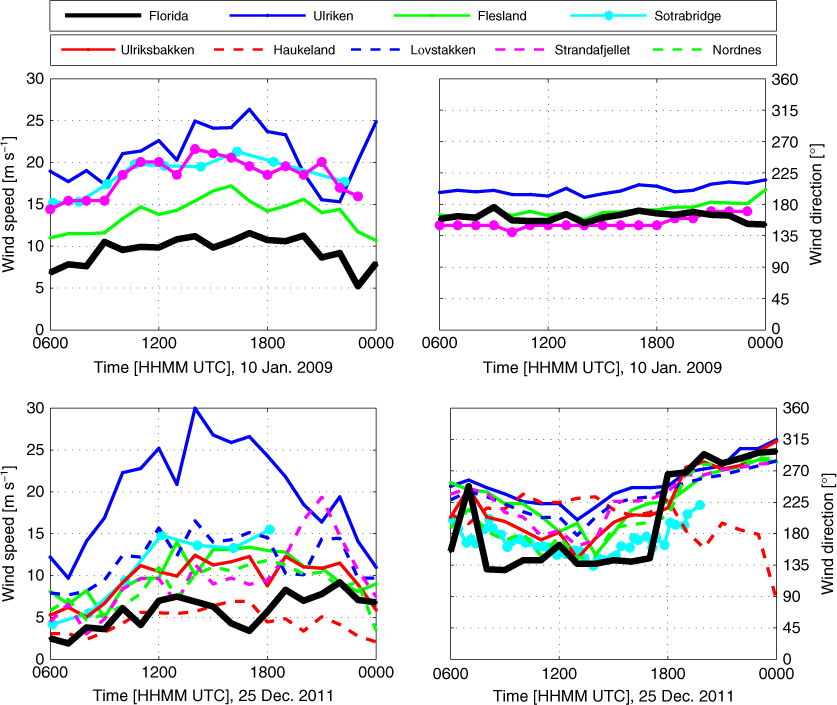
Fig. 3
Observed wind speed and wind direction during the investigated windstorms on 10 January 2009 and on 25 December 2011 in the Bergen area.
Table 2. Table used in this study to convert GlobCorine land-use categories to USGS land-use categories
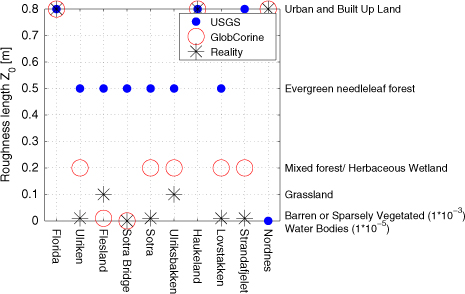
Fig. 4
Roughness length for momentum at the different AWSs for the simulations using the USGS and GlobCorine land-use data sets. The real roughness length is indicated as well.
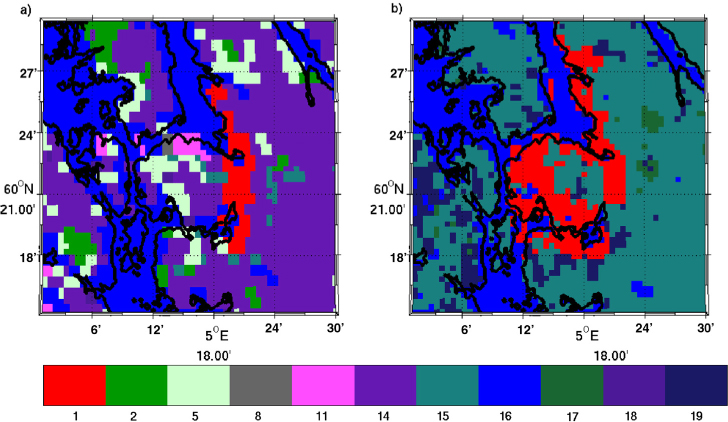
Fig. 5
A zoom-in of the land-use of domain 3 (500-m horizontal resolution) using the data sets of (a) USGS and (b) GlobCorine. See Table 2 for a list over land-use categories and respective numbers indicated on the colour bar. The coastline from Global Self-consistent, Hierarchical, High-resolution Shoreline Database (GSHHS) is indicated with a solid, black line.
Table 3. Weather Research and Forecasting model sensitivity experiments with different land-use and topography data sets
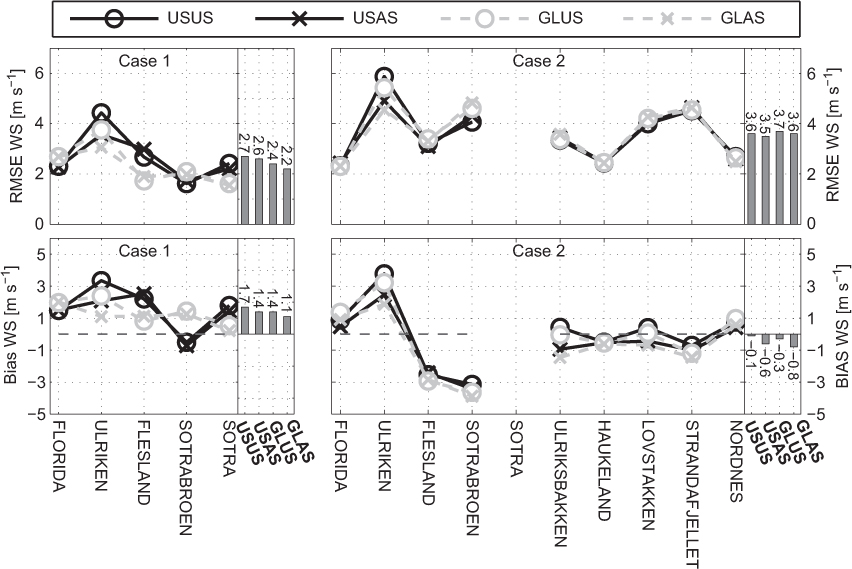
Fig. 6
Root mean-squared error (RMSE) and mean error (bias) for wind speed (observed minus simulated) using four different combinations of model land-use and topography data sets. Table 3 lists and explains the different experiments. Case 1 is 10 January 2009 and Case 2 is 25 December 2011.
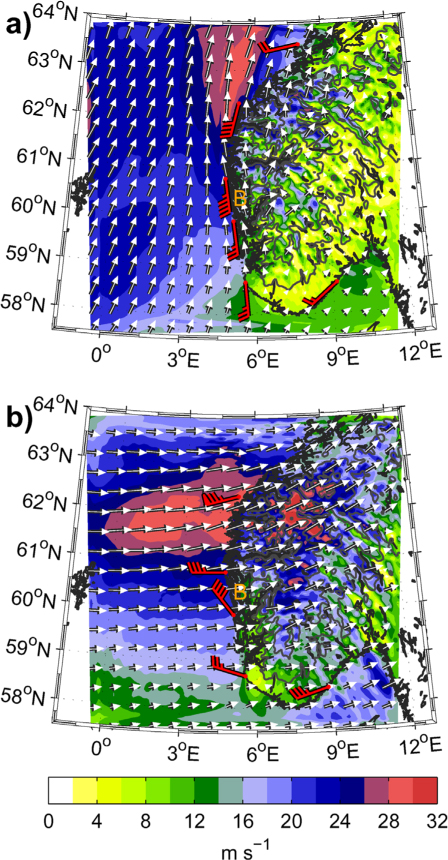
Fig. 7
Simulated near-surface (19.5 m.a.g.l.) horizontal wind speed at (a) 1200 UTC on 11 January 2009 and at (b) 2100 UTC on 25 December 2011. The results are from the outermost domain (4.5-km horizontal resolution). Observations from selected AWSs along the coast are indicated with red wind barbs. Each barb is 2.5 m s–1. The location of Bergen is indicated with a ‘B’.
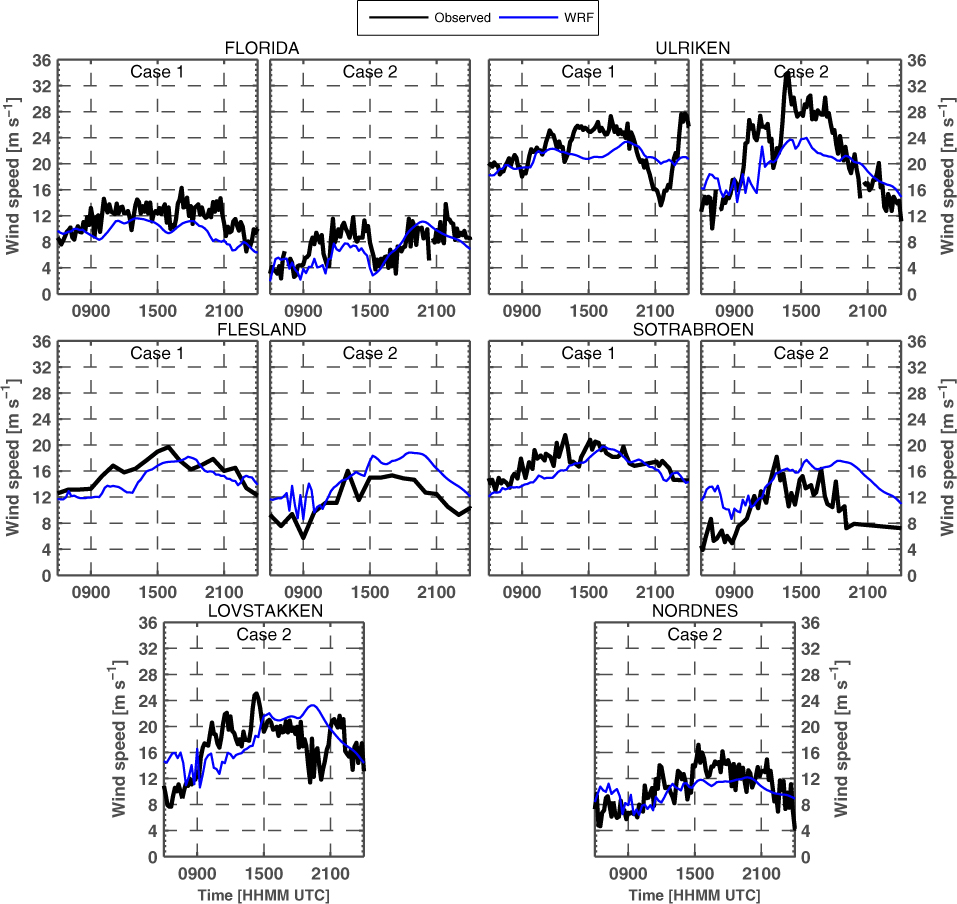
Fig. 8
Observed and simulated wind speed at selected AWSs on 10 January 2009 (Case 1) and 25 December 2011 (Case 2). The simulation results are from the innermost domain (500-m horizontal resolution).
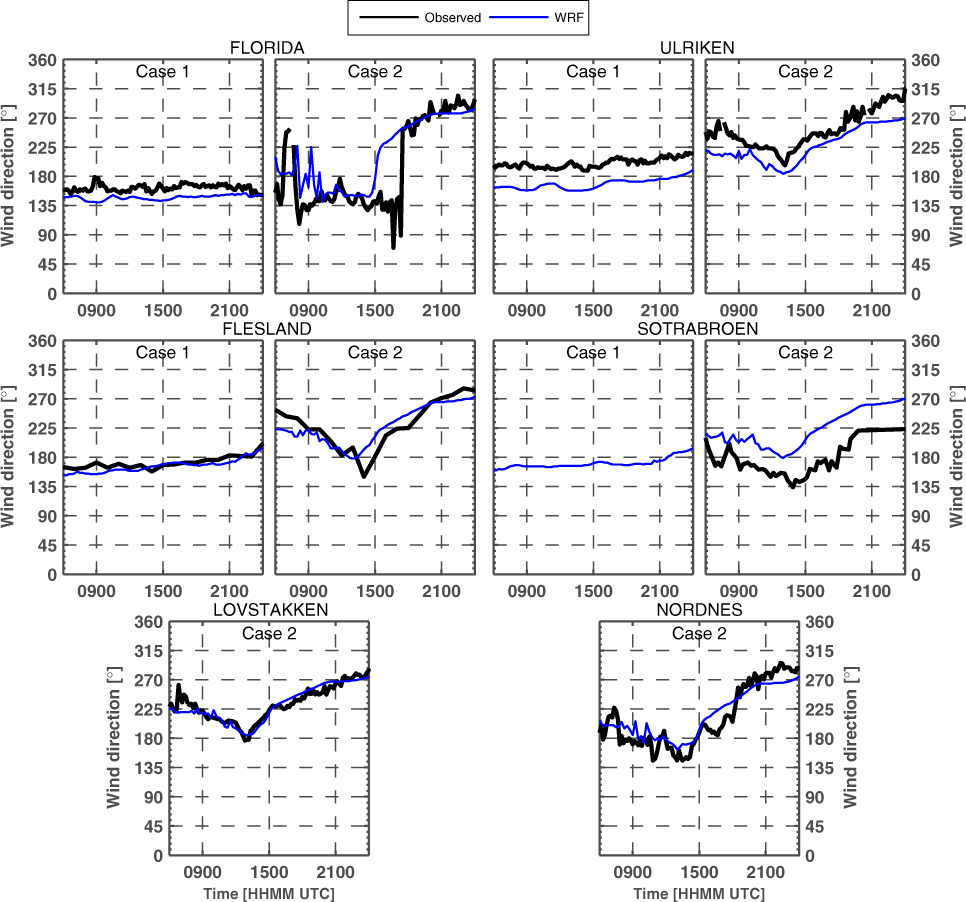
Fig. 9
Observed and simulated wind direction at selected AWSs on 10 January 2009 (Case 1) and 25 December 2011 (Case 2). The simulation results are from the innermost domain (500-m horizontal resolution).
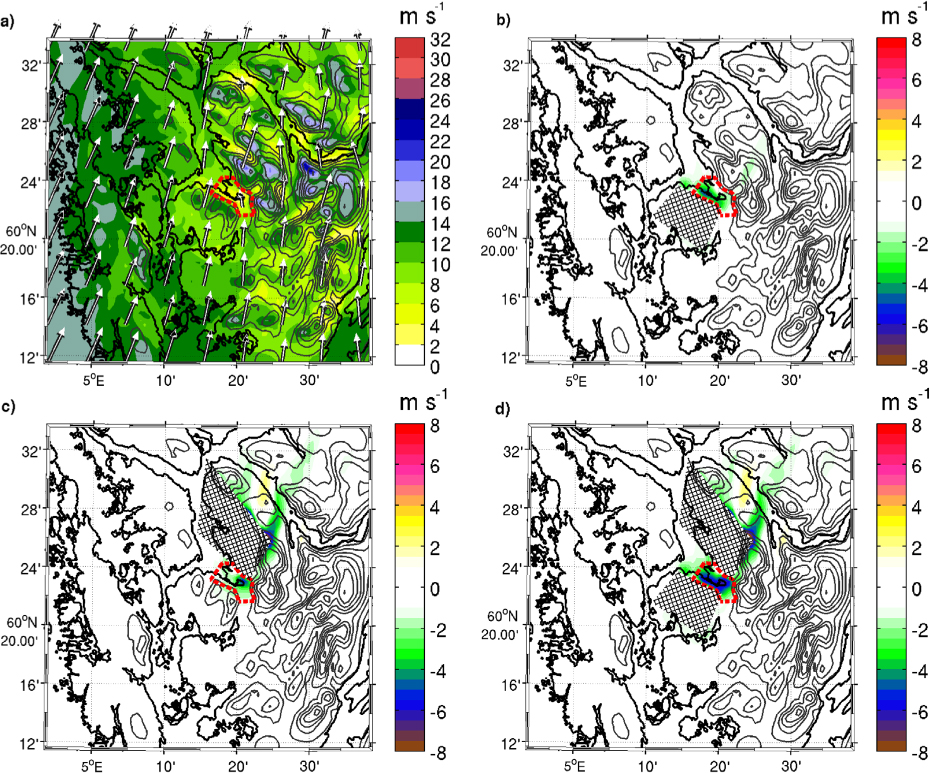
Fig. 10
(a) Near-surface wind speed at 0000 UTC on 11 January in the CTRL simulation, (b) wind speed in CTRL minus NOL, (c) wind speed in CTRL minus NOF and (d) wind speed in CTRL minus NOFL. The dashed, red line indicates the approximate extent of the centre of Bergen.
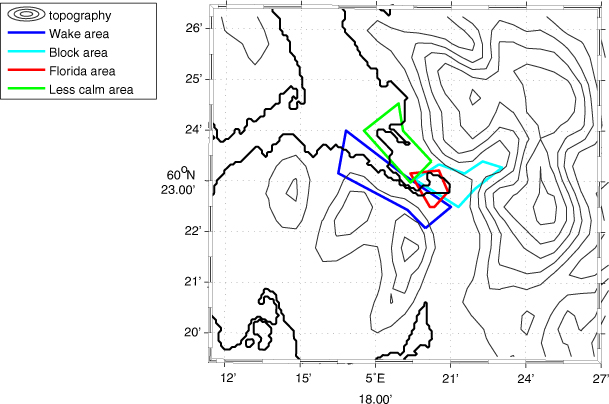
Fig. 11
Areas of characteristic location and flow patterns. The terrain height is given with contours every 100 m.
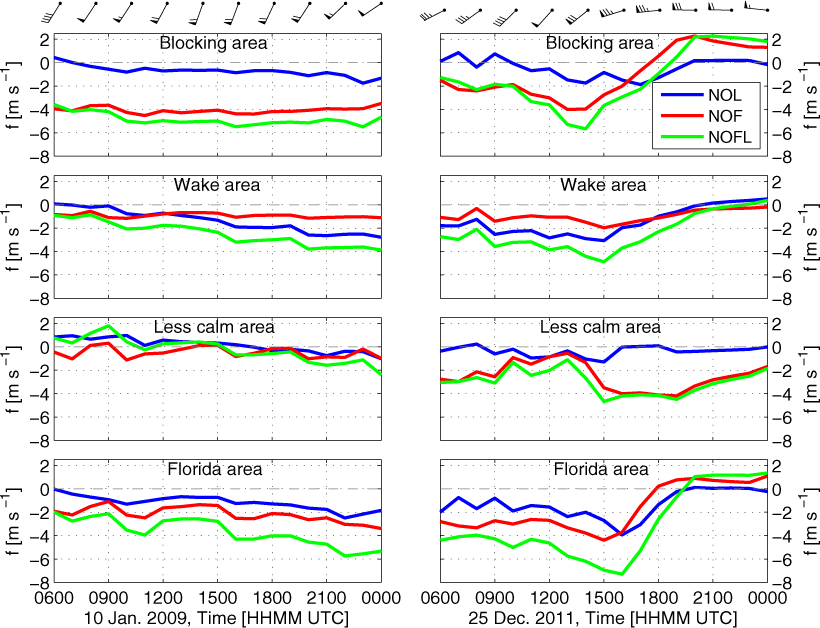
Fig. 12
Difference in simulated near-surface wind speed between the CTRL and the sensitivity simulations with topography modifications averaged within the areas indicated in Fig. 11. The wind barbs at the top of the panels denote the simulated wind speed and direction at 900 hPa averaged within a box centred at 4.3°E and 61°N. Each half barb is 2.5 m s–1.
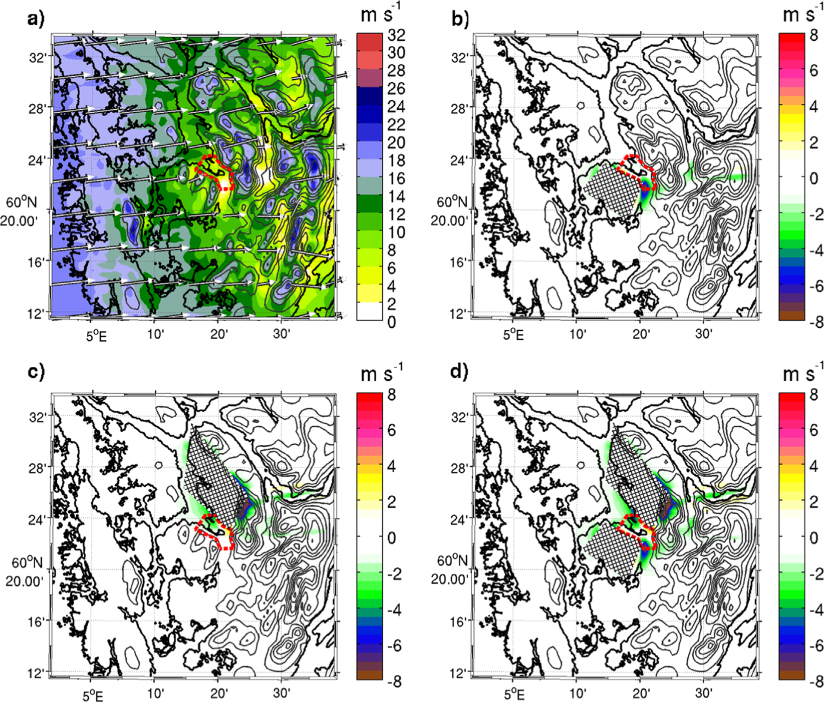
Fig. 13
(a) Near-surface wind speed at 2100 UTC on 25 December 2011 in the CTRL simulation, (b) wind speed in CTRL minus NOL, (c) wind speed in CTRL minus NOF and (d) wind speed in CTRL minus NOFL. The dashed, red line indicates the approximate extent of the centre of Bergen.
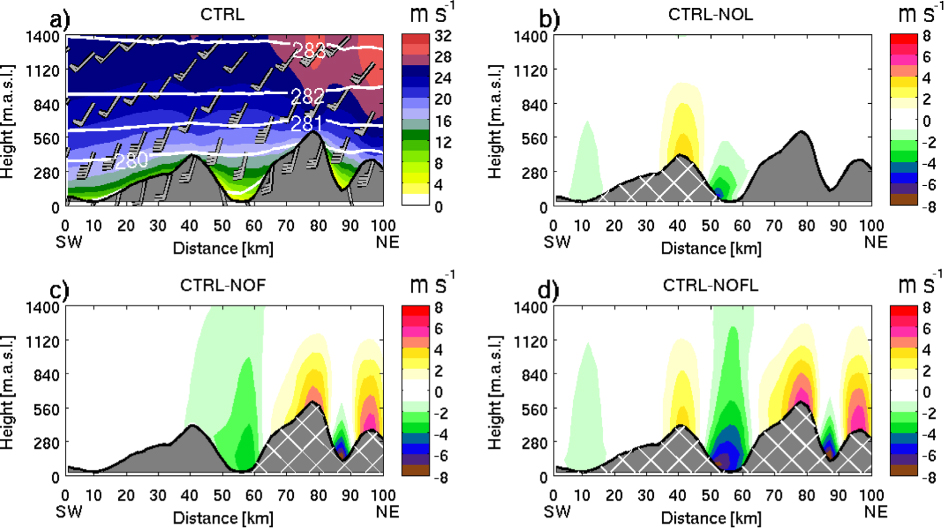
Fig. 14
(a) Cross section of horizontal wind speed at 0000 UTC on 11 January in the CTRL simulation, (b) wind speed in CTRL minus NOL, (c) wind speed in CTRL minus NOF and (d) wind speed in CTRL minus NOFL. The geographical location of the cross section is indicated in Fig. 2.
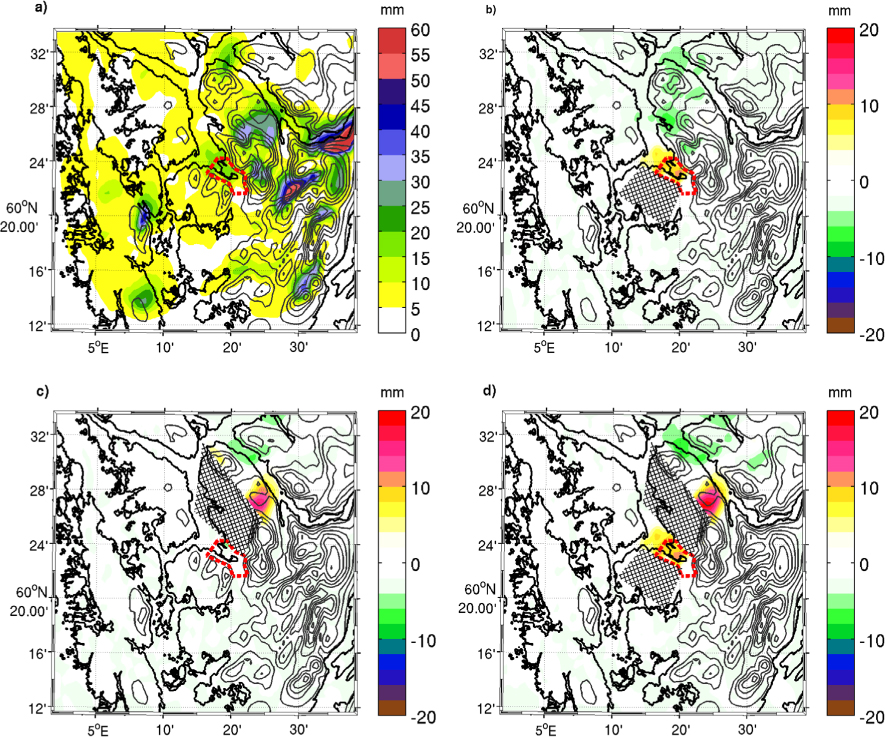
Fig. 15
(a) 18-hour accumulated precipitation at 0000 UTC on 11 January 2009, in the CTRL simulation, (b) precipitation in CTRL minus NOL, (c) precipitation in CTRL minus NOF and (d) precipitation in CTRL minus NOFL.