
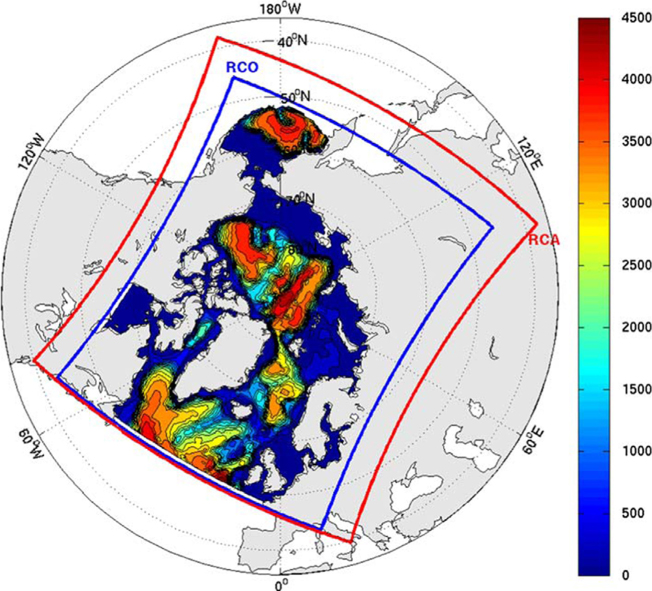
Fig. 1
RCAO arctic domain and bathymetry (m).
Table 1
Details of RCAO projections
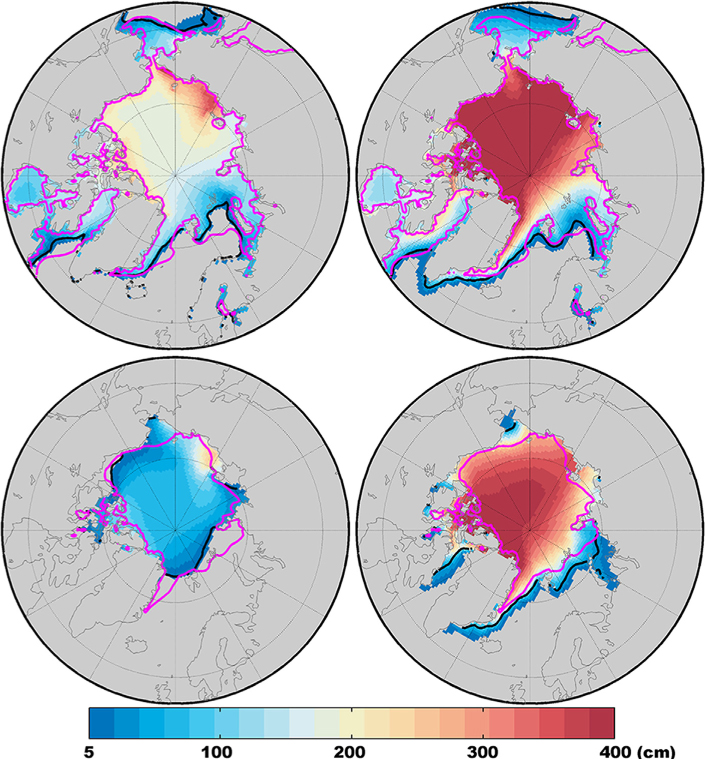
Fig. 2
1980–1999 average sea-ice thickness (cm) and sea-ice margin (SIC >15%; black contours) for the ensemble mean of the three RCAO climate projections (left) and ECHAM5/MPI-OM (right) for March (top) and September (bottom). ERA-Interim sea-ice margin location is shown in magenta contour.
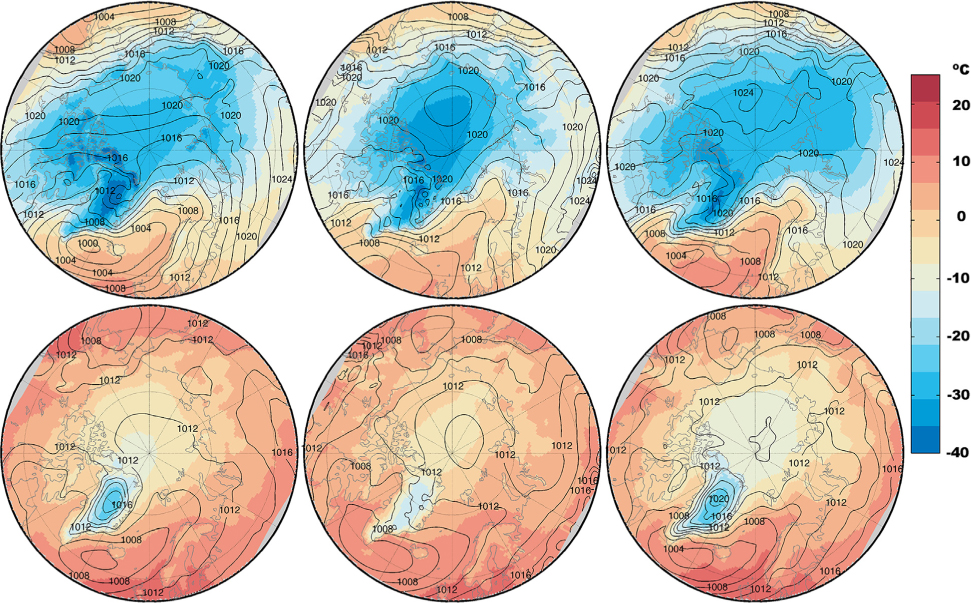
Fig. 3
1980–1999 average of T2M (colours) and sea level pressure (contours) for ERA-Interim (left), ensemble mean of the three RCAO projections (middle) and ECHAM (right) for March (top) and September (bottom).
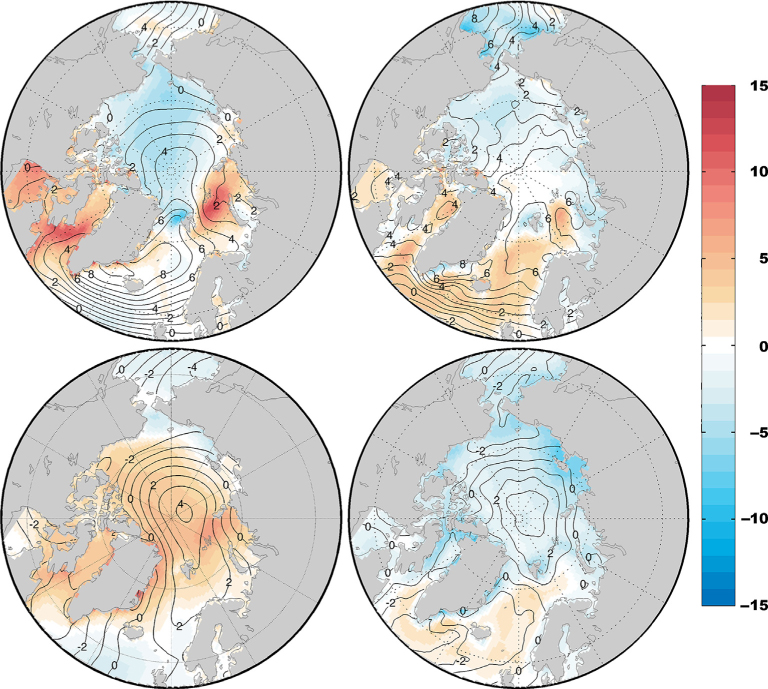
Fig. 4
1980–1999 differences for T2M (colours) and sea level pressure (contours) between RCAO minus ERA-Interim (left) and ECHAM minus Era-Interim (right) for March (top) and September (bottom).
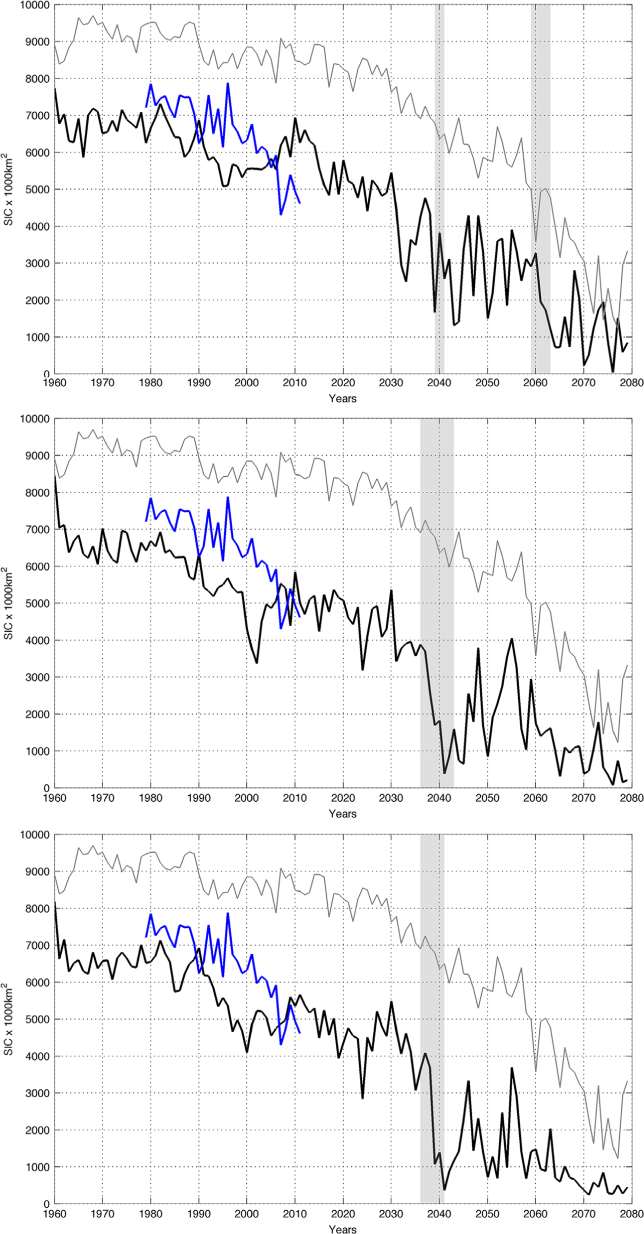
Fig. 5
RCAO simulated September sea-ice extent is shown in black for the 1980–2080 period: ECHstand2 (top), ECHMPIstand (middle) and ECHMPIflux (bottom). Grey shadings indicate rapid ice loss events considered in this study (Table 2). ECHAM and satellite observations (Fetterer et al., 2002; updated 2011) of September sea-ice extent are presented respectively in light grey and blue on all panels.
Table 2
RILE summary
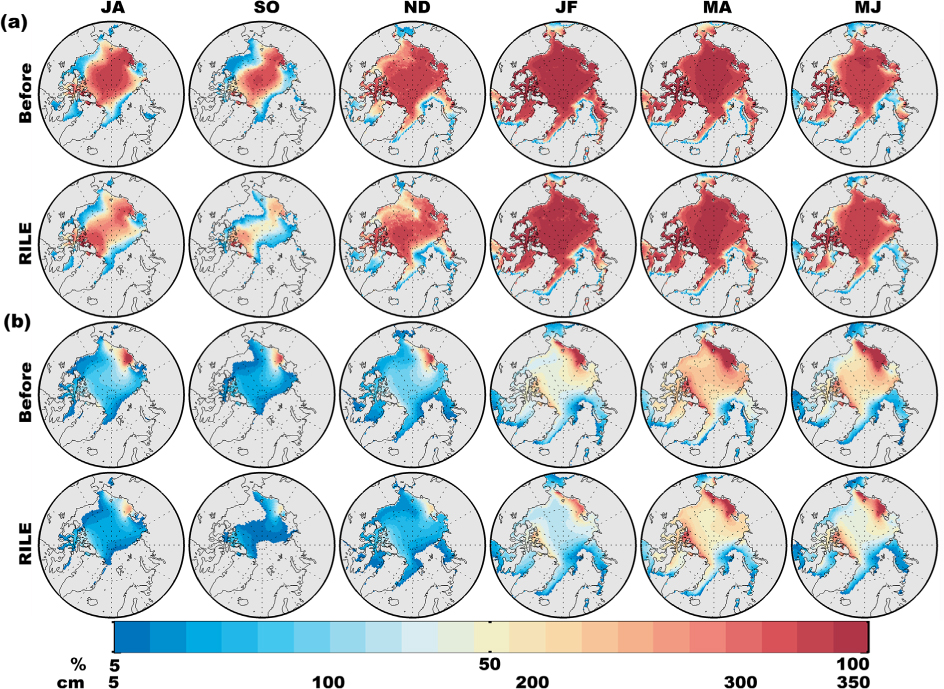
Fig. 6
Bimonthly averages of (a) sea-ice cover (fraction) and (b) thickness (cm) for pre-RILE (top) and RILE (bottom) period for R2 (2039 event, projection ECHMPIstand).
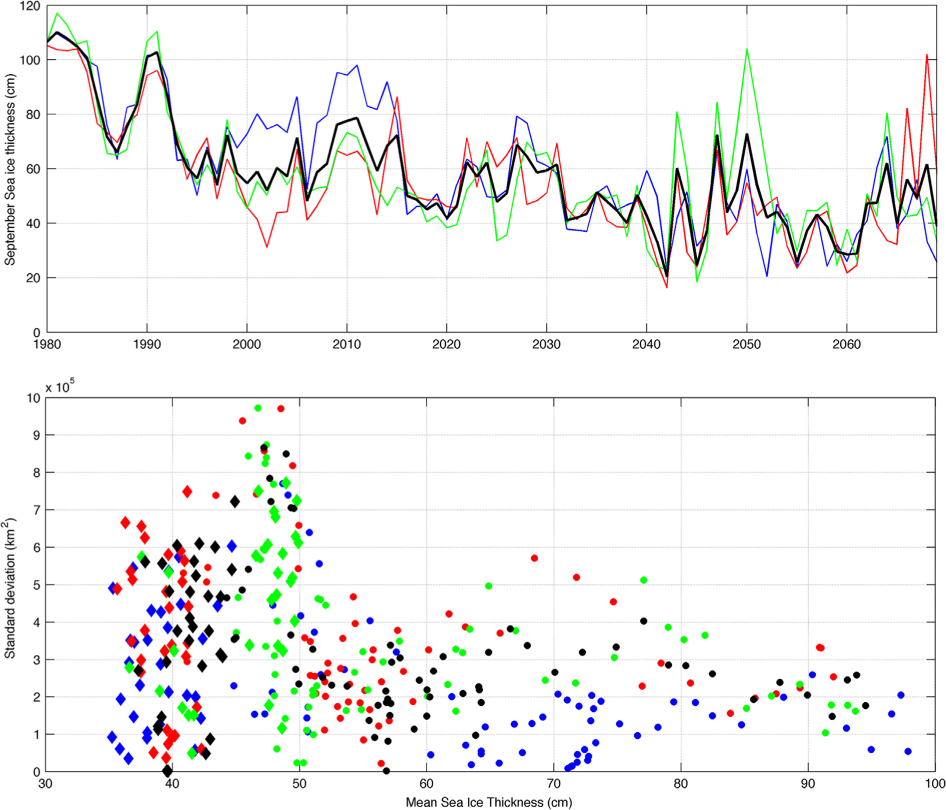
Fig. 7
(a) Average September sea-ice thickness for ECHStand2 (blue), ECHMPIStand (red), ECHMPIFlux (green) and ensemble average (black). (b) Relation between 20-year standard deviation of September sea-ice extent to 20-year average sea-ice thickness. Dots are used for 1980–2040 period, while diamonds corresponds to the 2041–2070 period. Black symbols represent the ensemble average of the three simulations.
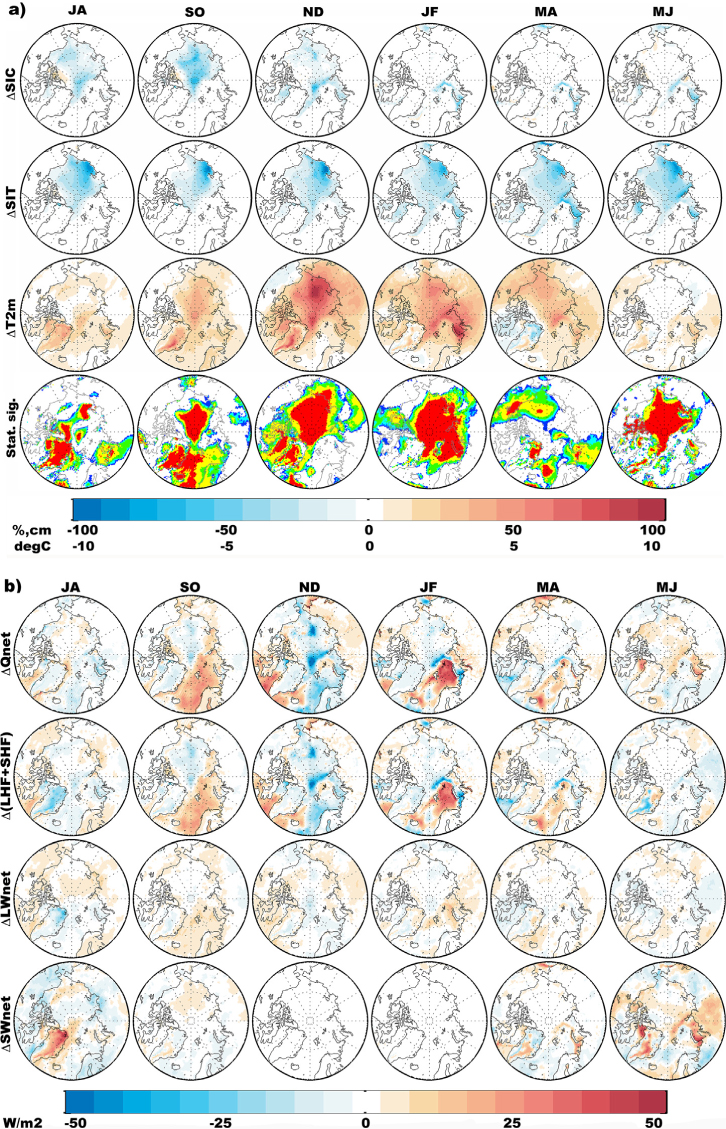
Fig. 8
(a) Bimonthly differences of RILE-(Pre-RILE) averages for R2 event: sea-ice cover (SIC,%), sea-ice thickness (SIT, cm), T2M (T2m, °C) and statistical significance of the T2M following a t-test at significance levels: 80%-blue, 90%-green, 95%-yellow and 99%-red. The 100-year trend in T2M was removed prior to statistical significance testing. (b) same as Fig. 8a but for: surface net radiative balance (Qnet, Wm2), combined latent and sensible heat fluxes (LHF+SHF, Wm−2), net surface longwave (LWnet, Wm−2), and net surface shortwave (Qnet, Wm−2). Fluxes are defined negative upward (away from the surface).
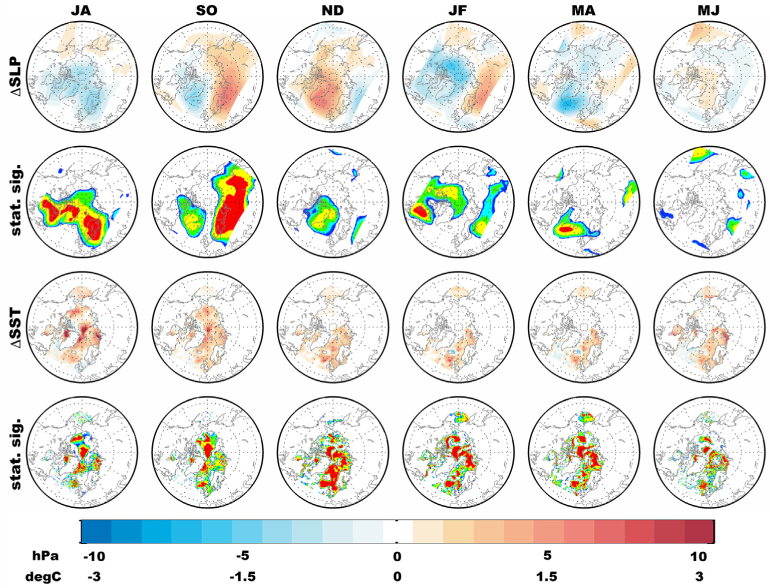
Fig. 9
Bimonthly differences of RILE-(Pre-RILE) averages for R2 event sea level pressure (first row), sea surface temperature (thirrd row) and their statistical significance (second and fourth row). In the figure showing the statistical significance, blue, green, yellow and red correspond to 80, 90, 95 and 99% confidence levels.
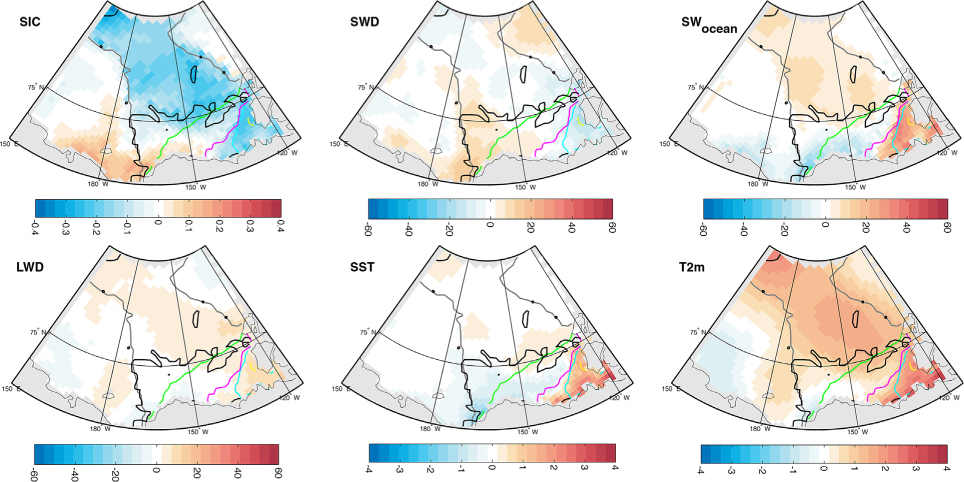
Fig. 10
Average MJJASO anomalies between 2041 against the 2010-2030 period for: sea-ice cover (top left), short-wave radiation down at the surface (top middle), shortwave radiation absorbed by the ocean (top right), long-wave radiation down at the surface (bottom left), sea surface temperature (bottom middle) and T2M (bottom right). Radiative flux anomalies are presented in Wm−2 and temperatures anomalies in °C. Contours show the location of the 2041 sea-ice margin (sea-ice cover>15%) for June (yellow), July (cyan), August (green), September (grey) and October (black).
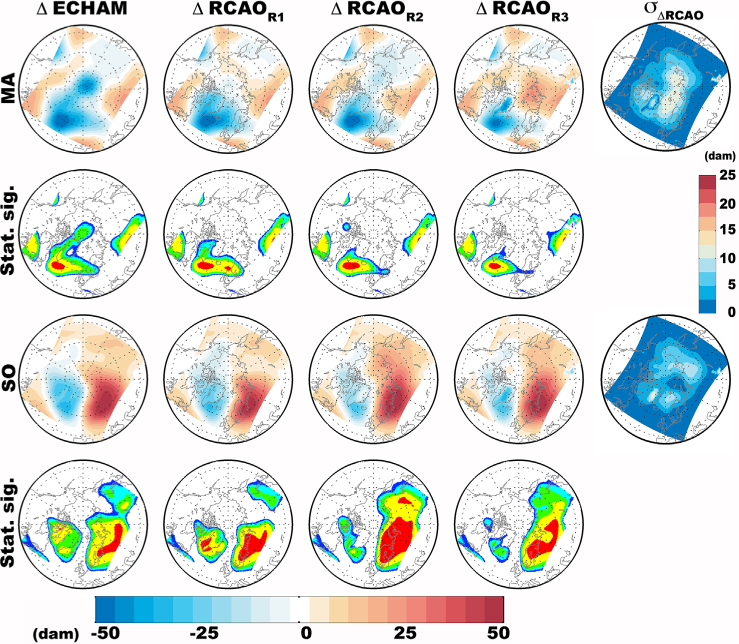
Fig. 11
Changes in 850hPa geopotential height for March–April (first row), statistical significance (second row), September–October (third row) and its statistical significance (fourth row) between period around RILEs (2036–2042) and the preceding 10-year period (2026–2035) for the driving model ECHAM, RCAO events R1, R2 and R3, from left to right respectively. In the figure showing the statistical significance from a t-test, blue, green, yellow and red correspond to 80, 90, 95 and 99% confidence levels. The last column represents the standard deviation amongst RCAO for the three projections.
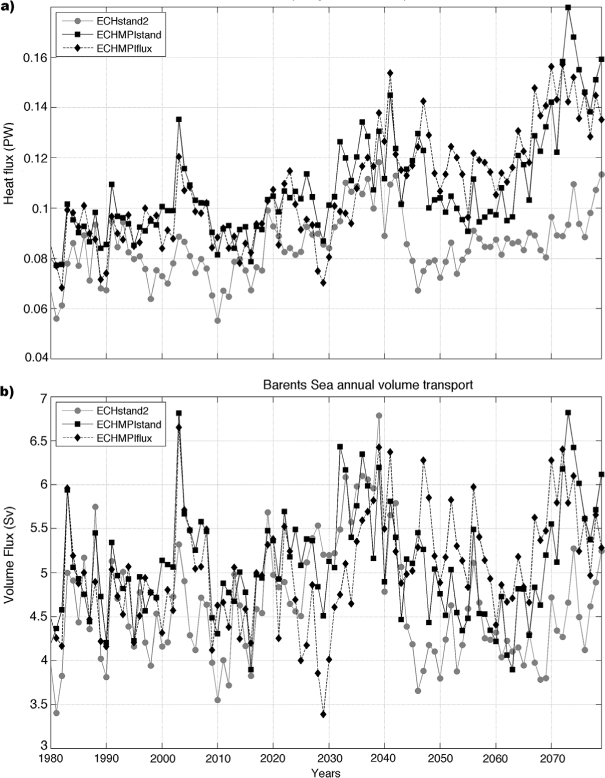
Fig. 12
Time series of the Barents Sea opening annual (a) oceanic heat transport (PW) and (b) volume transport (Sv) computed using a reference temperature of −0.1°C over the first 290 model first 25 vertical levels) for three RCAO climate projections: ECHstand2 (grey line), ECHMPIstand (black full line) and ECHMPIflux (black dotted line).
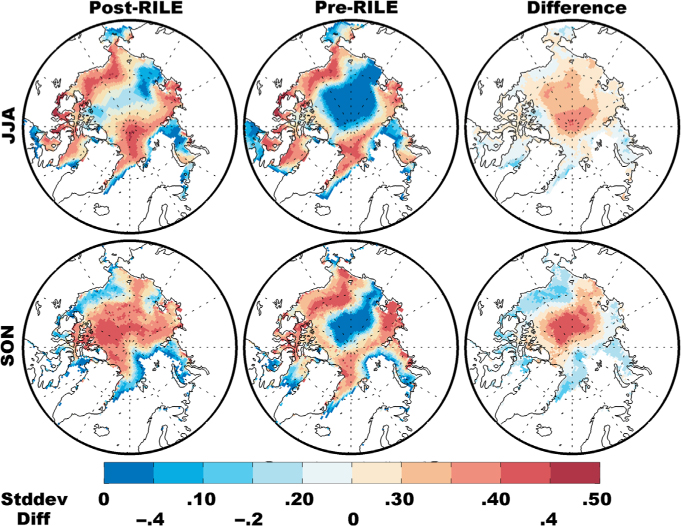
Fig. 13
Summer and autumn seasonal standard deviation of sea-ice cover for post-RILE (left), pre-RILE (middle) and their differences (right) for R2 event.
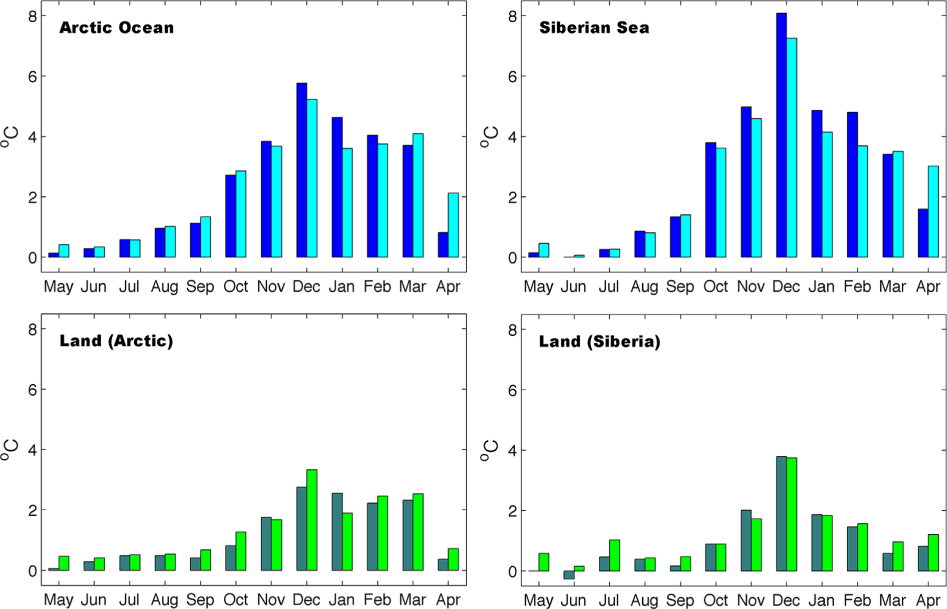
Fig. 14
T2M differences for RILE minus Pre-RILE periods (dark colours) and Post-RILE minus Pre-RILE (light colours) over the Arctic Ocean (top left), Arctic Land (bottom left), Siberian Sea (top right) and Siberian Land (bottom right). Arctic land is defined between 45–290°E and between 65°N and the coast while the Siberian sector is defined between 110–190°E and 65–90°N.

Fig. 15
November–December (a) spatially averaged vertical temperature profile over Arctic Ocean (blue), Siberian Sea (cyan), pan-Arctic land (red) and Siberian Sea land sector (green) for Pre-RILE (full) and RILE periods (dotted). (b) Differences RILE-(Pre-RILE) for same regions. The Arctic Ocean here is the region between latitudes 80–90°N between 90°W to 60°E and from 68–90°N from 60°E to 90°W. The Siberian Sea covers longitudes between 110°E to 190°E from the coastline to 90°N, while the Siberian Land covers land from 60°N to the coastline.