
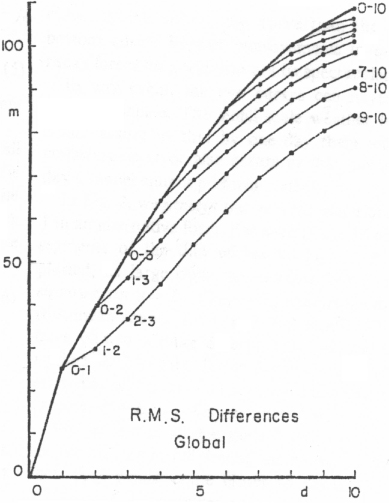
Fig. 1
Taken from Lorenz (1982, Fig. 1). Upper and lower bound predictability curves calculated from the 500-hPa geopotential height field of the ECMWF forecast system for the 100-d period from 1 December 1980 to 10 March 1981 (for details see text).
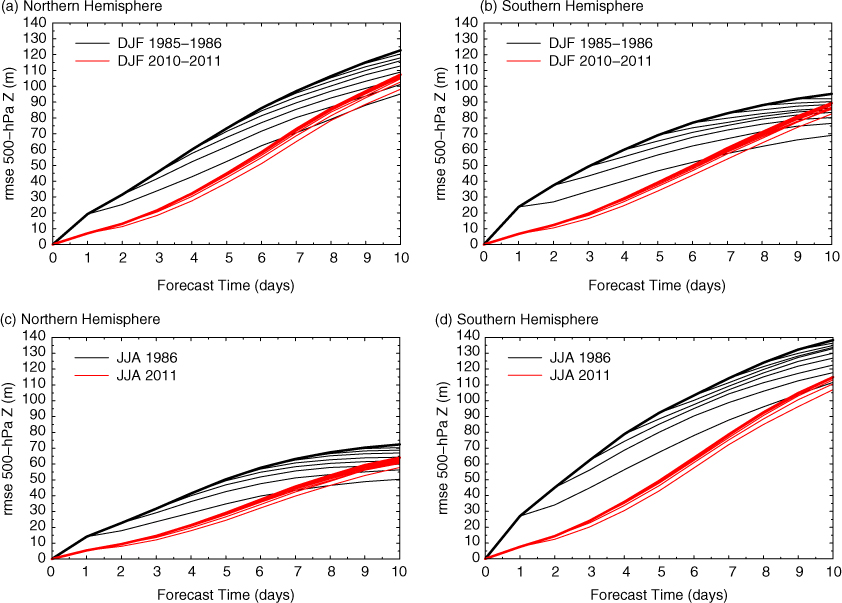
Fig. 2
Upper and lower bound predictability curves calculated from the 500-hPa geopotential height field of the ECMWF deterministic forecasts, in the same way as Lorenz (1982), for the DJF 1985/1986 (black curves) and DJF 2010/2011 (red curves) seasons in (a) the NH and (b) the SH and for the JJA 1985 (black curves) and JJA 2011 (red curves) seasons in (c) the NH and (d) the SH.
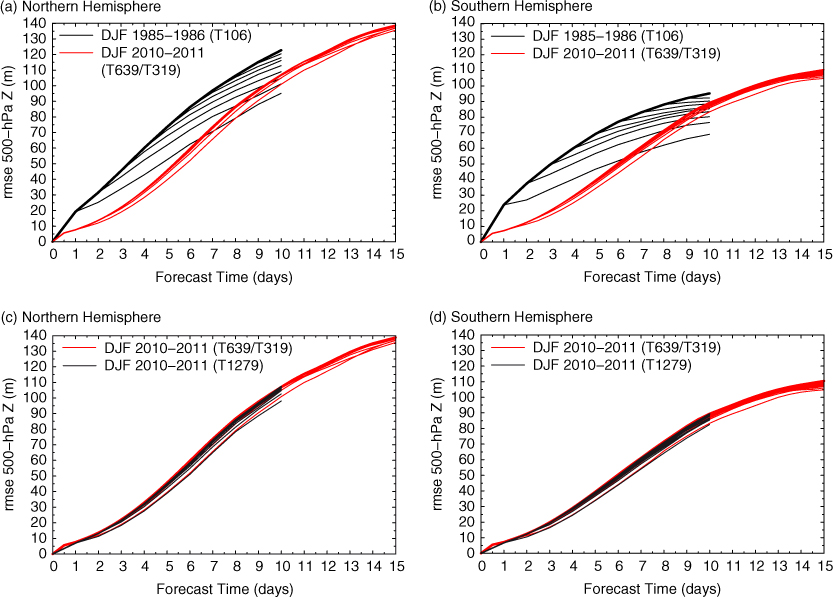
Fig. 3
Upper and lower bound predictability curves calculated from the 500-hPa geopotential height field of the ECMWF deterministic forecast for DJF 1985/1986 (black curves) and the ECMWF control forecast for DJF 2010/2011 (red curves) in (a) the NH and (b) the SH. The curves are also shown for the ECMWF deterministic forecast (black) and control forecast (red) for DJF 2010/2011 in (c) the NH and (d) the SH. All predictability estimates are calculated in the same way as Lorenz (1982).
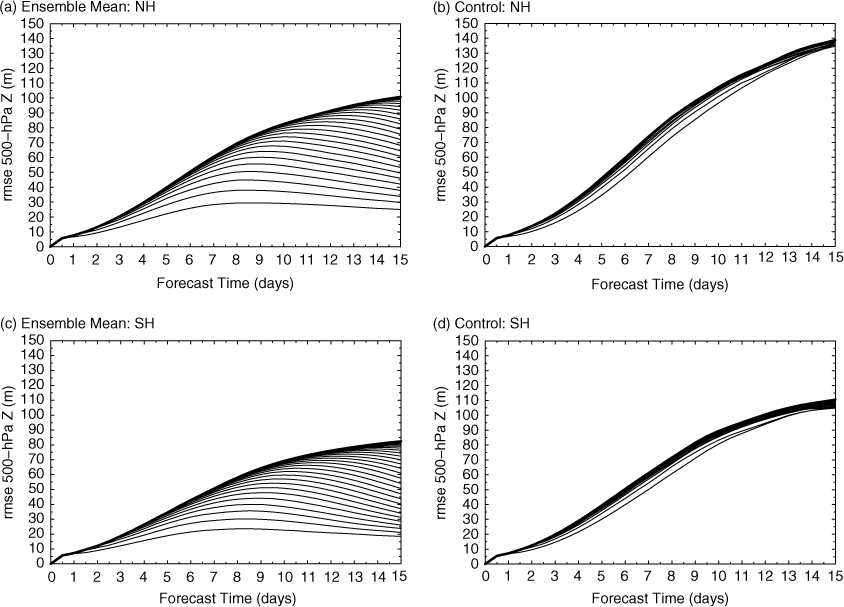
Fig. 4
Upper and lower bound predictability curves calculated from the 500-hPa geopotential height field of the ECMWF ensemble mean forecasts, analogous to Lorenz (1982) but every 12 h, for the DJF 2010/2011 season in (a) the NH and (b) the SH. The predictability curves are also shown for the control forecast in (b) the NH and (d) the SH.
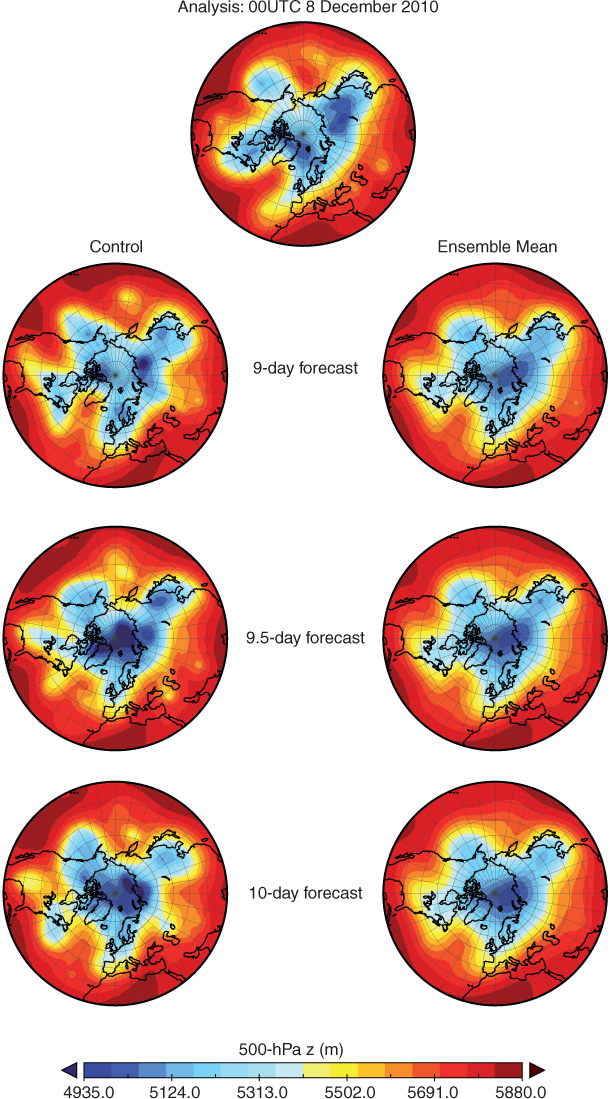
Fig. 5
ECMWF analysis and 9-, 9.5- and 10-d control and ensemble mean forecasts of 500-hPa geopotential height valid at 00 UTC 8 December 2010 over the NH.
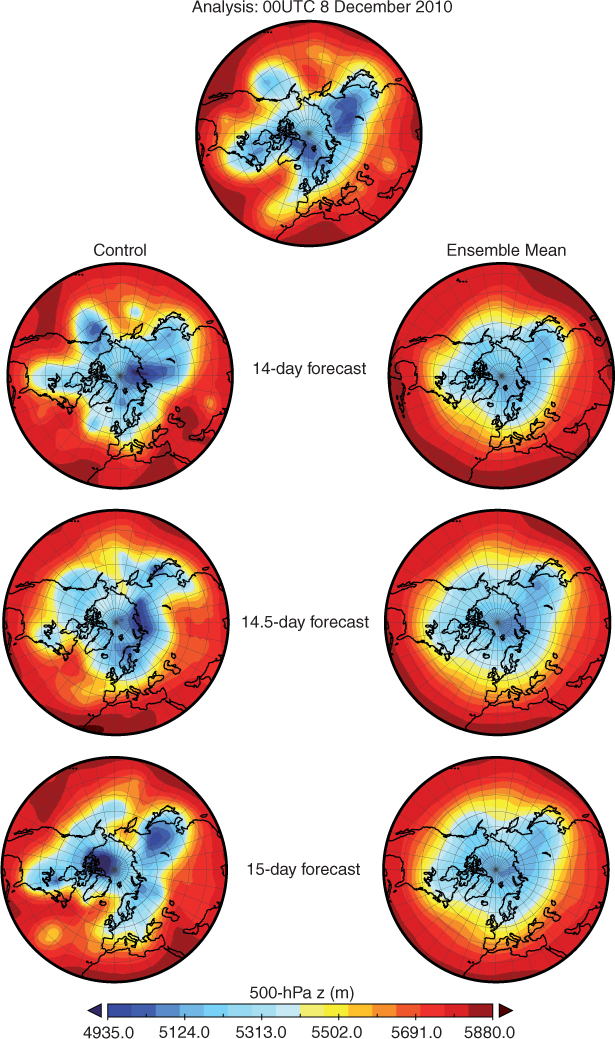
Fig. 6
The same as Fig. 5 but for the 14-, 14.5- and 15-d forecasts.
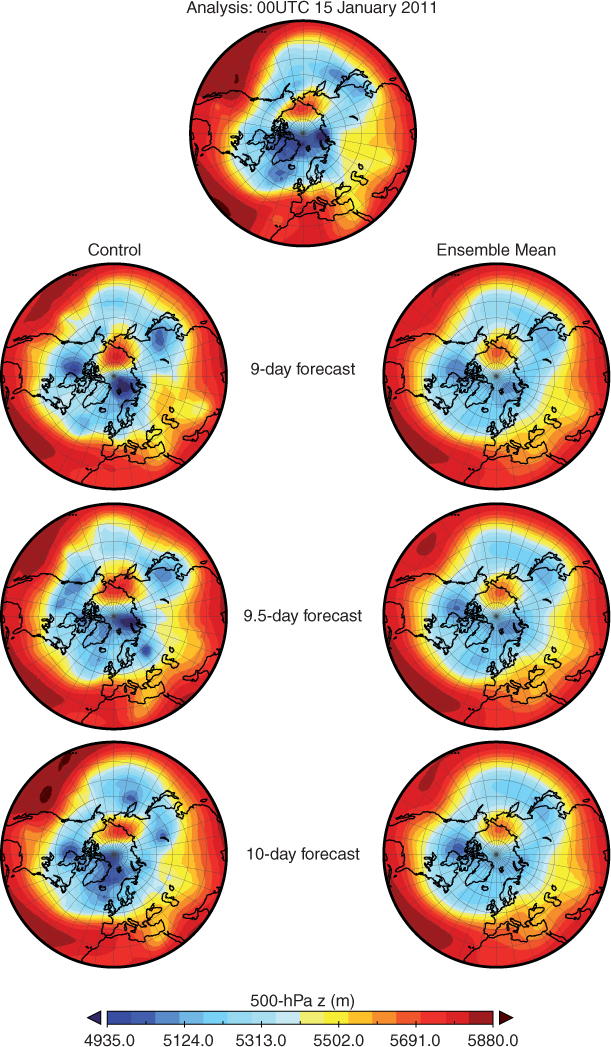
Fig. 7
The same as Fig. 5 but for 00 UTC 15 January 2011.
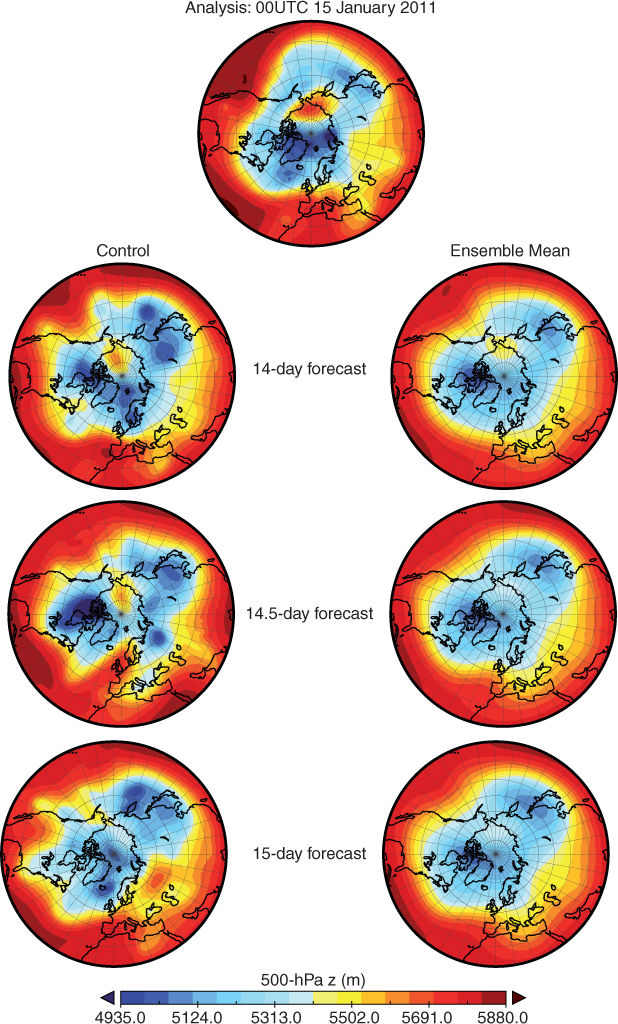
Fig. 8
The same as Fig. 6 but for 00 UTC 15 January 2011.