
Table 1. List of the CMIP3 models used in this study. The models with asterisk in their name have included volcanic forcing in their 20C3M experiments
Table 2. Global average CMIP3 multi-model mean (MM) feedbacks and interdecile range (IDR: the difference between the 90th and the 10th percentile of the model estimates) calculated based on long-term and short-term climate variability (see text for details). Results are also shown for the ERA-Interim, JRA-25 re-analyses. For the short-term feedbacks, the 2σ least squares fit uncertainty is indicated, as well. Units are Wm2K−1
[i] *Calculated over the period 2001–2009.
Fig. 1.
Global maps of all the radiative feedbacks (Planck, lapse rate, water vapour, surface albedo, cloud and net) of the CMIP3 multi-model mean, calculated based on their response from long-term climate changes due to the increase in greenhouse gas forcing. Units are in Wm−2K−1.
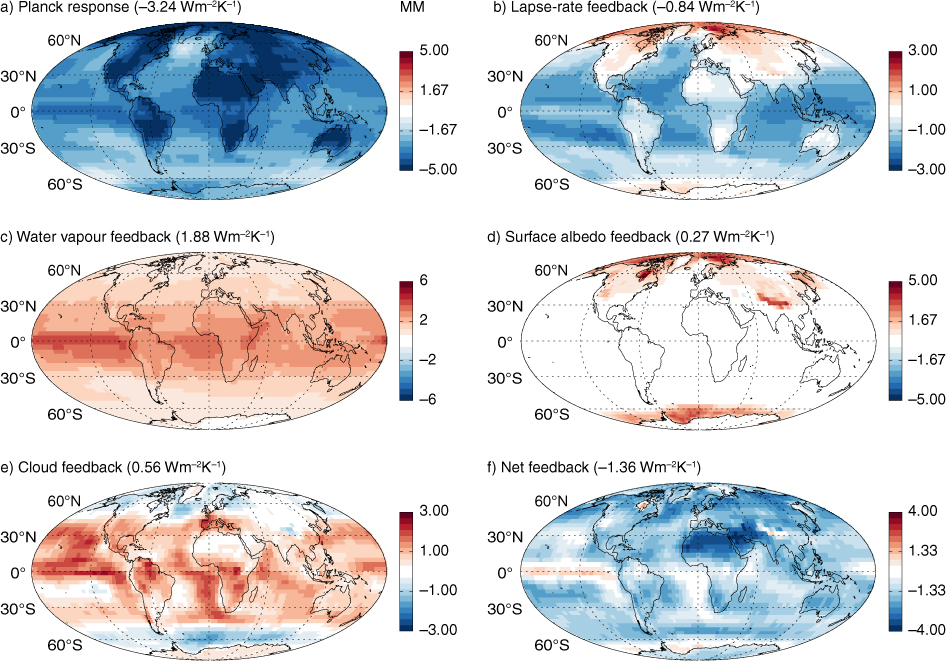
Fig. 2.
Global maps of all the radiative feedbacks of the CMIP3 multi-model mean calculated based on their response from short-term climate variability. Units are in Wm−2K−1.
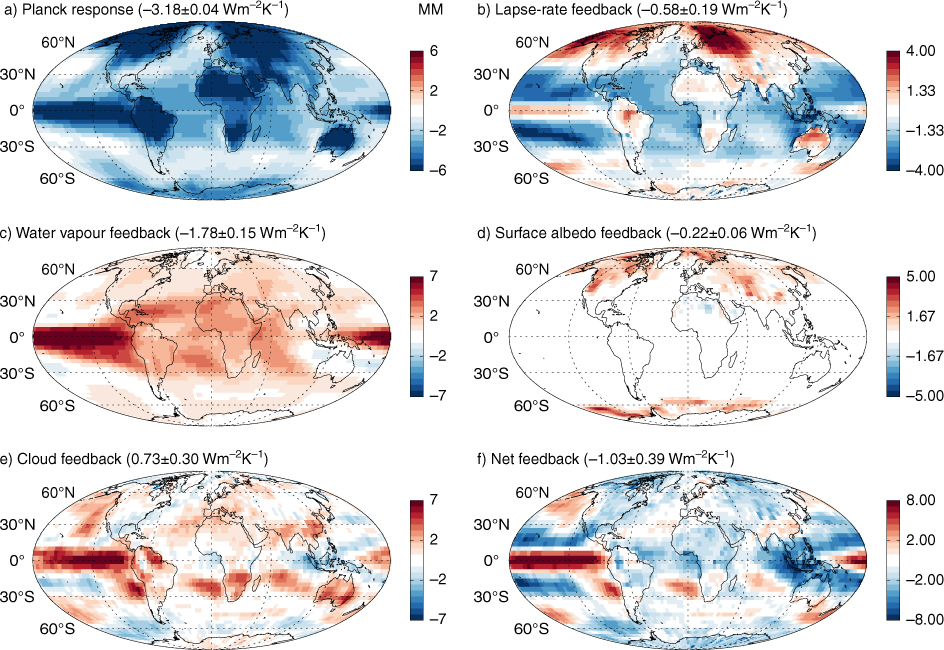
Fig. 3.
Global maps of the long-term (left panels) and short-term (right panels) cloud (longwave, shortwave and net) feedbacks. Units are in Wm−2K−1.
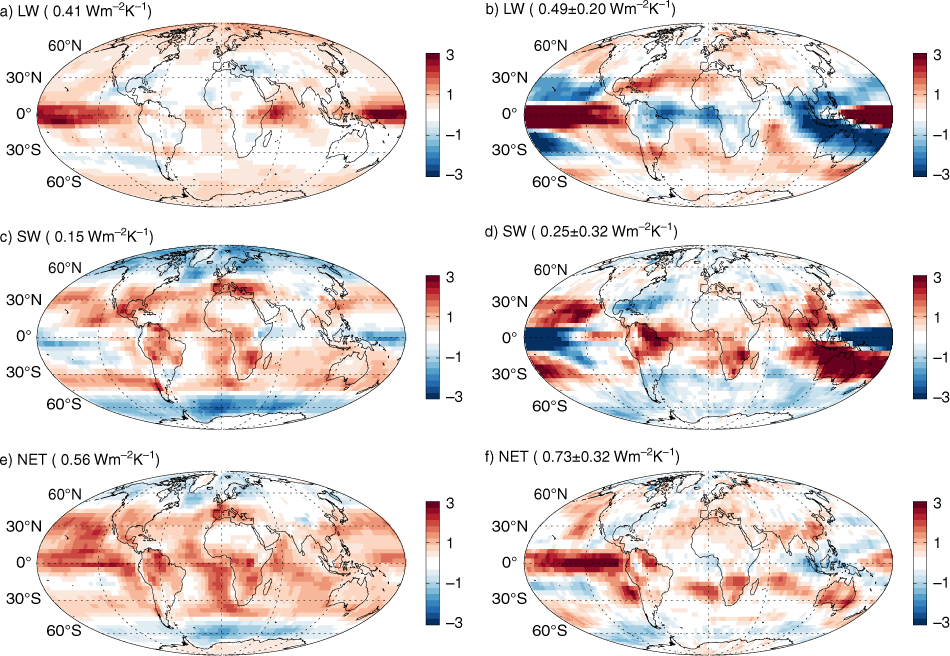
Fig. 4.
Radiative feedbacks (Planck, water vapour, lapse-rate, the combined water vapour plus lapse-rate feedback, surface albedo, cloud and net), computed for each of the CMIP3 models (in grey) and the multi-model mean (in black) for the long-term climate change experiments. The CMIP3 models and multi-model mean feedbacks (and their 2σ confidence intervals) computed based on the short-term variations are denoted in pink and black dots, respectively. Results from the ERA-Interim and JRA-25 re-analyses are shown in blue and green, respectively. Units are in Wm−2K−1.
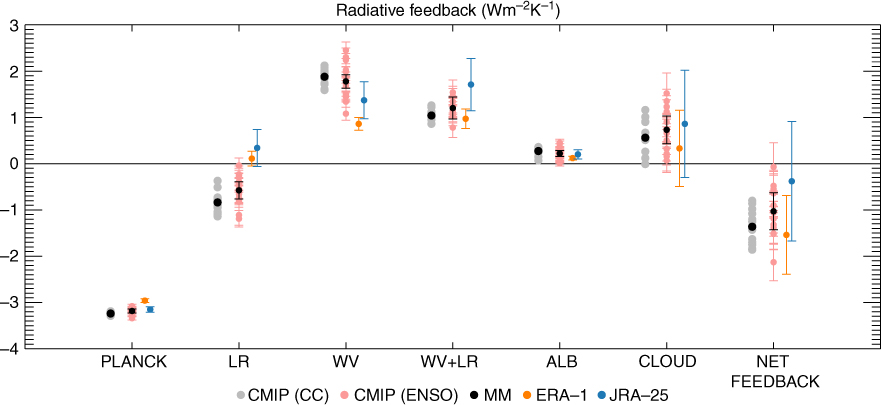
Fig. 5.
Global maps of the interdecile range of the CMIP3 models for the long-term feedbacks. Units are in Wm−2K−1.
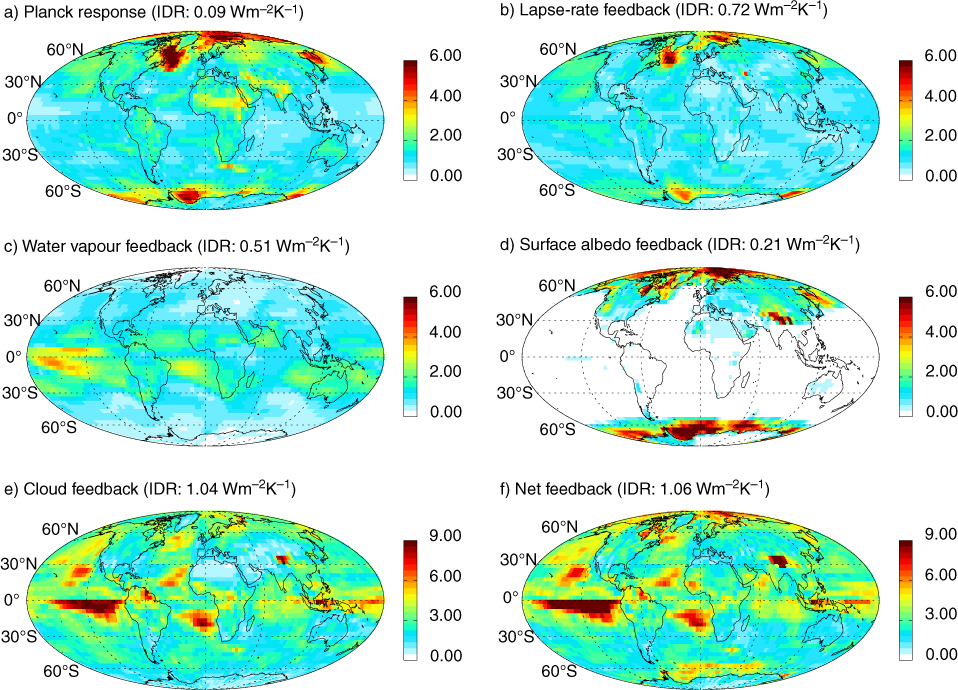
Fig. 6.
Global maps of the interdecile range of the CMIP3 models for the short-term feedbacks. Units are in Wm−2K−1.
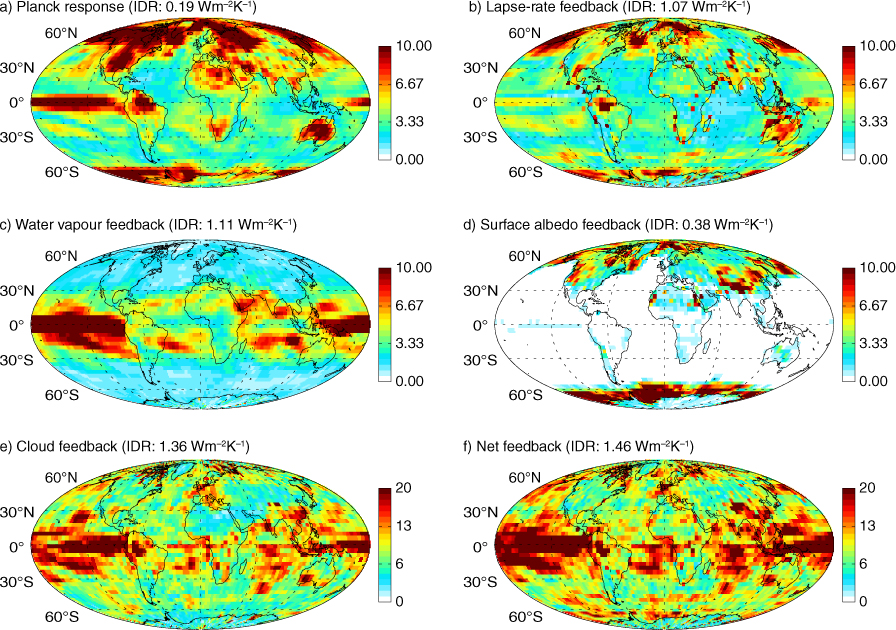
Table 3. Global average feedbacks (model mean and interdecile range) calculated for only three of the CMIP3 models with the most realistic ENSO representation (Oldenborgh et al., 2005), (gfdl_cm2_1, 9: miroc3_2_hires, 11: mpi_echam5: see text). Units are Wm2K−1
Table 4. Global average multi-model mean (MM) feedbacks (in Wm2K−1), interdecile range (IDR) and correlation in respect to the ‘20C’ feedbacks, calculated based on the ‘AMIP’ (atmosphere-only) climate simulations
Table 5. Global average multi-model mean (MM) feedbacks (in Wm2K−1) and interdecile range (IDR) calculated based on the ‘20C’ CMIP3 climate simulations for three different time periods
Fig. 7.
Latitudinal variation of the short-term, feedbacks for the CMIP3 multi-model mean (black line) and the ERA-Interim (in orange) and JRA-25 (in green) reanalyses. The grey shaded area denotes the CMIP3 inter-model spread. Notice that the cloud feedbacks have been computed using both re-analyses and satellite CERES top of the atmosphere radiation fluxes (see text for details) for the period from 2001 to 2009. Units are in Wm−2K−1.
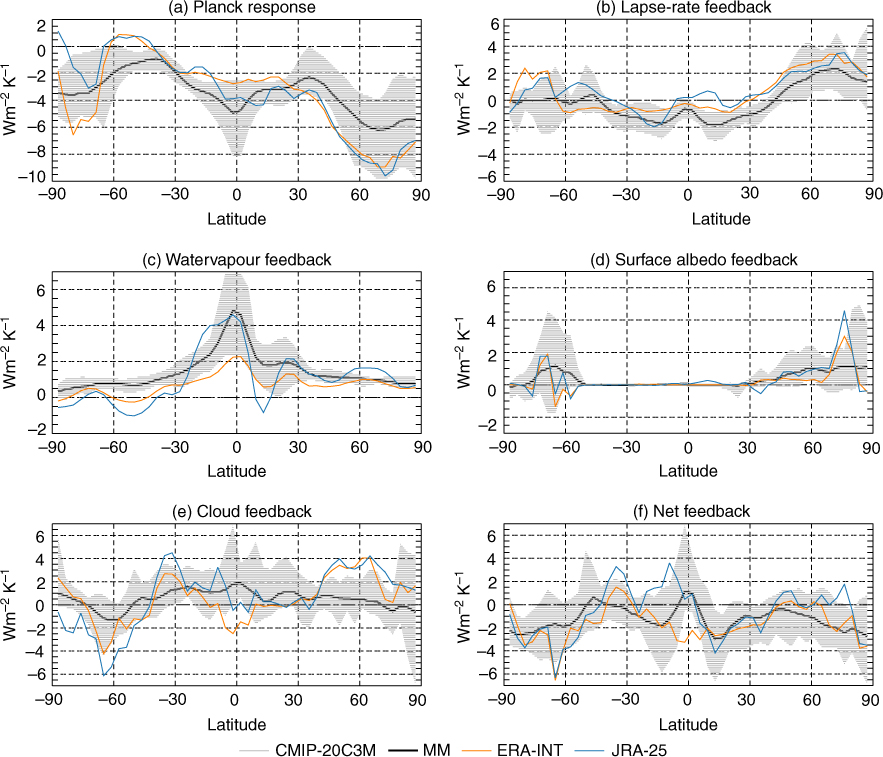
Table A.1 Global average “long-term” climate feedbacks (in Wm2K−1) for each of the CMIP3 models
Table A.2. Global average “short-term” climate feedbacks (in Wm2K−1) and their 2σ least squares fit uncertainty, for each of the CMIP3 models
Table A.3. Global average “short-term” climate feedbacks (in Wm2K−1) and their 2σ least squares fit uncertainty, computed based on the AMIP model simulations