Fig. 1.
Relative vorticity (yellow and green) and streamlines (red) at 850 hPa from ECMWF analyses. Cyclones C1, C2 and the remnants of TCS-025 area labelled.
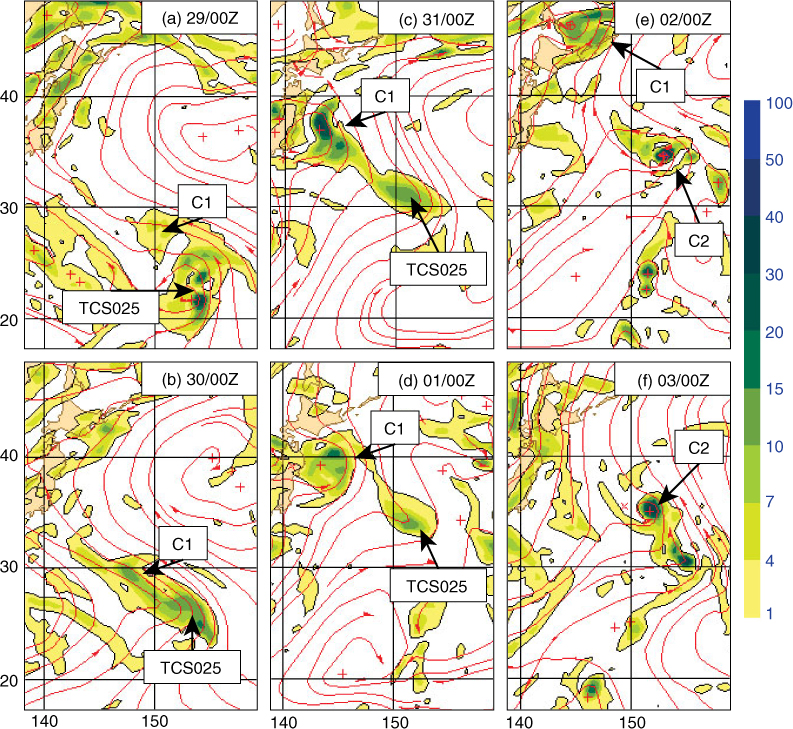
Fig. 2.
Maps of potential temperature (K) and wind on the 2 PVU surface of potential vorticity (1 PVU =106 m2K kg−1s−1) valid along with contours of sea-level pressure (5 hPa interval) at 00 UTC on: (a) 30 August, 2008; (b) 31 August; (c) 1 September; and (d) 2 September. Star symbols indicate cyclone C1 and X symbols indicate C2 (remnant of TCS-025). ‘L’ symbols indicate cold lows on the tropopause, with L1 and L2 associated with C1 and C2, respectively.
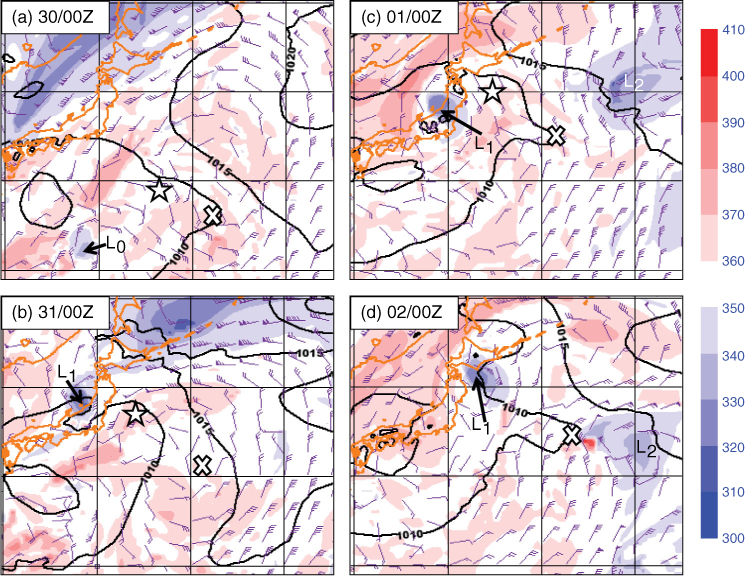
Fig. 3.
Vector shear, depicted as streamlines and shear magnitude (m/s), in the layer from 850 to 500 hPa from the ECMWF analysis valid 00 UTC: (a) 31 August; and (b) 2 September. Disturbance has been removed prior to shear computation. Location of C1 is indicated by the star, and C2 is indicated by the white ‘X’.
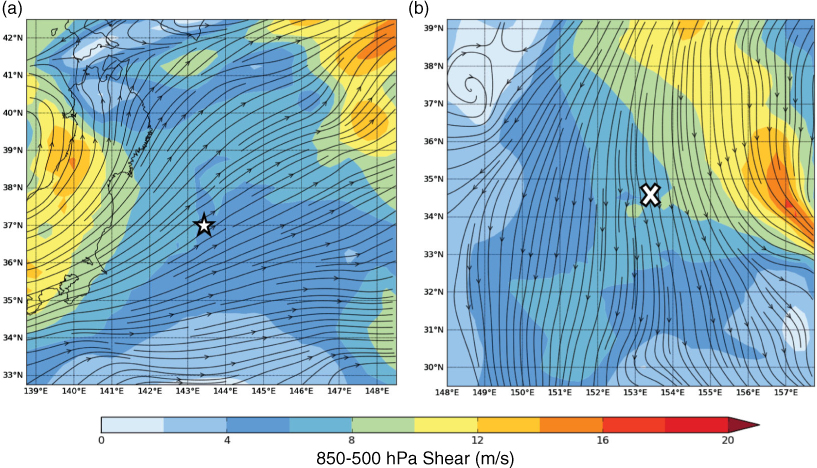
Fig. 4.
(a) Sea-surface temperature analysis valid 00 UTC 31 August; (b) virtual temperature (shaded) and relative vorticity at 850 hPa valid 00 UTC 31 August; and (c) as in (b), but for 0000 UTC 1 September; and (d) as in (b) but for 0000 UTC 2 September. White arrows in (b) and (c) indicate the flow direction at 850 hPa as depicted in Fig. 1. The star and ‘X’ in panel (a) denote the locations of C1 at 0000 UTC 31 August and C2 at 0000 UTC 2 September, respectively.
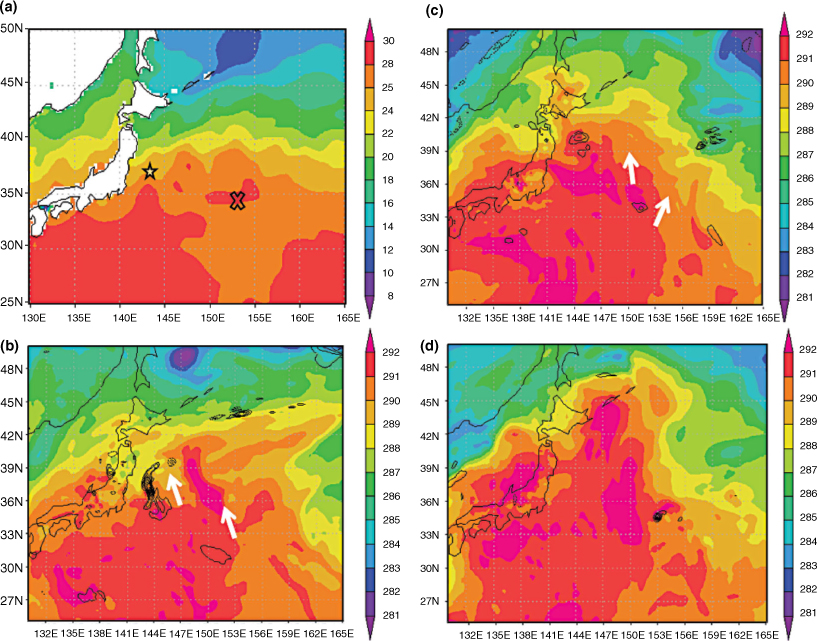
Fig. 5.
Relative humidity and relative vorticity at 850 hPa at 0000 UTC daily from 29 August to 3 September in (a)–(f), respectively. Cyclones are labelled as in Fig. 1. Panel (b) shows dropsonde winds at 850 hPa and numbered soundings to appear in Fig. 7.
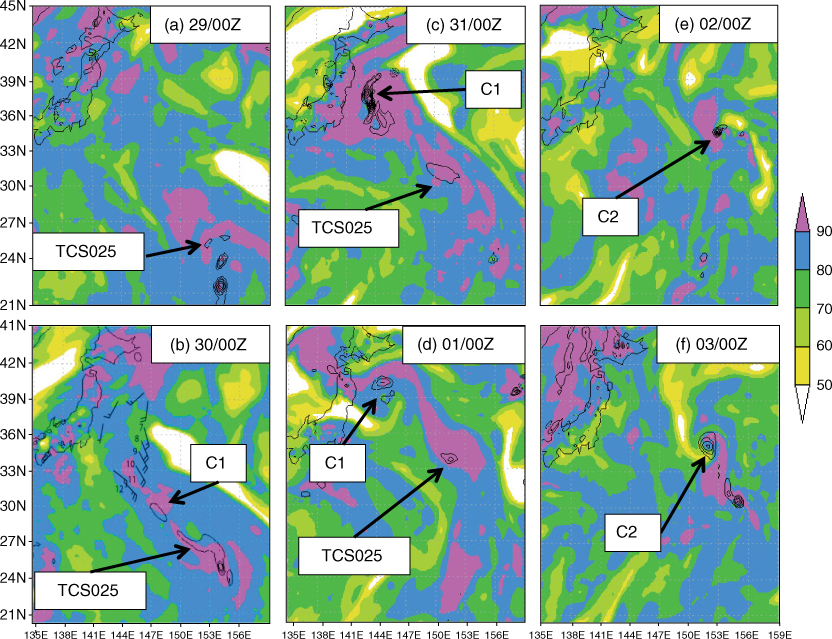
Fig. 6.
QUIKSCAT-derived surface winds valid: (a) 0810 UTC August 30; (b) 1831 UTC August 30; and (c) 0734 UTC 31 August. Long barb is 5 m/s and barbs are coloured according to wind speed. Black dot with no wind plotted indicates wind failed variational quality control test (i.e. is spatially inconsistent); ‘x’ indicates rain detected. (d) IR image valid 0830 UTC 30 August; (e) IR image valid 1830 UTC August; and (f) IR image valid 0730 UTC 31 August. Black boxes in (d), (e) and (f) indicate areas shown in (a), (b) and (c), respectively. Red circles in (a)–(c) and black circles in (d)–(f) indicate the location of mesoscale cyclone centre.
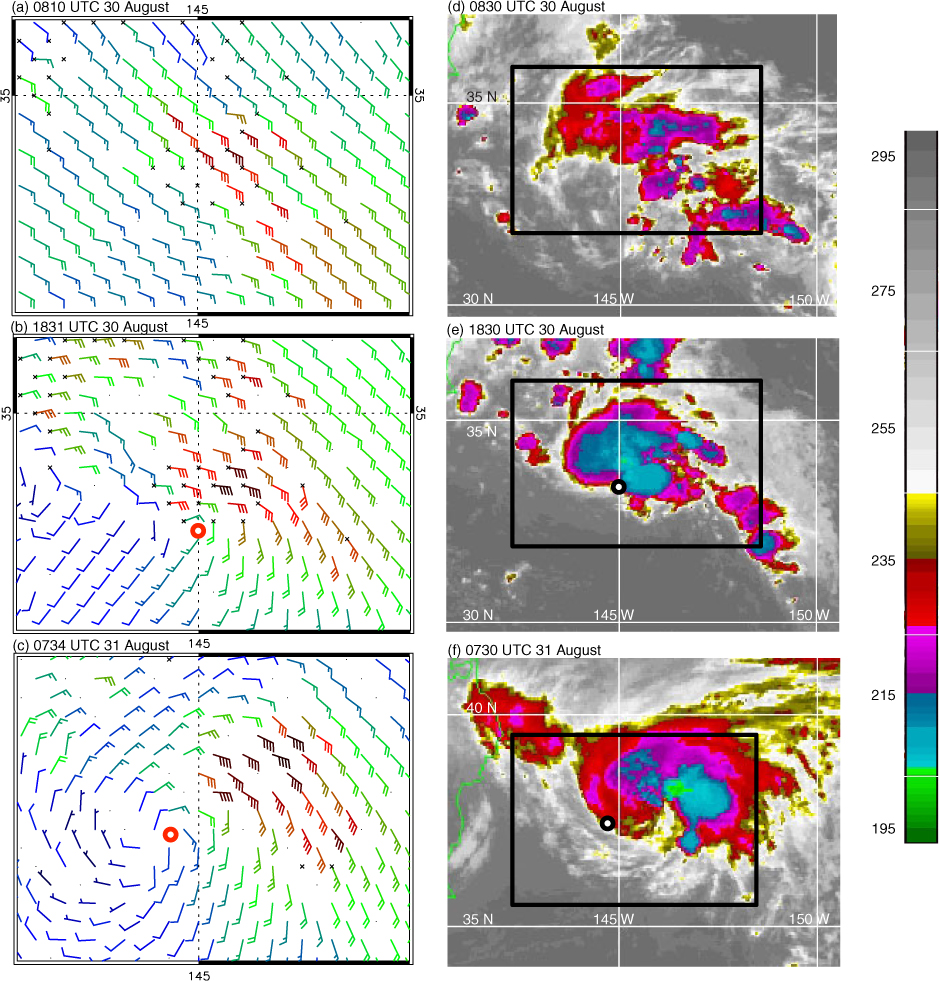
Fig. 7.
(a) cross section (soundings 7–12 in Fig. 5b) of equivalent potential temperature (5 K contour interval), wind and water vapour mixing ratio from DIAL aboard the DLR Falcon (g/kg) valid at approximately 00 UTC 30 August; (b) skew-t depiction of sounding 10, located by red arrow in panel (b).
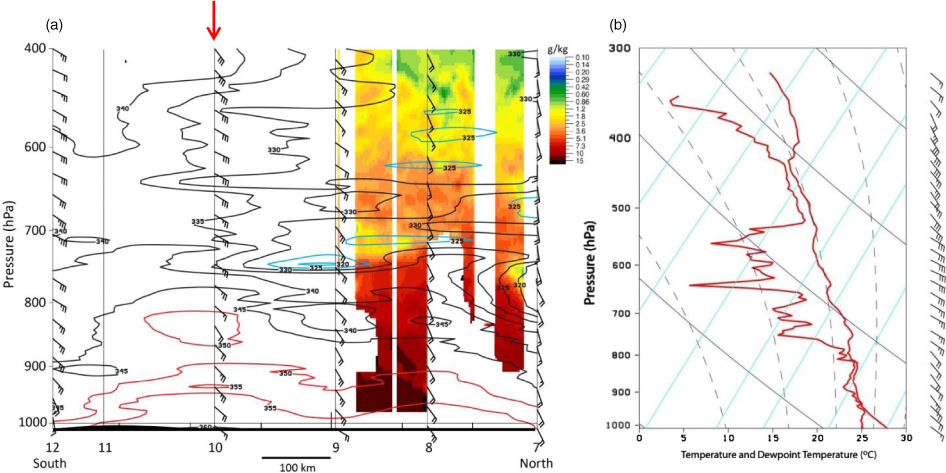
Fig. 8.
Equivalent potential temperature and wind at 850 hPa (black or white wind barbs), relative humidity and wind at 500 hPa (green) superposed on ECMWF vorticity analysis (grey) at 850 hPa, valid 00 UTC 31 August and IR satellite image valid 0030 UTC 31 August (colour). Colour scale as in Fig. 6. Red circle indicates the estimated location of the developing mesoscale cyclone at 0000 UTC based on positions indicated in Fig. 6.
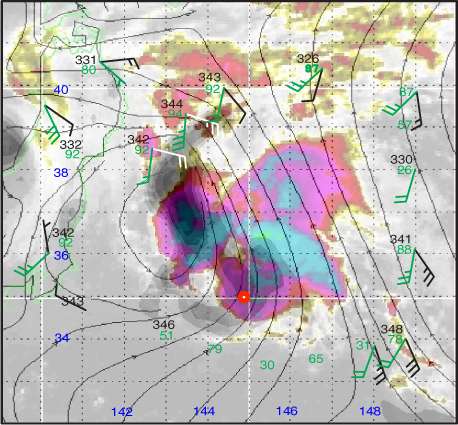
Fig. 9.
(a) Potential vorticity at 850 hPa (contours) and 500 hPa (colours) from ECMWF forecast initialized at 12 UTC 30 August valid 00 UTC 31 August; (b) cross section of PV along segment shown in (a) directed approximately along the direction of vertical shear. Contour interval in (a) is 1 potential vorticity unit (PVU), with 1 PVU=10−6 m2K kg−1s−1.
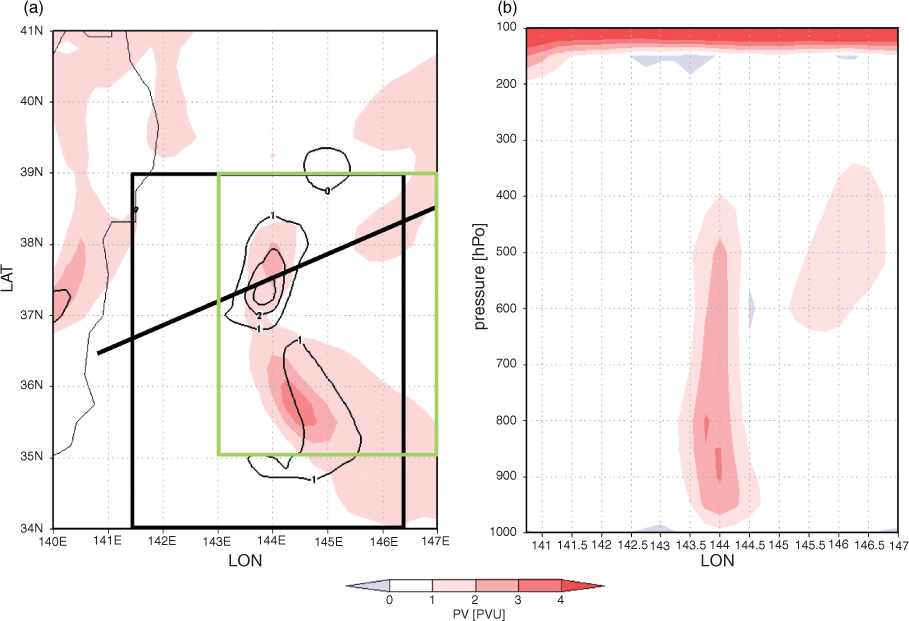
Fig. 10.
(a) Vorticity changes from 1200 UTC 30 August to 0000 UTC 31 August, representing the mean of the 81-member ensemble budget; and (b) t-statistic for each profile in (a); dashed line is 99% confidence value.
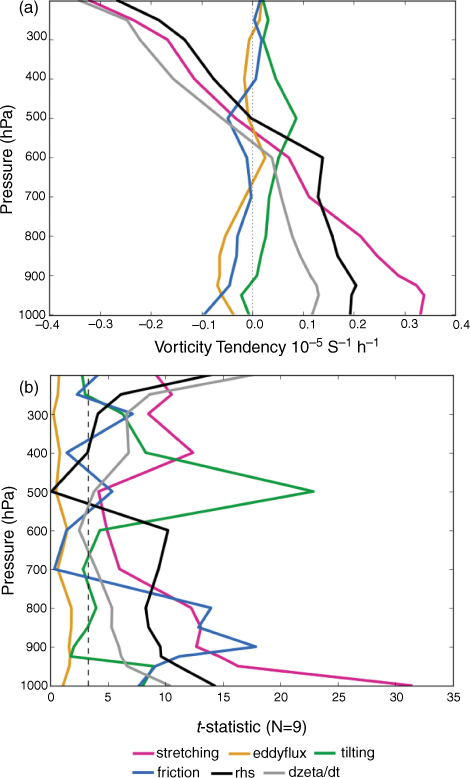
Fig. 11.
Advanced Scatterometer (ASCAT) surface winds valid: (a) 2315 UTC 01 September; and (b) 1034 UTC 02 September; (c) IR satellite image for 2330 UTC 01 September; and (d) IR image for 1030 UTC 02 September. Black dot indicates wind failed variational quality control test (i.e. is spatially inconsistent); ‘x’ indicates rain detected. Black boxes in (c) and (d) indicate areas shown in (a) and (b), respectively. Heavy dashed lines indicate wind shift lines. Red and black circles in 9b) and (d), respectively, indicate cyclone centre location.
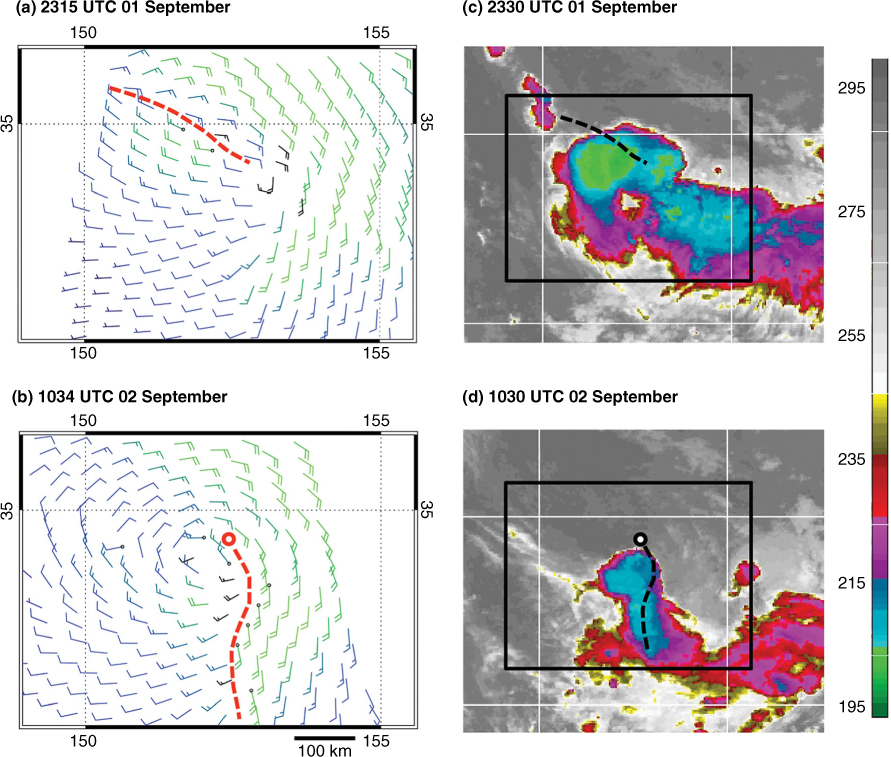
Fig. 12.
(a) Potential vorticity at 850 hPa (contours) and 500 hPa (colour) from ECMWF forecast initialized at 12 UTC 01 September valid 00 UTC 02 September; (b) cross section of PV along segment shown in (a) directed approximately along the direction of vortex tilt. Contour interval in (a) is 1 potential vorticity unit (PVU), with 1 PVU=10−6 m2K kg−1s−1.
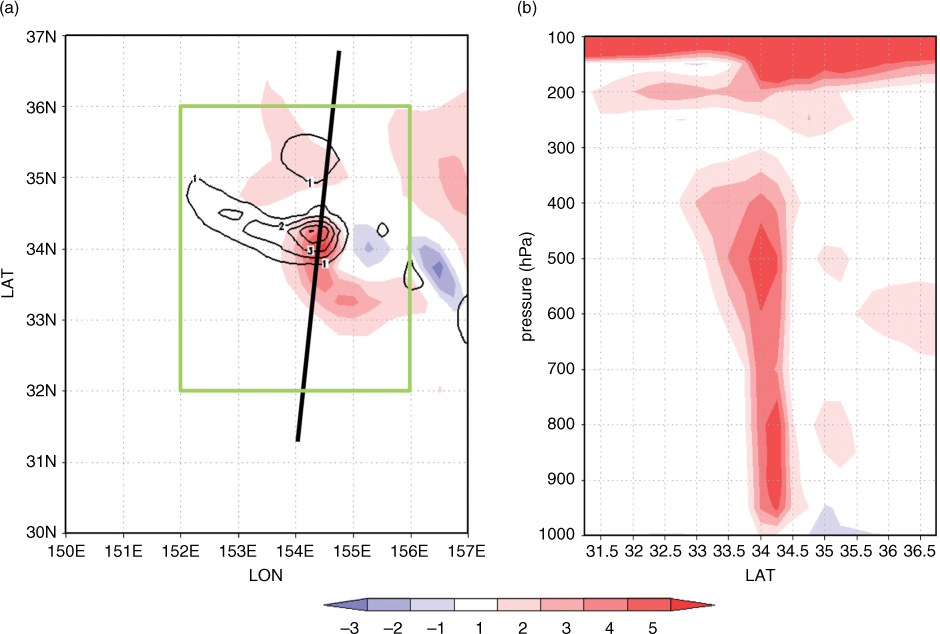
Fig. 13.
Change in (a) water vapour mixing ratio (g/kg) averaged over green box in Fig. 9a from 2100 UTC 30 to 0000 UTC 31 August; (b) water vapour mixing ratio (g/kg) averaged over green box in Fig. 12a from 2100 UTC 01 to 0000 UTC 02 September; (c) and (d), as in (a) and (b), respectively, but for temperature changes (K). Green: dynamics (vertical and horizontal advection); purple: grid-scale cloud scheme; light green: cumulus scheme; orange: turbulent diffusion and fluxes; yellow: radiation (generally a small contribution); red: total change.
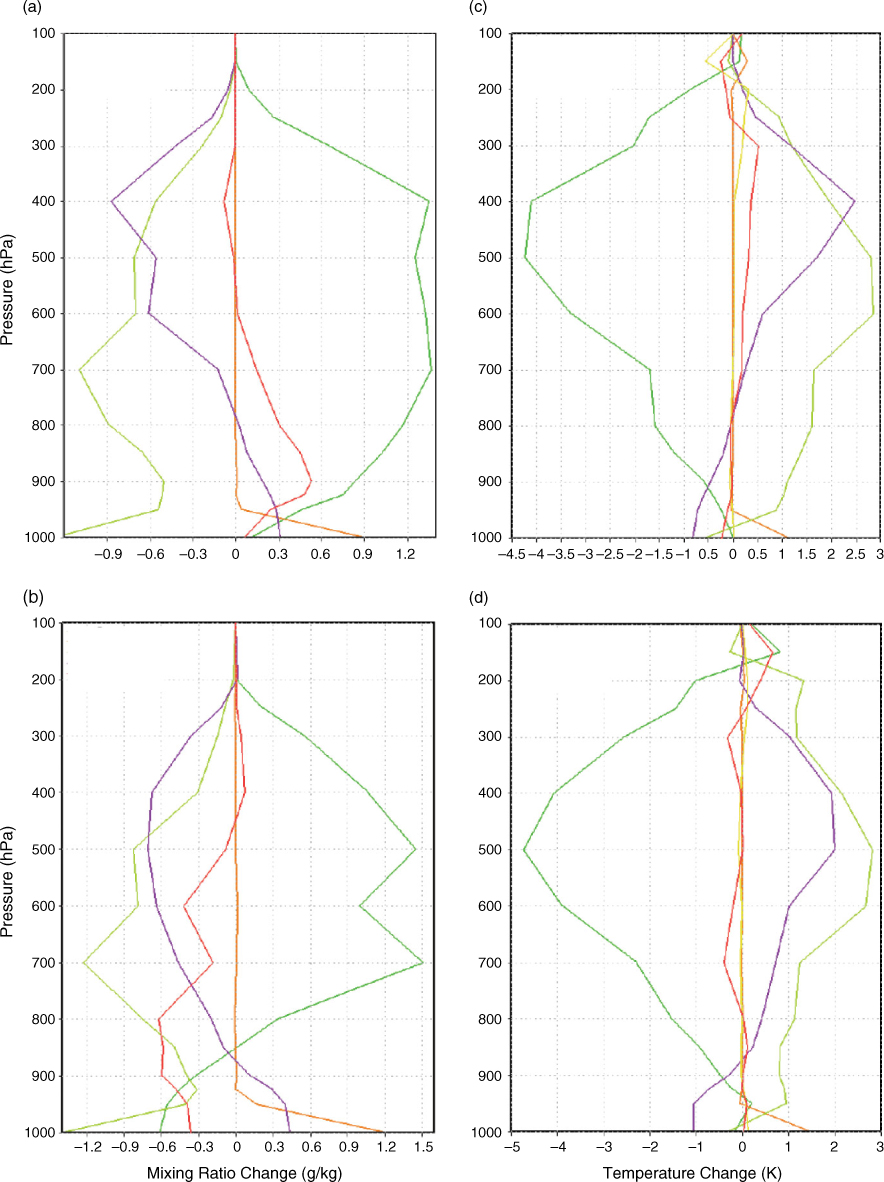
Fig. 14.
Vorticity and streamlines at 850 hPa for TCS-037 (16W). Black rectangle in (b) is area shown in Fig. 15a.
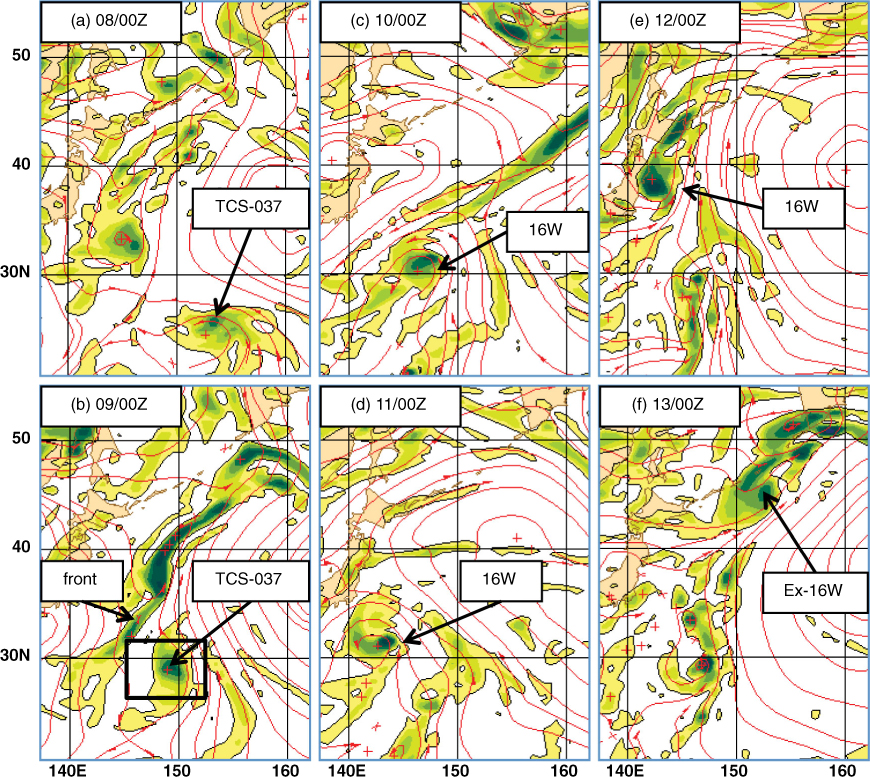
Fig. 15.
ASCAT images for TCS-037: (a) 0012 UTC 9 September; and (b) 1107 UTC 10 September.
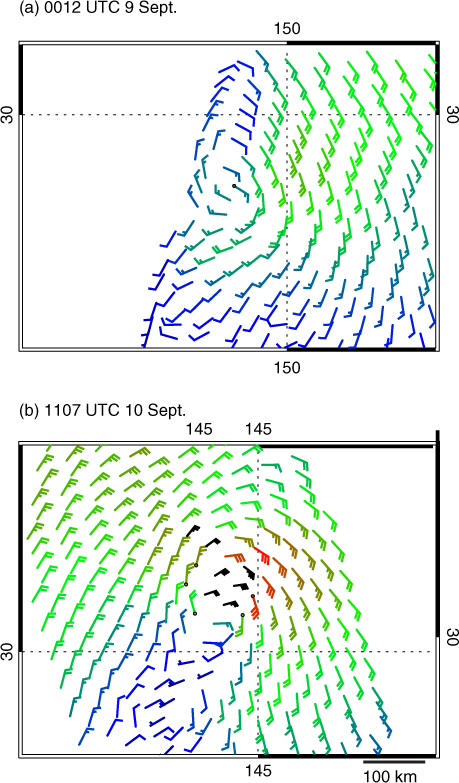
Fig. 16.
(a)–(c) Infra-red cloud-top temperature at 0357, 0657 and 1957 UTC 9 Sept., respectively; (d) TRMM precipitation radar at 2103 UTC 9 September; (e) and (f) 85 GHz polarized corrected temperatures from SSMI at 10 September 2001, and 0956 UTC 11 September, respectively. White circle denotes centre of TCS-037.
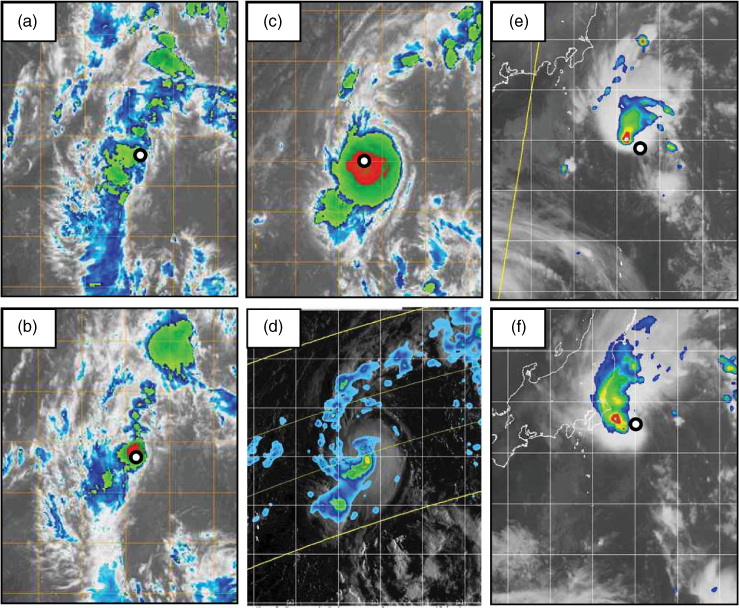
Fig. 17.
(a) Winds at 850 hPa, time–space corrected and relative to movement of TCS037 (toward 315° at 5.5 ms−1) and 850 hPa equivalent potential temperature (K) valid 0000 UTC 09 September superposed on GOES visible image for 2330 UTC 08 September; (b) cross section at 0000 UTC 09 September oriented from northwest (left) to southeast showing virtual potential temperature (K) and system-relative winds from soundings indicated by red dots in (a).
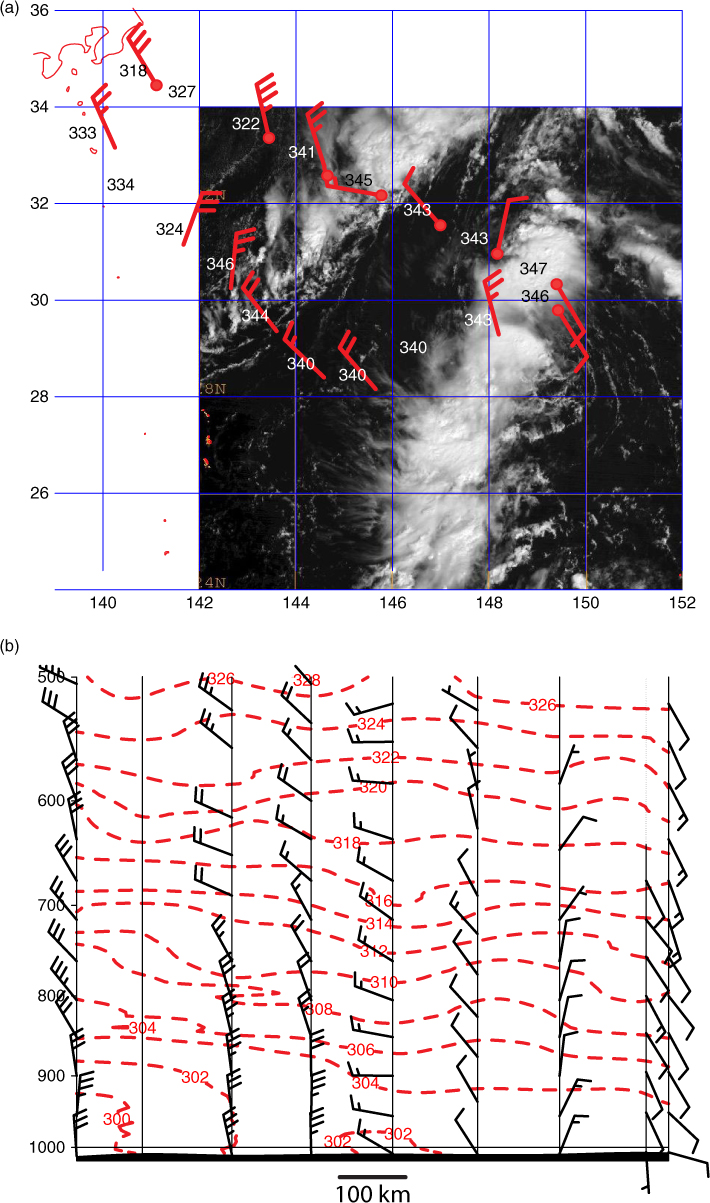
Fig. 18.
Vector shear, depicted as streamlines and shear magnitude (m/s), in the layer from 850 to 200 hPa from the ECMWF analysis valid 12 UTC (a) 9 September and (b) 10 September. Disturbance has been removed prior to shear computation. Location of 16W is indicated by the white ‘X’.
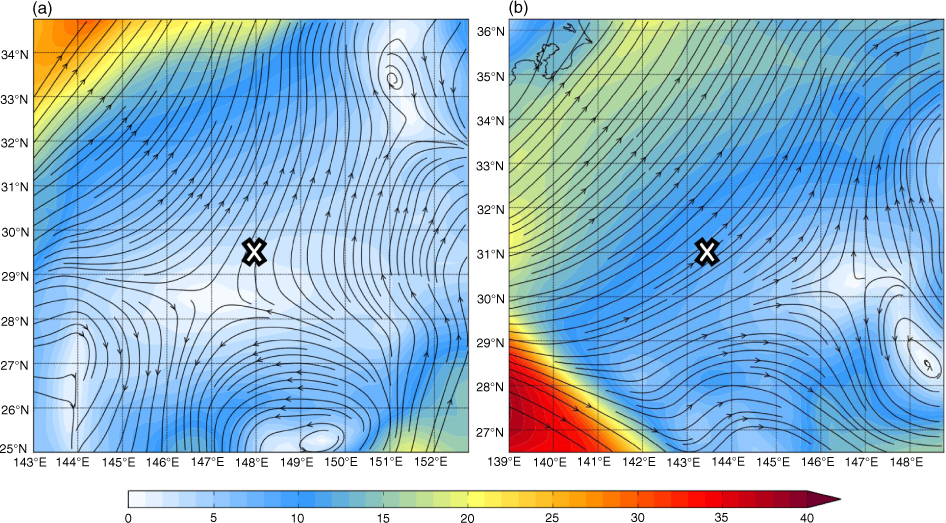
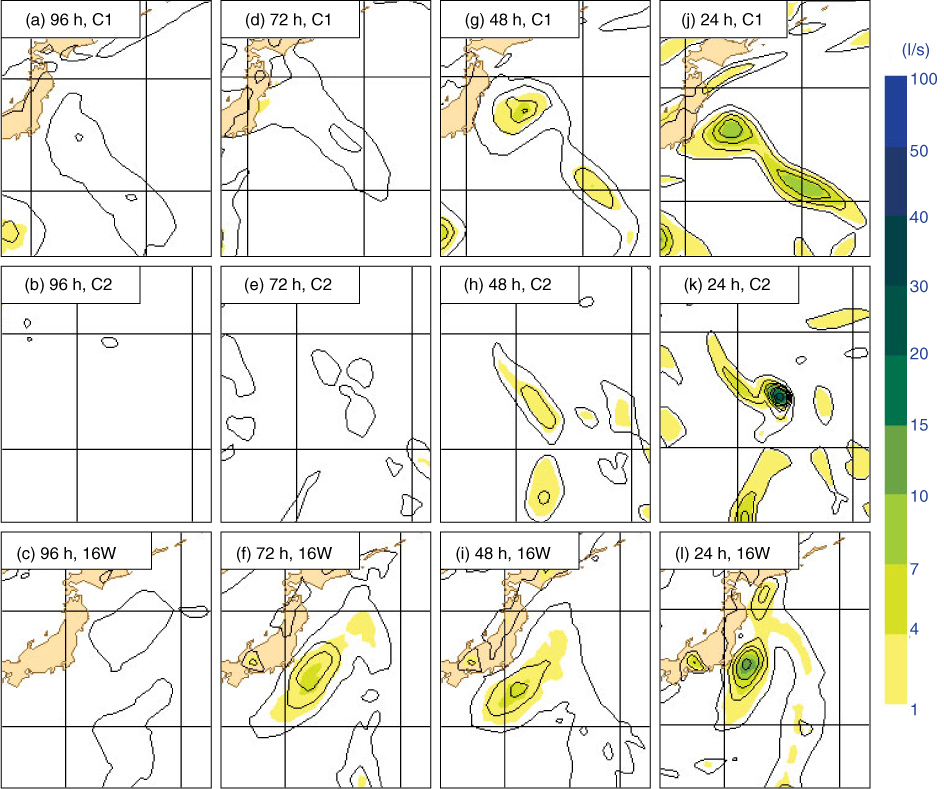
Fig. 19.
Ensemble mean vorticity (contour interval 10–5 s−1) and vorticity occurring in at least 75% of members (coloured as in Fig. 1). Top row: forecasts valid 00 UTC 31 August; middle row: forecasts valid 12 UTC 2 September; bottom row: forecasts valid 00 UTC 12 September.