Fig. 1.
Time evolution of the root mean square error (RMSE, solid line) and ensemble spread (SPREAD, dashed line) of the square root of the total energy norm (in m.s−1) with P ref=1000 hPa, T ref=300 K, C p and R α being the specific heat at constant pressure and the gas constant of dry air. Black lines: free-running (no assimilation performed) model ensemble forecasts; blue lines: ozone assimilation cycle; red lines: temperature assimilation cycle. Horizontal and vertical localisation length parameters (C h and C v ) are given in the legend.
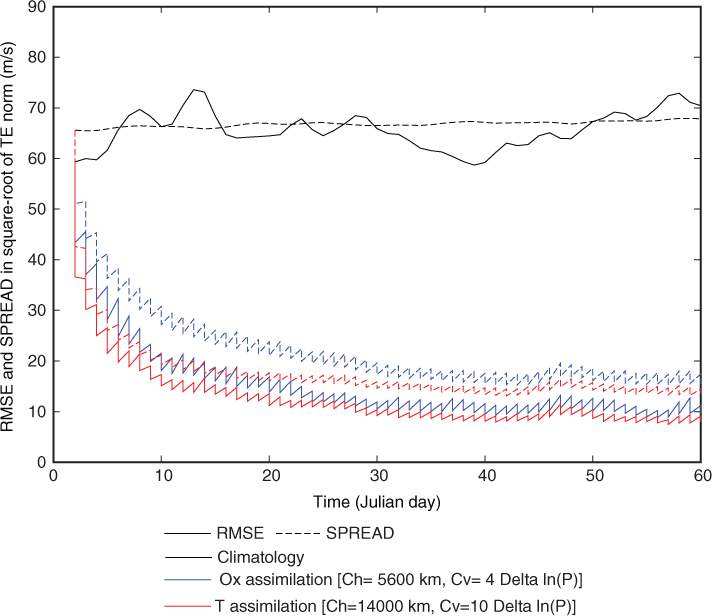
Fig. 2.
28-d time-averaged zonal-mean forecast root mean square error (RMSE) for zonal wind (top row, m.s−1), temperature (middle row, K) and ozone (bottom row, ppmv). Left and right columns show forecast RMSE from the EnKF MIPAS temperature and ozone assimilation experiments, respectively.
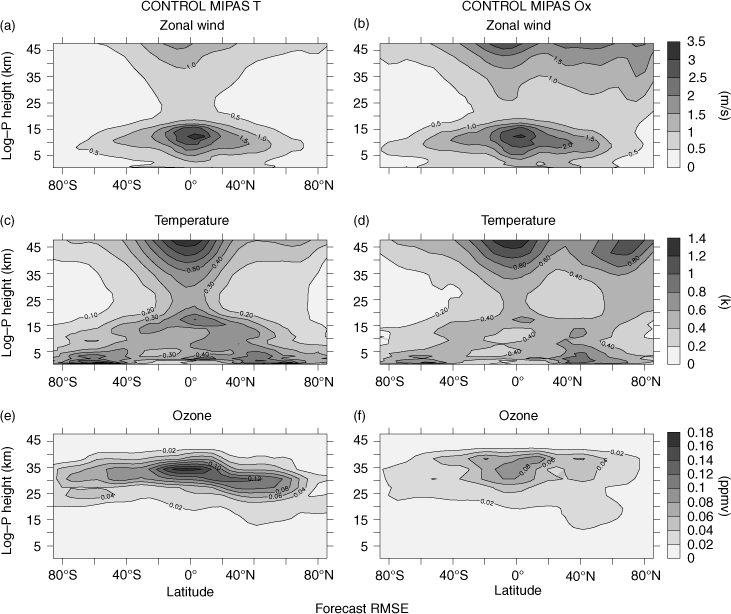
Fig. 3.
28-d average analysis minus forecast RMSE changes (in %) for EnKF MIPAS temperature assimilation (left column) and EnKF MIPAS ozone assimilation (right column). Top row: zonal mean zonal wind; middle row: zonal mean temperature; bottom row: zonal mean ozone. Zero line of RMSE changes contoured with solid black line. Purple (orange) colours indicate a reduction (increase) in RMSE.
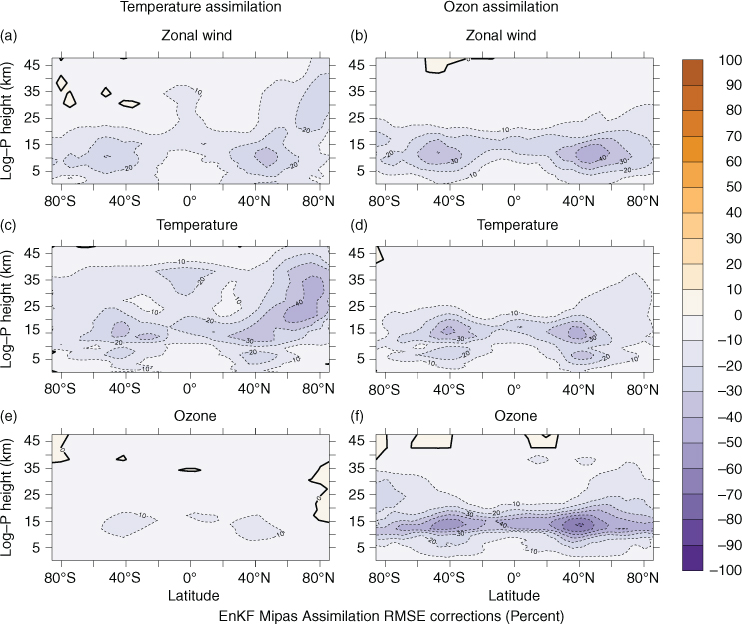
Fig. 4.
28 d average of zonal mean zonal wind analysis minus forecast RMSE changes (in %) for MIPAS ozone assimilation with (a) an EnKF, (b) an EnKS with 24-hour lag between observation and analysis time, (c) an EnKS with 48-hour lag. Purple (orange) colours indicate a reduction (increase) in RMSE.
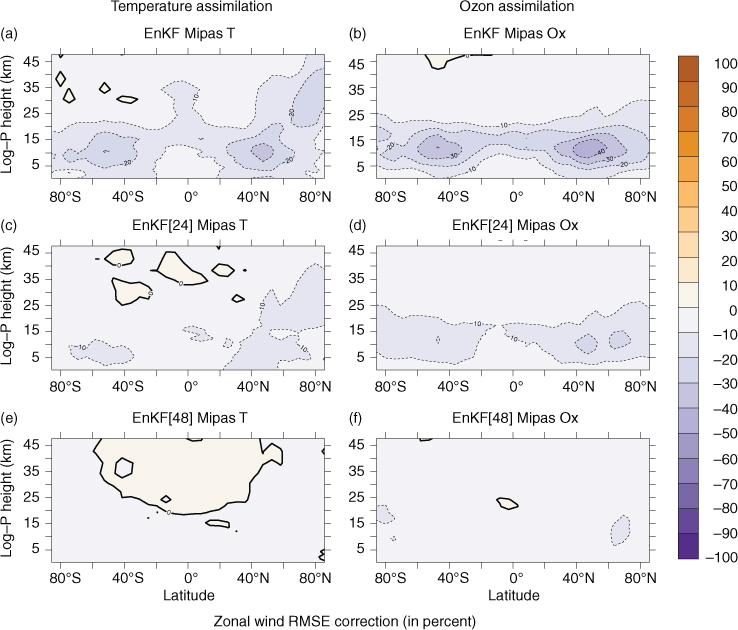
Fig. 5.
Zonal mean zonal wind (upper row), temperature (middle row) and ozone (bottom row) ΔRMSE differences (in %) between the EnKS MIPAS and the EnKF MIPAS (left column) and between the EnKF 3×MIPAS and the EnKF MIPAS (right column) for ozone assimilation. Purple (orange) colours indicate improvement (degradation) of the EnKS MIPAS or EnKF 3×MIPAS over the EnKF MIPAS. Statistically significant differences at the 95% confidence level are enclosed by the black lines.
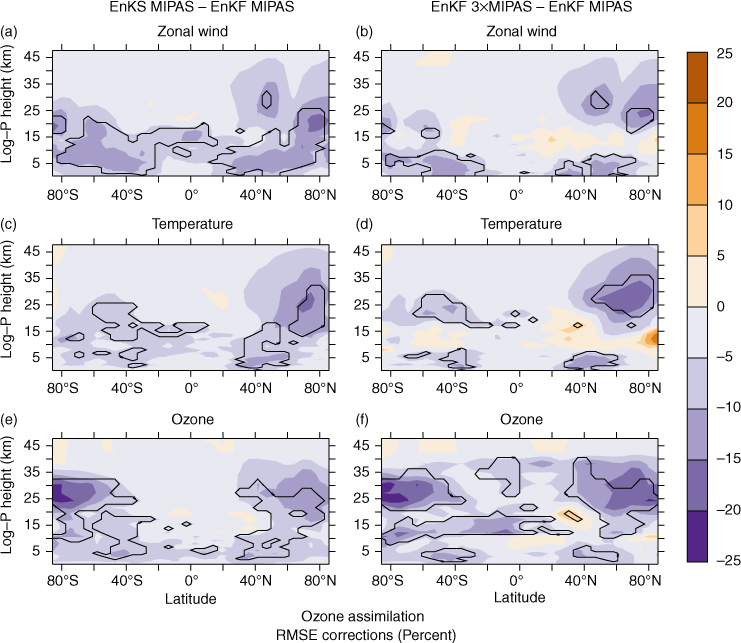
Fig. 6.
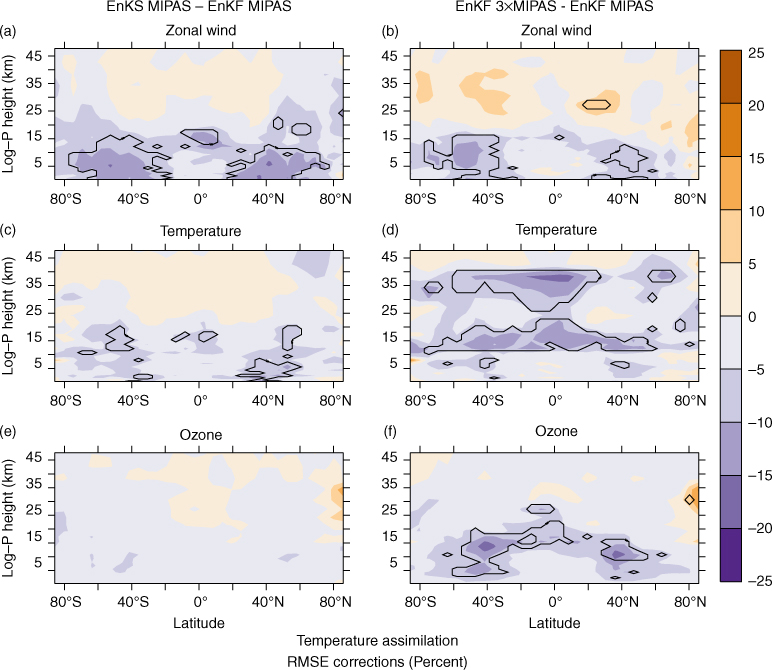
Same as Fig. 5 but for temperature assimilation.