
Fig. 1.
The simulated multiyear ice GR1836 versus the e50v (black) and e50h (grey). The best fit line to the e50v is: e50v=3.16GR1836+0.97 and for e50h: e50h=2.48GR1836+0.90. The dashed lines show the ±2%. The vertical grey lines indicate the tie-points for first- (F) and multiyear (M) ice, respectively.
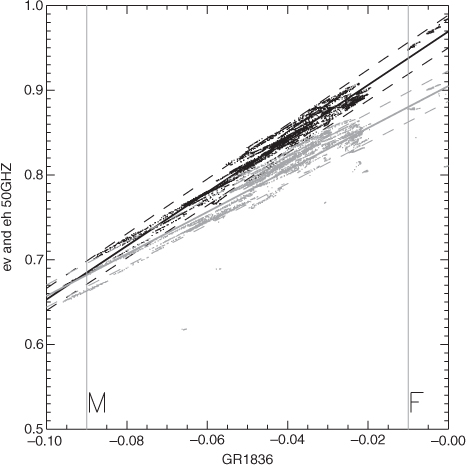
Fig. 2.
The simulated sea ice PR18 in red, PR36 in black and PR89 in green versus the PR50. The fitted line to the PR36 versus PR50 cluster is PR50=0.999PR36-0.004.
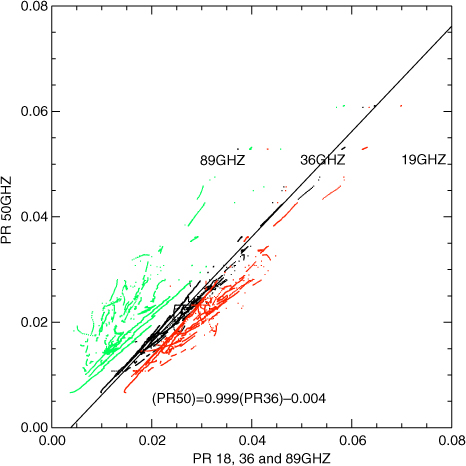
Fig. 3.
The nadir emissivity on 17 January 2012. The latitude is marked along the 0° longitude.
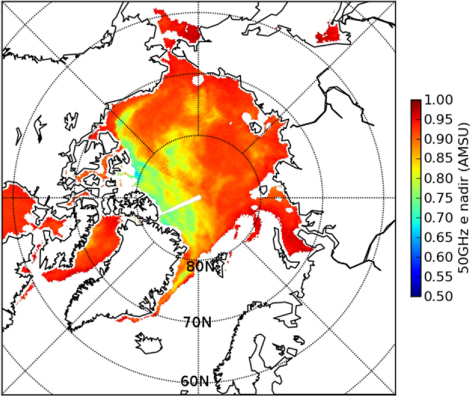
Fig. 4.
The R coefficient on 17 January 2012. The latitude is marked along the 0° longitude.
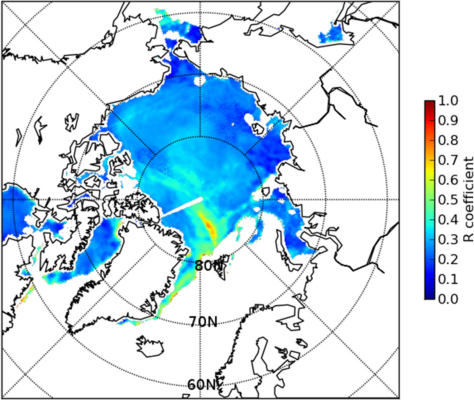
Fig. 5.
The nadir emissivity on 17 January 2012. The latitude is marked along the 180° longitude.
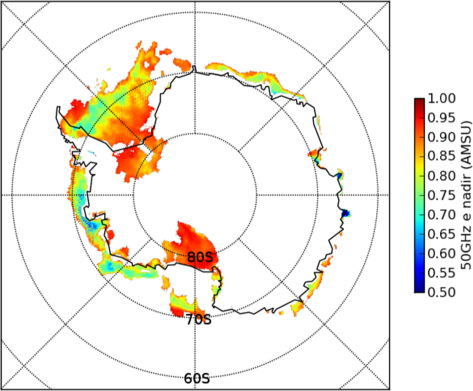
Fig. 6.
The R coefficient on 17 January 2012. The latitude is marked along the 180° longitude.
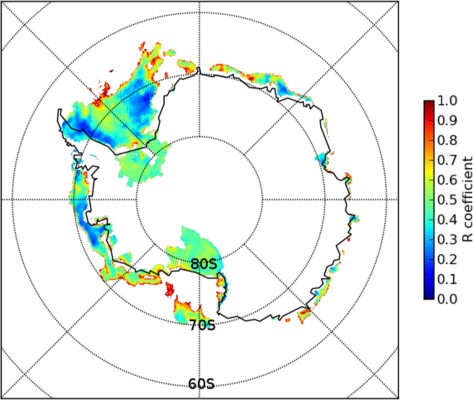
Fig. 7.
Comparison between predicted emissivities using (A) the tie-point model and the OSI SAF model; (B) the dynamical method and the OSI SAF model. The data are from the AMSU instrument on the NOAA-15 satellite.
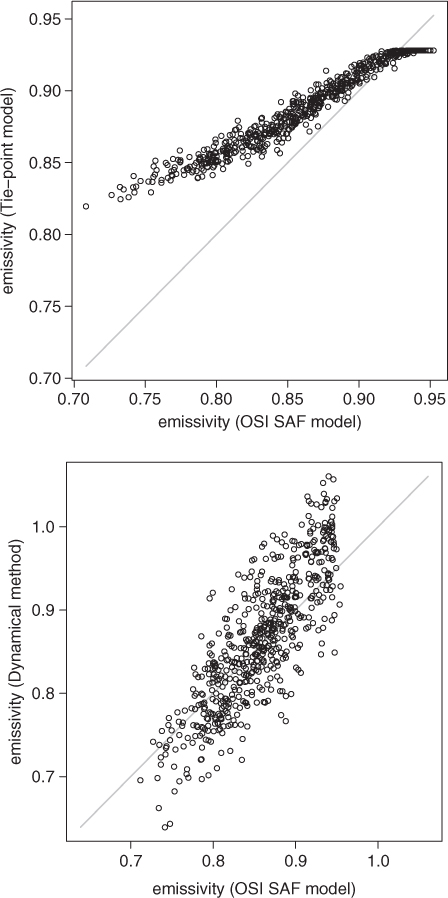
Fig. 8.
Map of mean emissivity difference between the OSI SAF method and the dynamic method (from NOAA-15 for the 2-month-period, 1 November to 31 December 2011). Latitude and longitude lines are shown for every 10° south of 80°N, and the −90 Meridian is vertical.
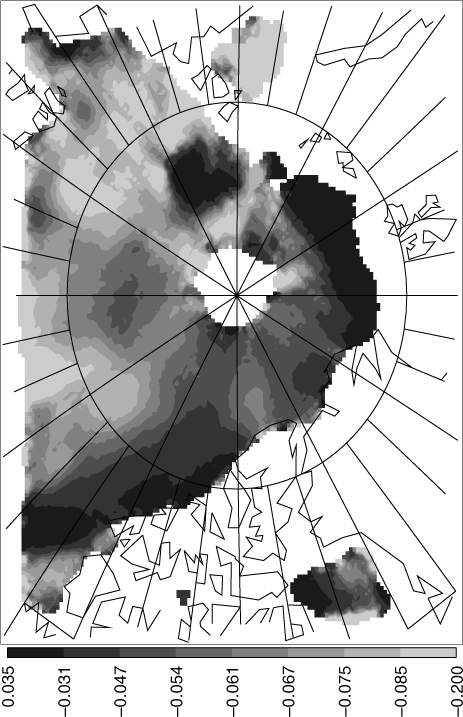
Fig. 9.
Comparison between emissivities calculated using the dynamical method using bias corrected brightness temperatures on the vertical axis (emissivity DYB) and calculations using raw uncorrected brightness temperatures on the horizontal axis (emissivity DYN). NOAA-15, period 1 November to 31 December 2011.
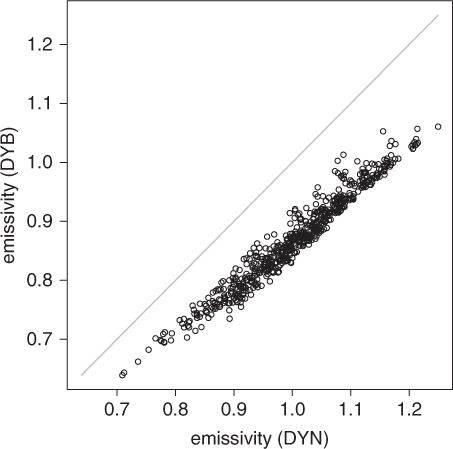
Fig. 10.
Map mean departure of observed minus simulated brightness temperatures [K] for channel 5 (from NOAA-15 for the 2-month period; 1 November to 31 December 2011). Latitude and longitude lines are shown for every 10° south of 80°N.
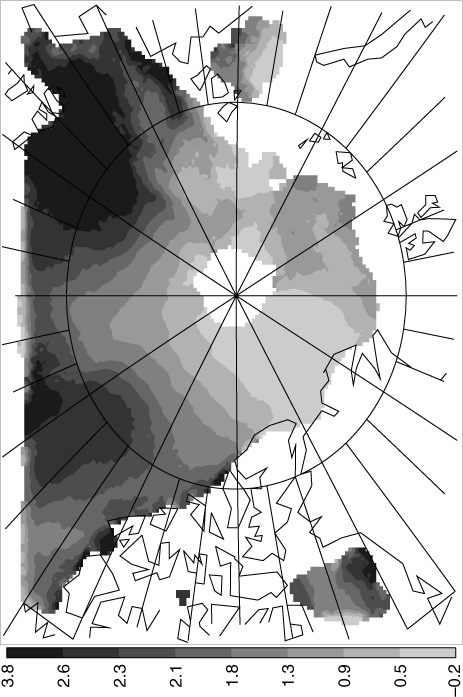
Fig. 11.
Map of standard deviations of departures of observed minus simulated brightness temperatures [K] for channel 5 (from NOAA-15 for the 2-month period; 1 November to 31 December 2011 as above). Latitude and longitude lines are shown for every 10° south of 80°N.
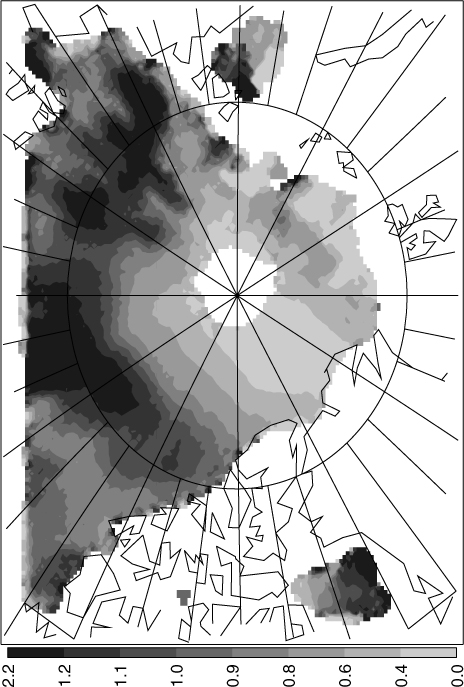
Fig. 12.
The measured and bias corrected AMSU-A channel 4 brightness temperatures (Tb [K] observation) versus the brightness temperature predicted with (A) RTTOV-8 and the OSI SAF model (Tb [K] simulation – OSI SAF); (B) RTTOV-8 and the tie-point model (Tb [K] simulation-tie-point). Bias correction was done towards modelled data applying the OSI SAF model.
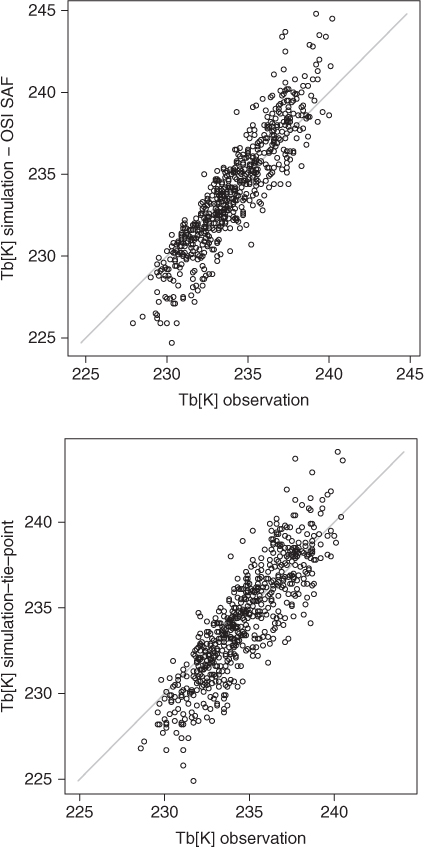
Table 1. Standard deviation of departures [K] between the simulated AMSU-A measurements using the tie-point and the OSI SAF emissivity models and bias corrected observations
[i] The two columns to the left are for NOAA-15, the two to the right for NOAA-16. Note that channel 4 on NOAA 16 is not operational.
Table 2. Standard deviation of departures in [K] between the simulated AMSU-A measurements with the OSI SAF emissivity model and bias corrected observations
[i] The two columns to the left are for NOAA-15, the two to the right for NOAA-16. Note that channel 4 on NOAA 16 is not operational.