
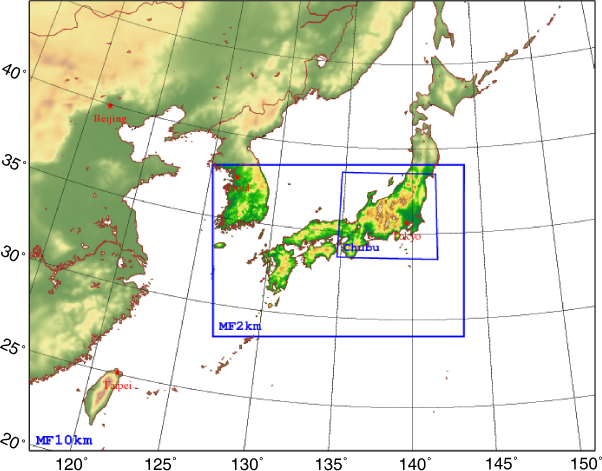
Fig. 1
Forecast domains of MF10km and MF2km. The rectangle inside MF2km domain denotes the verification area.
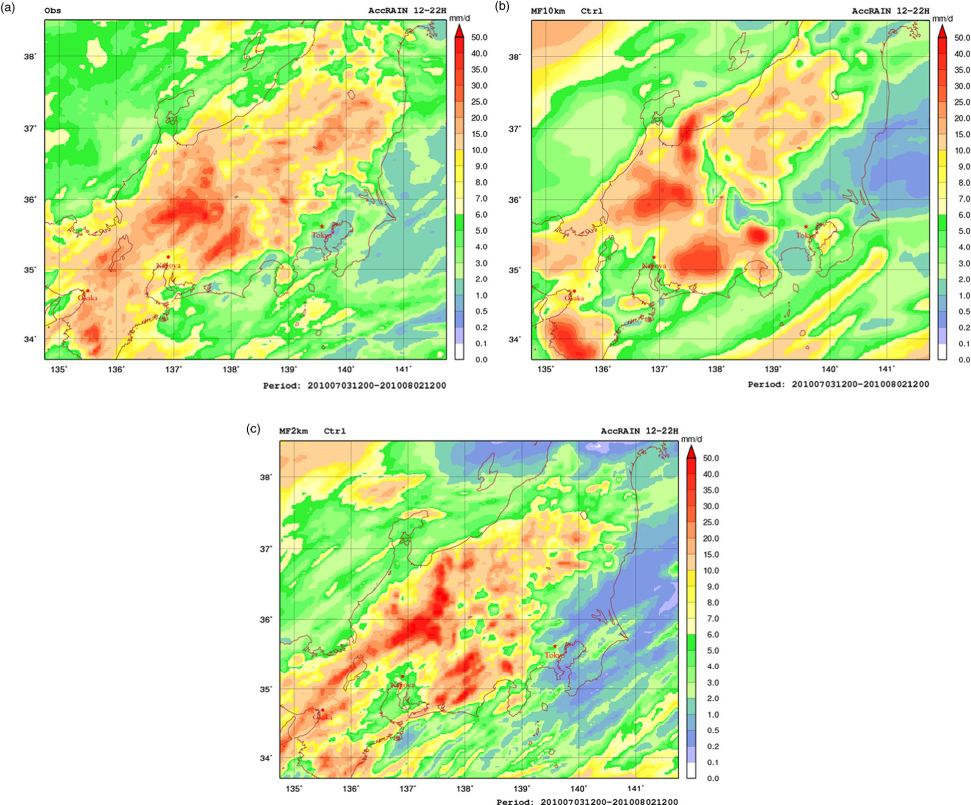
Fig. 2
Rainfall analysis by R/A (upper-left) and corresponding control forecasts by MF10km (upper-right) and MF2km (lower-left) in the verification period over central Japan. Rainfalls were accumulated between 12-hour and 22-hour forecast ranges and the average rain rates (unit mm d−1) are shown in the plot.
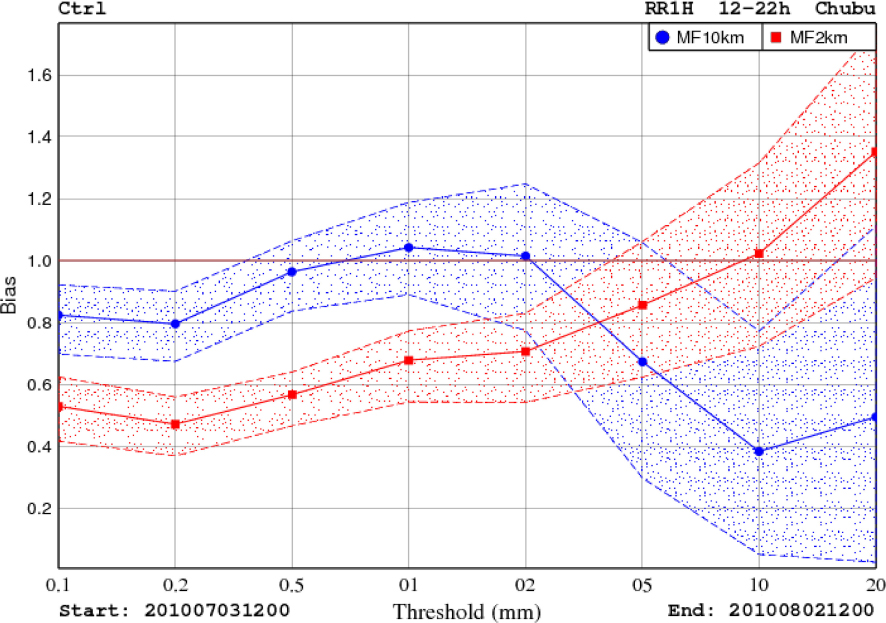
Fig. 3
Frequency bias of hourly precipitation forecasts from MF10km and MF2km control runs in July 2010. The shaded areas are the 95% confidence intervals.
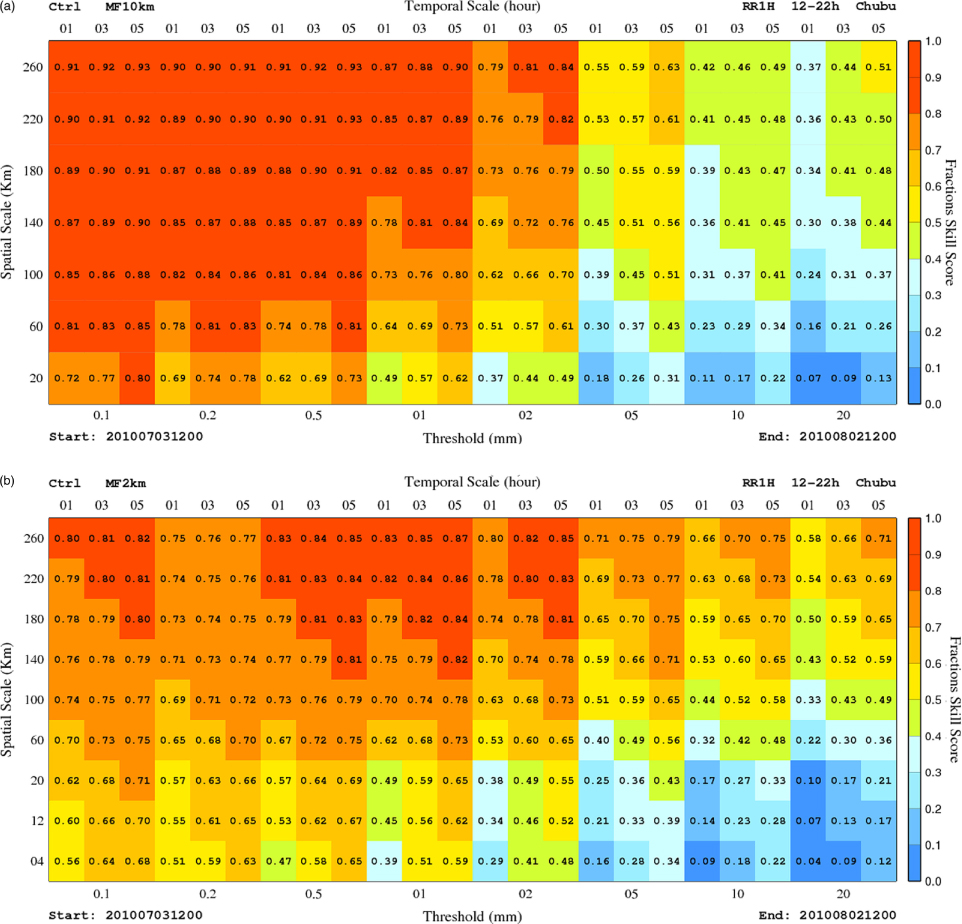
Fig. 4
Intensity-scale diagrams with temporal scales incorporated from the control forecasts of MF10km (top) and MF2km (bottom).
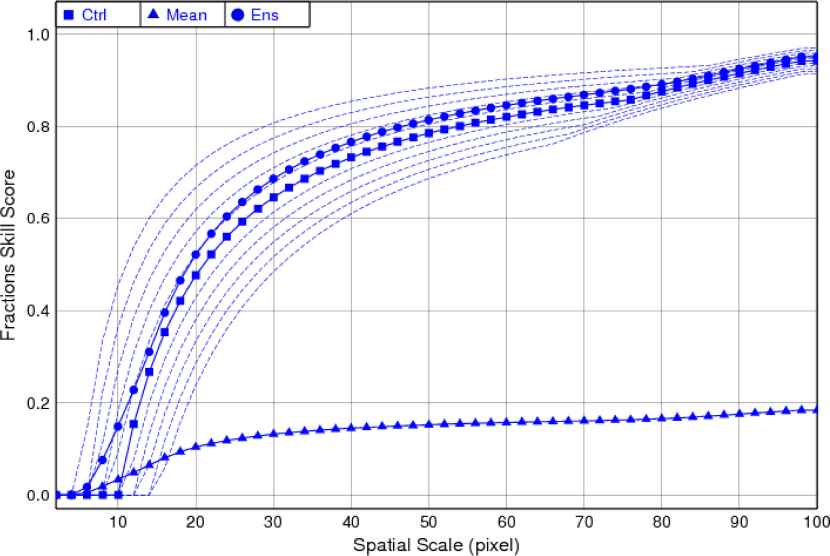
Fig. 5
Ensemble FSS (circle symbol), control FSS (square symbol), ensemble mean FSS (triangular symbol) and FSSs from other ensemble members (dash lines) against spatial scales in the idealised experiment.
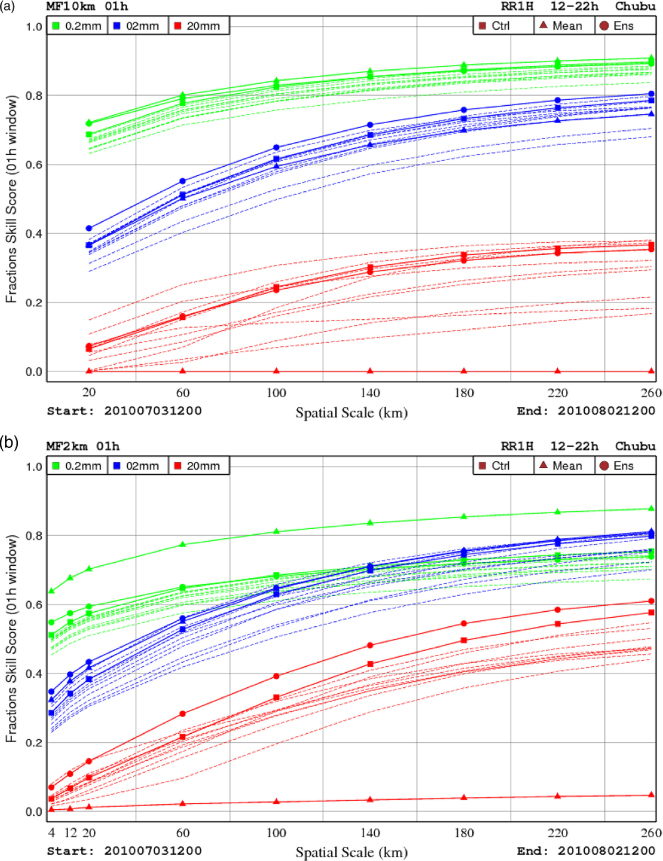
Fig. 6
Same as Fig. 5 but in real cases with MF10km (top) and MF2km (bottom) forecasts in July 2010. The green, blue and red colours represent the rainfall threshold of 0.2, 2, and 20 mm h−1, respectively.
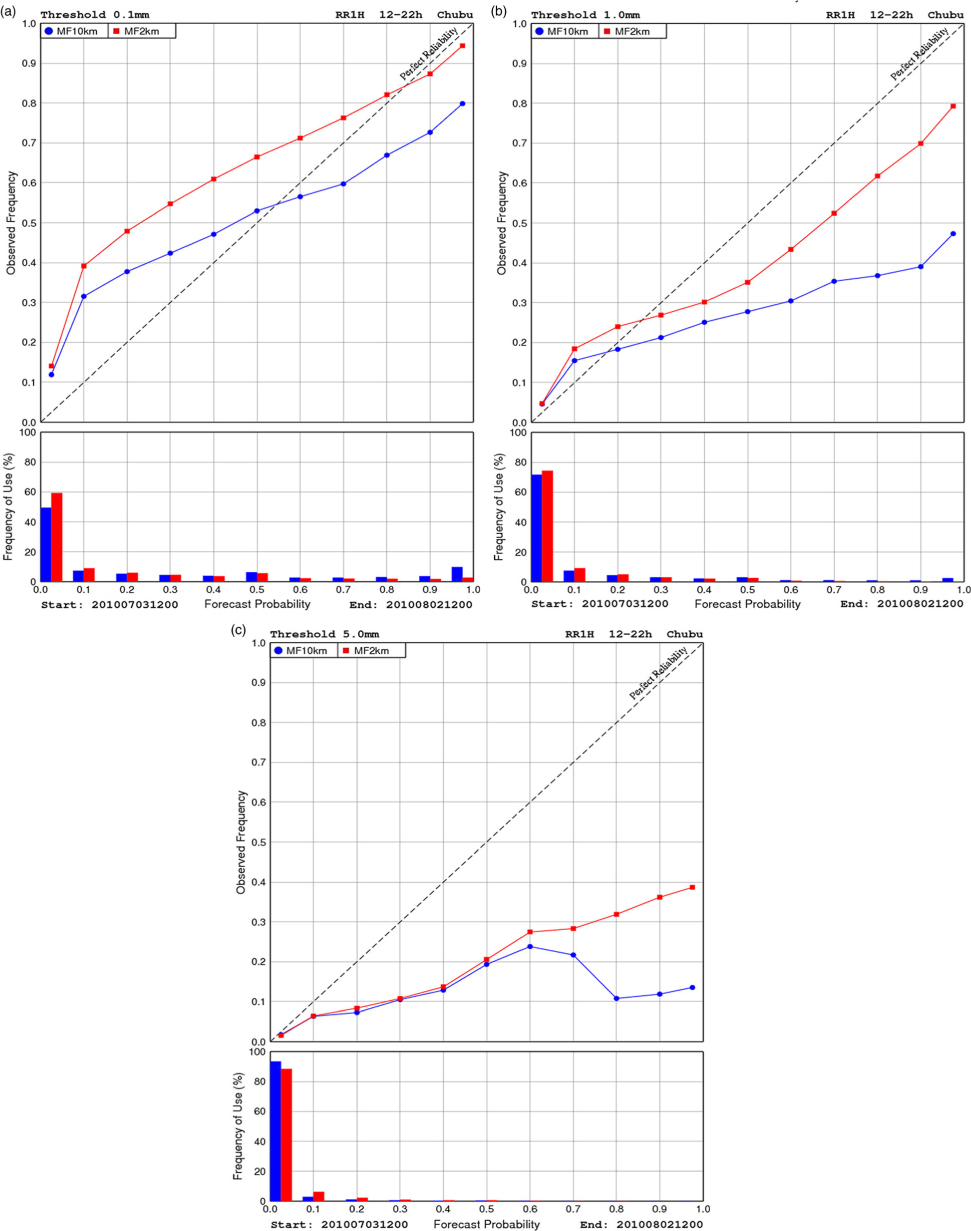
Fig. 7
Reliability diagrams at grid point scales of hourly precipitation forecasts from MF10km and MF2km in July 2010 with the rainfall threshold of 0.1 mm h−1 (upper left), 1.0 mm h−1 (upper right) and 5 mm h−1 (lower left). The sharpness diagram is shown below each reliability diagram.
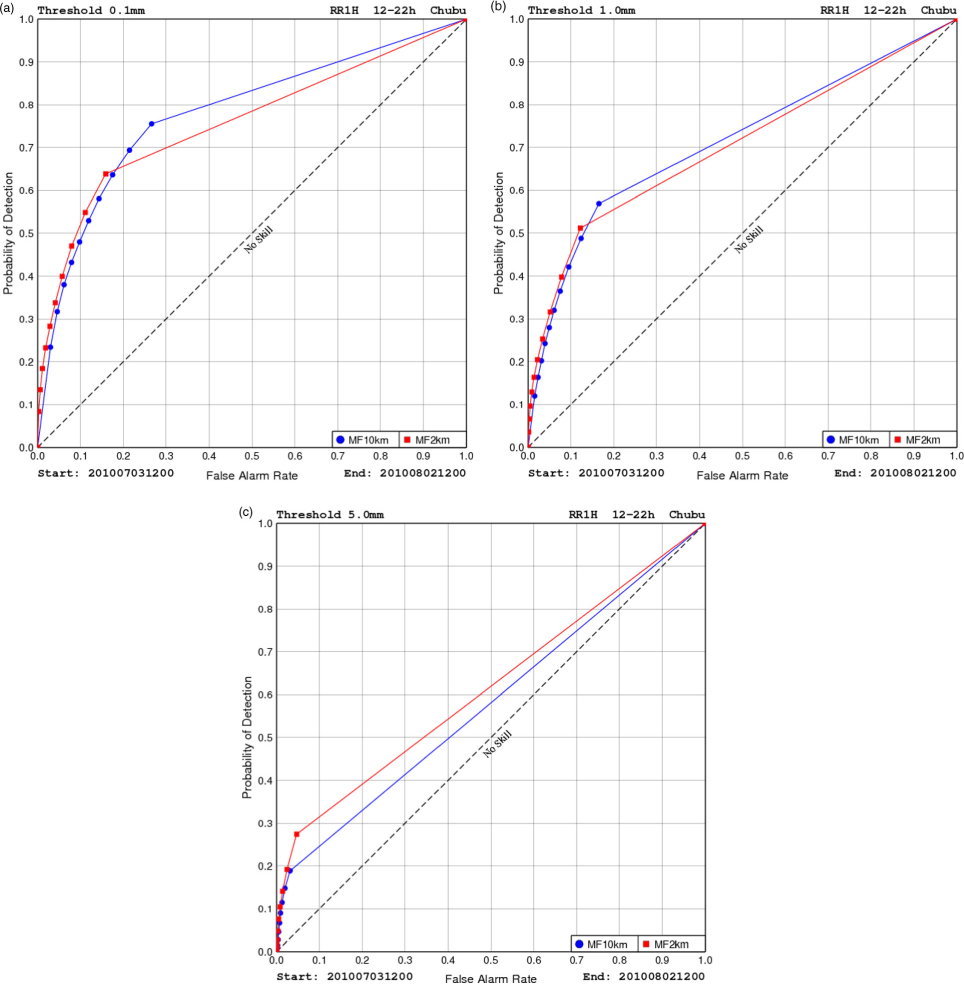
Fig. 8
ROC diagrams at grid point scales of hourly precipitation forecasts from MF10km and MF2km in July 2010 with the rainfall threshold of 0.1 mm h−1 (upper left), 1.0 mm h−1 (upper right) and 5 mm h−1 (lower left).
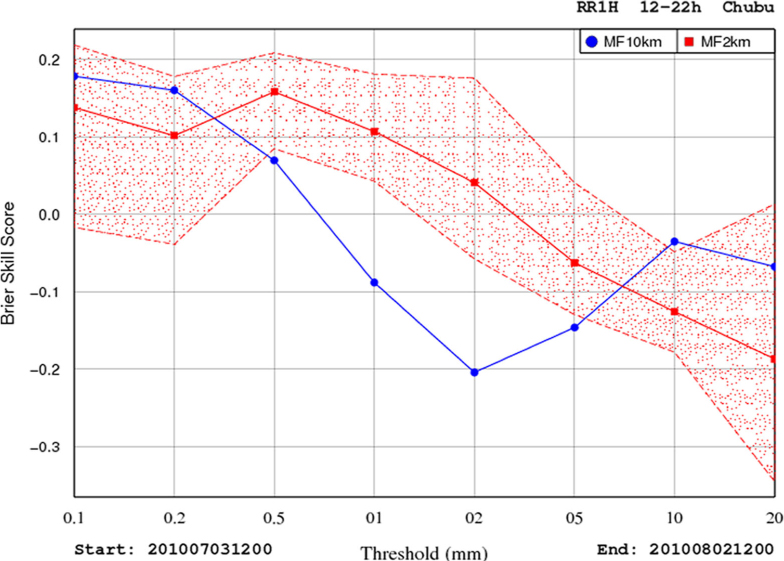
Fig. 9
BSS of hourly precipitation forecasts from MF10km and MF2km in July 2010. The shaded area is the 95% confidence interval for the differences centred to the BSS curve of MF2km.
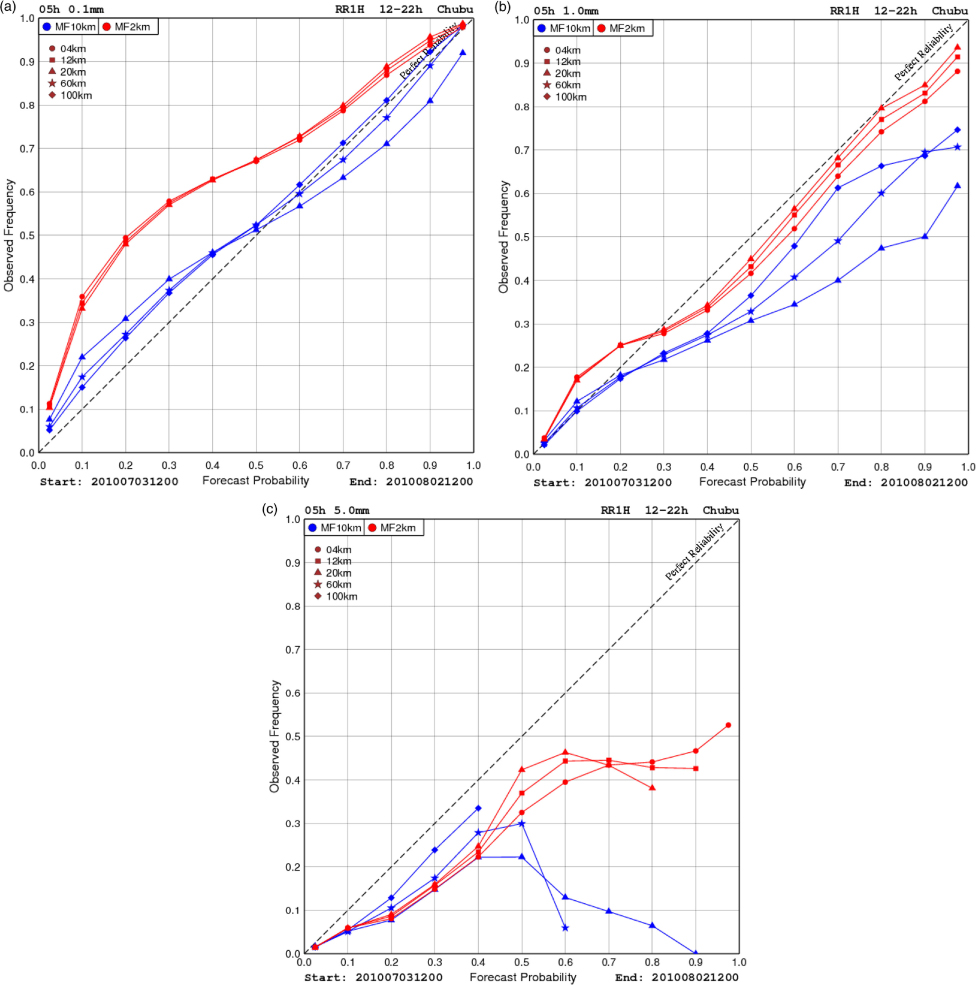
Fig. 10
Same as Fig. 7 but for temporal scale of 5 hours and spatial scales of 4, 12, 20, 60 and 100 km.
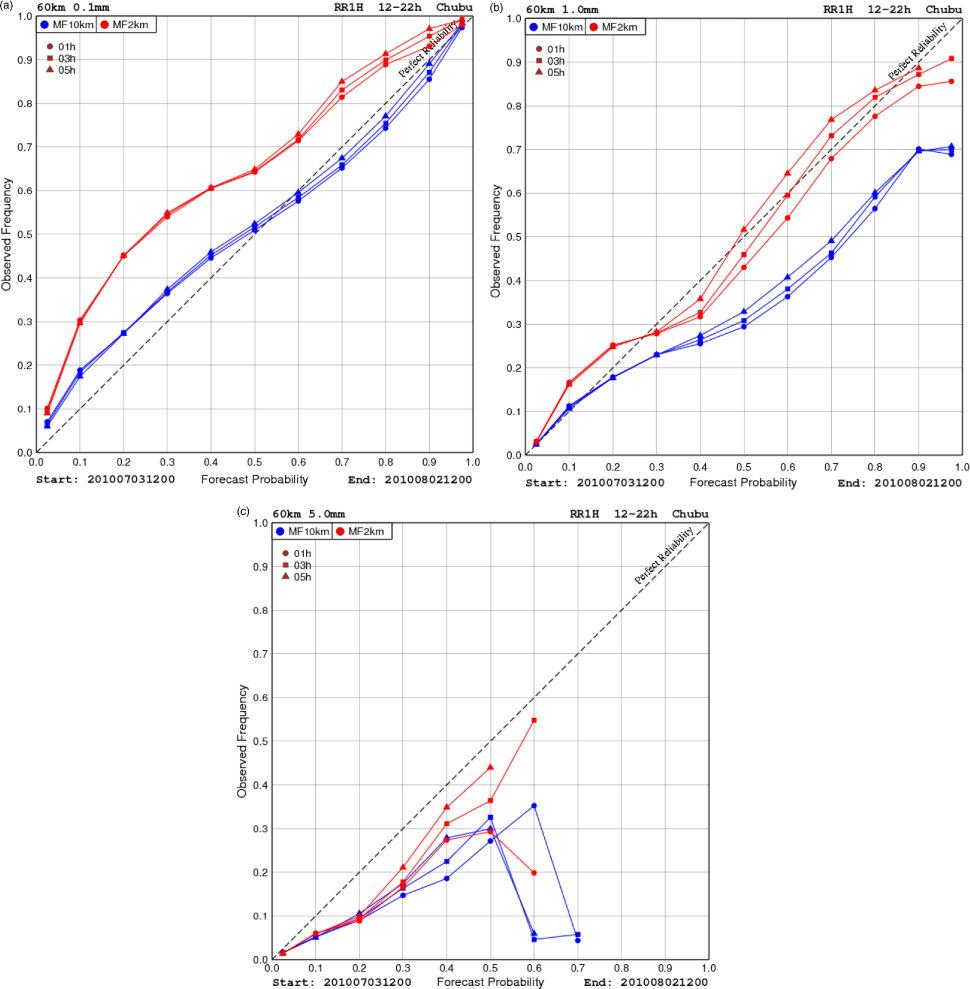
Fig. 11
Same as Fig. 7 but for spatial scale of 60 km and temporal scales from 1 to 5 hours.
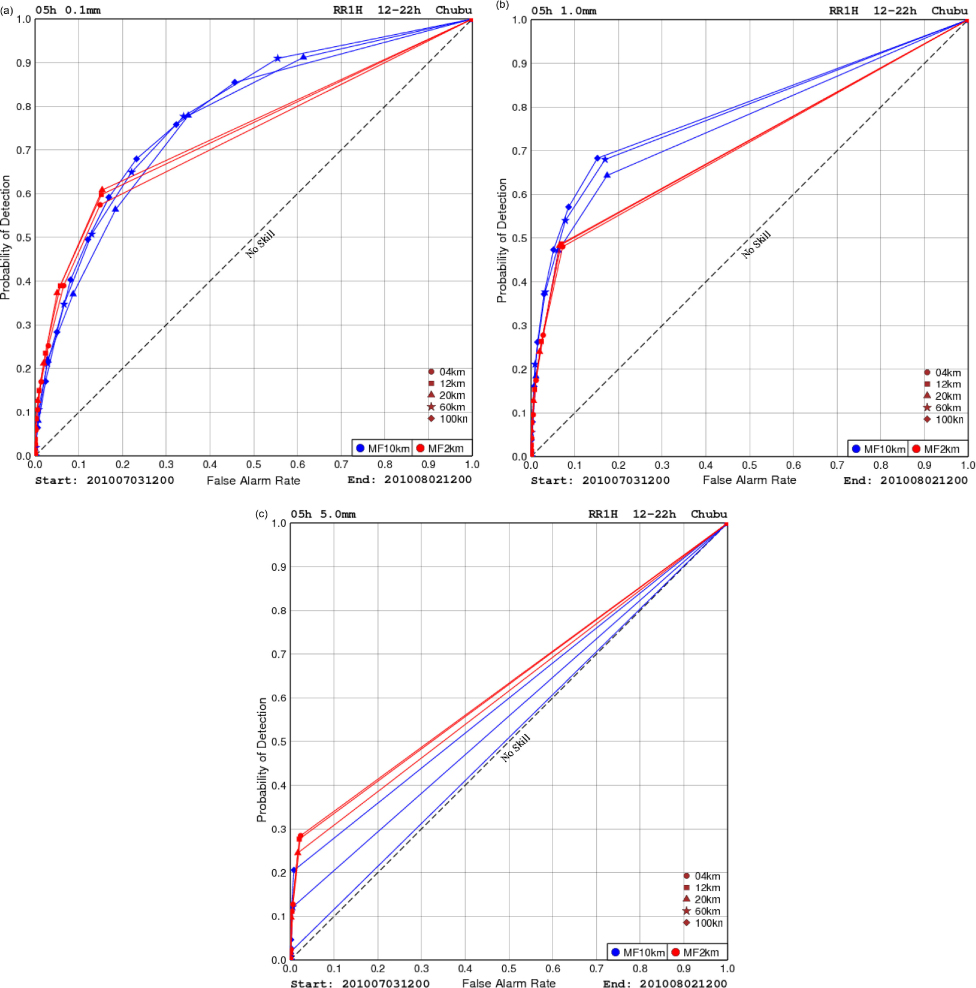
Fig. 12
Same as Fig. 8 but for temporal scale of 5 hours and spatial scales of 4, 12, 20, 60 and 100km.
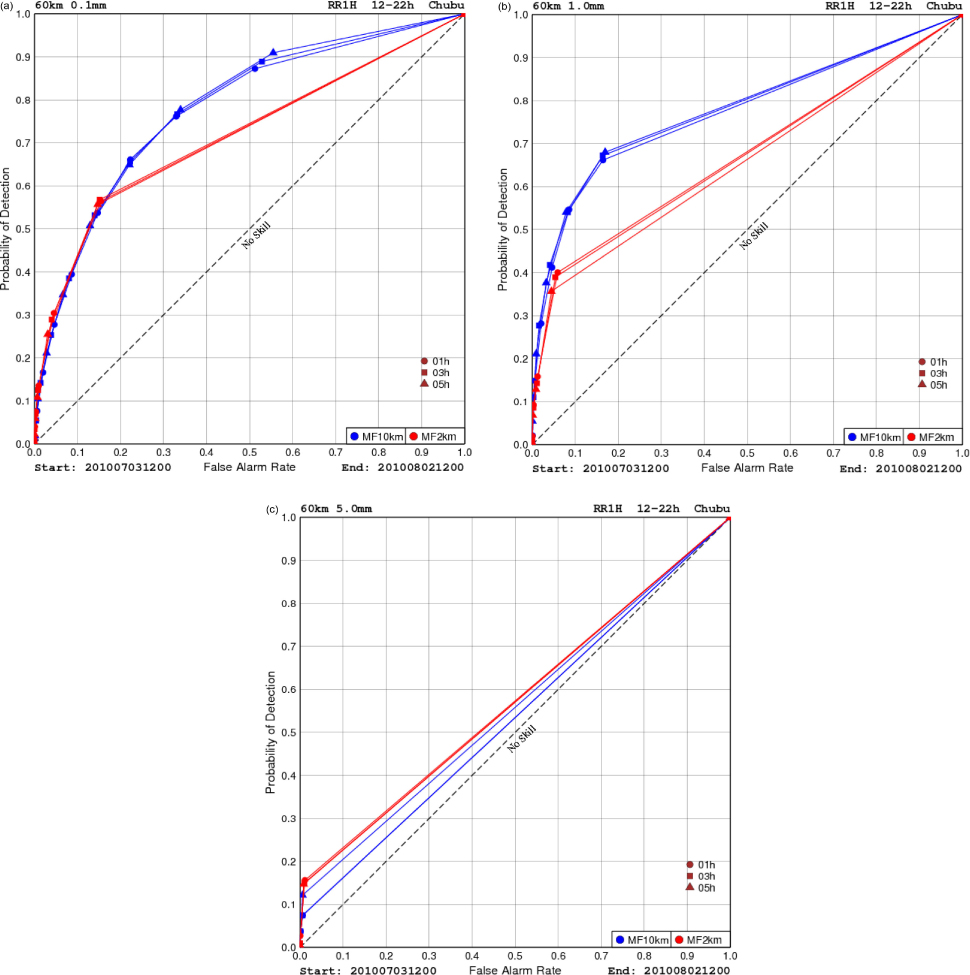
Fig. 13
Same as Fig. 8 but for spatial scale of 60 km and temporal scales from 1 to 5 hours.
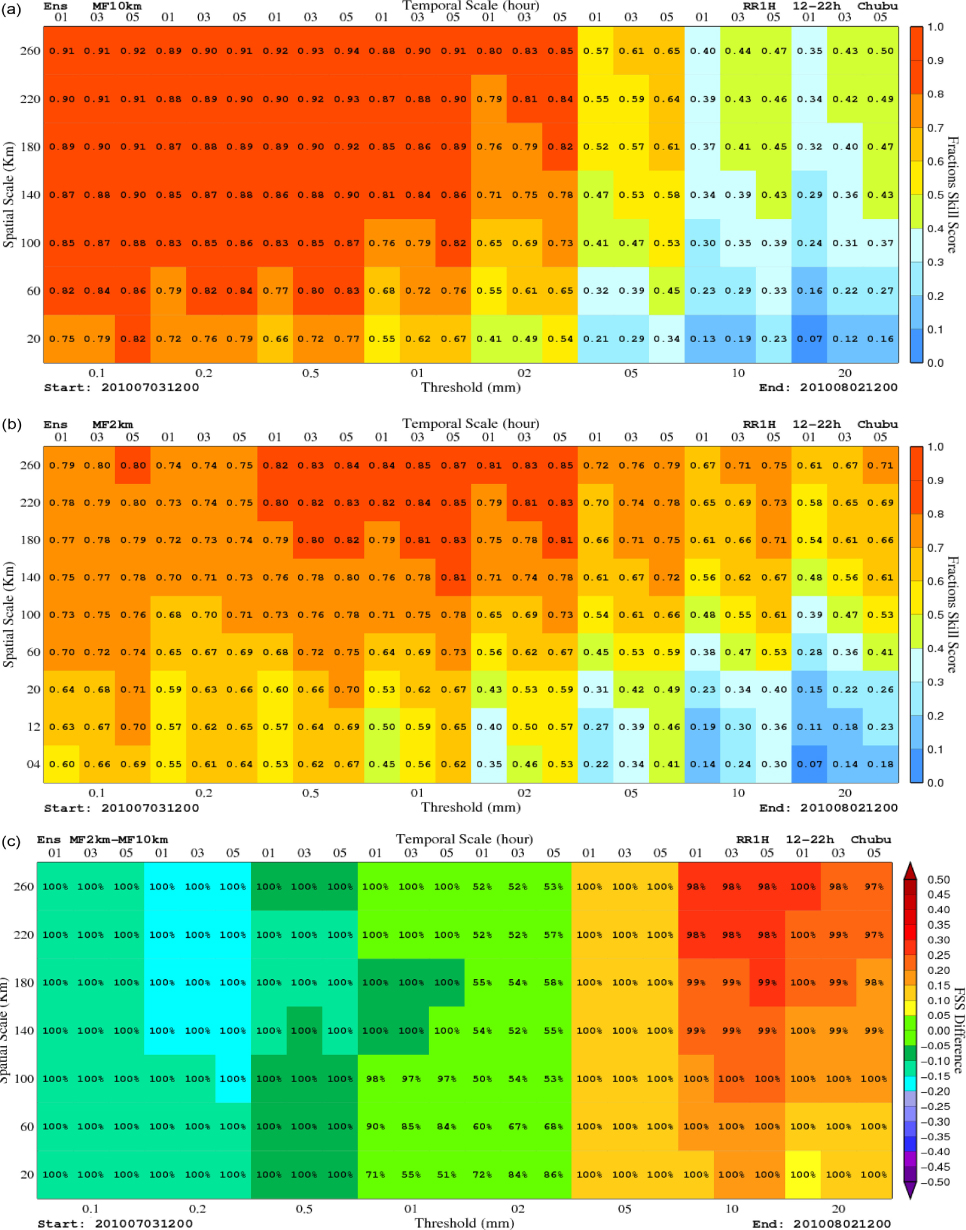
Fig. 14
Extended intensity-scale diagrams showing FSSs from MF10km (top) and MF2km (centre) hourly precipitation forecasts and their differences (bottom). The small number inside each box indicates the confidence level saying the difference value is significantly greater than zero.