Table 1. Overview of the 8 ET events, the periods during which they were investigated, the consequential number of denial cases, that is, analysis times from which all the forecasts are started, and the ET times
Fig. 1.
ECMWF analysis of the 500 hPa geopotential (shaded), mean sea-level pressure (contours, contour interval is 5 hPa) for a) Cristobal, b) Fabian, c) Irene, d) Maria, e) Florence, f) Helene, g) Bertha and h) Bill after the formation of a downstream trough. The position of SV1 at the respective analysis time is marked by black dots. Each ET system is centred in a white rectangular box.
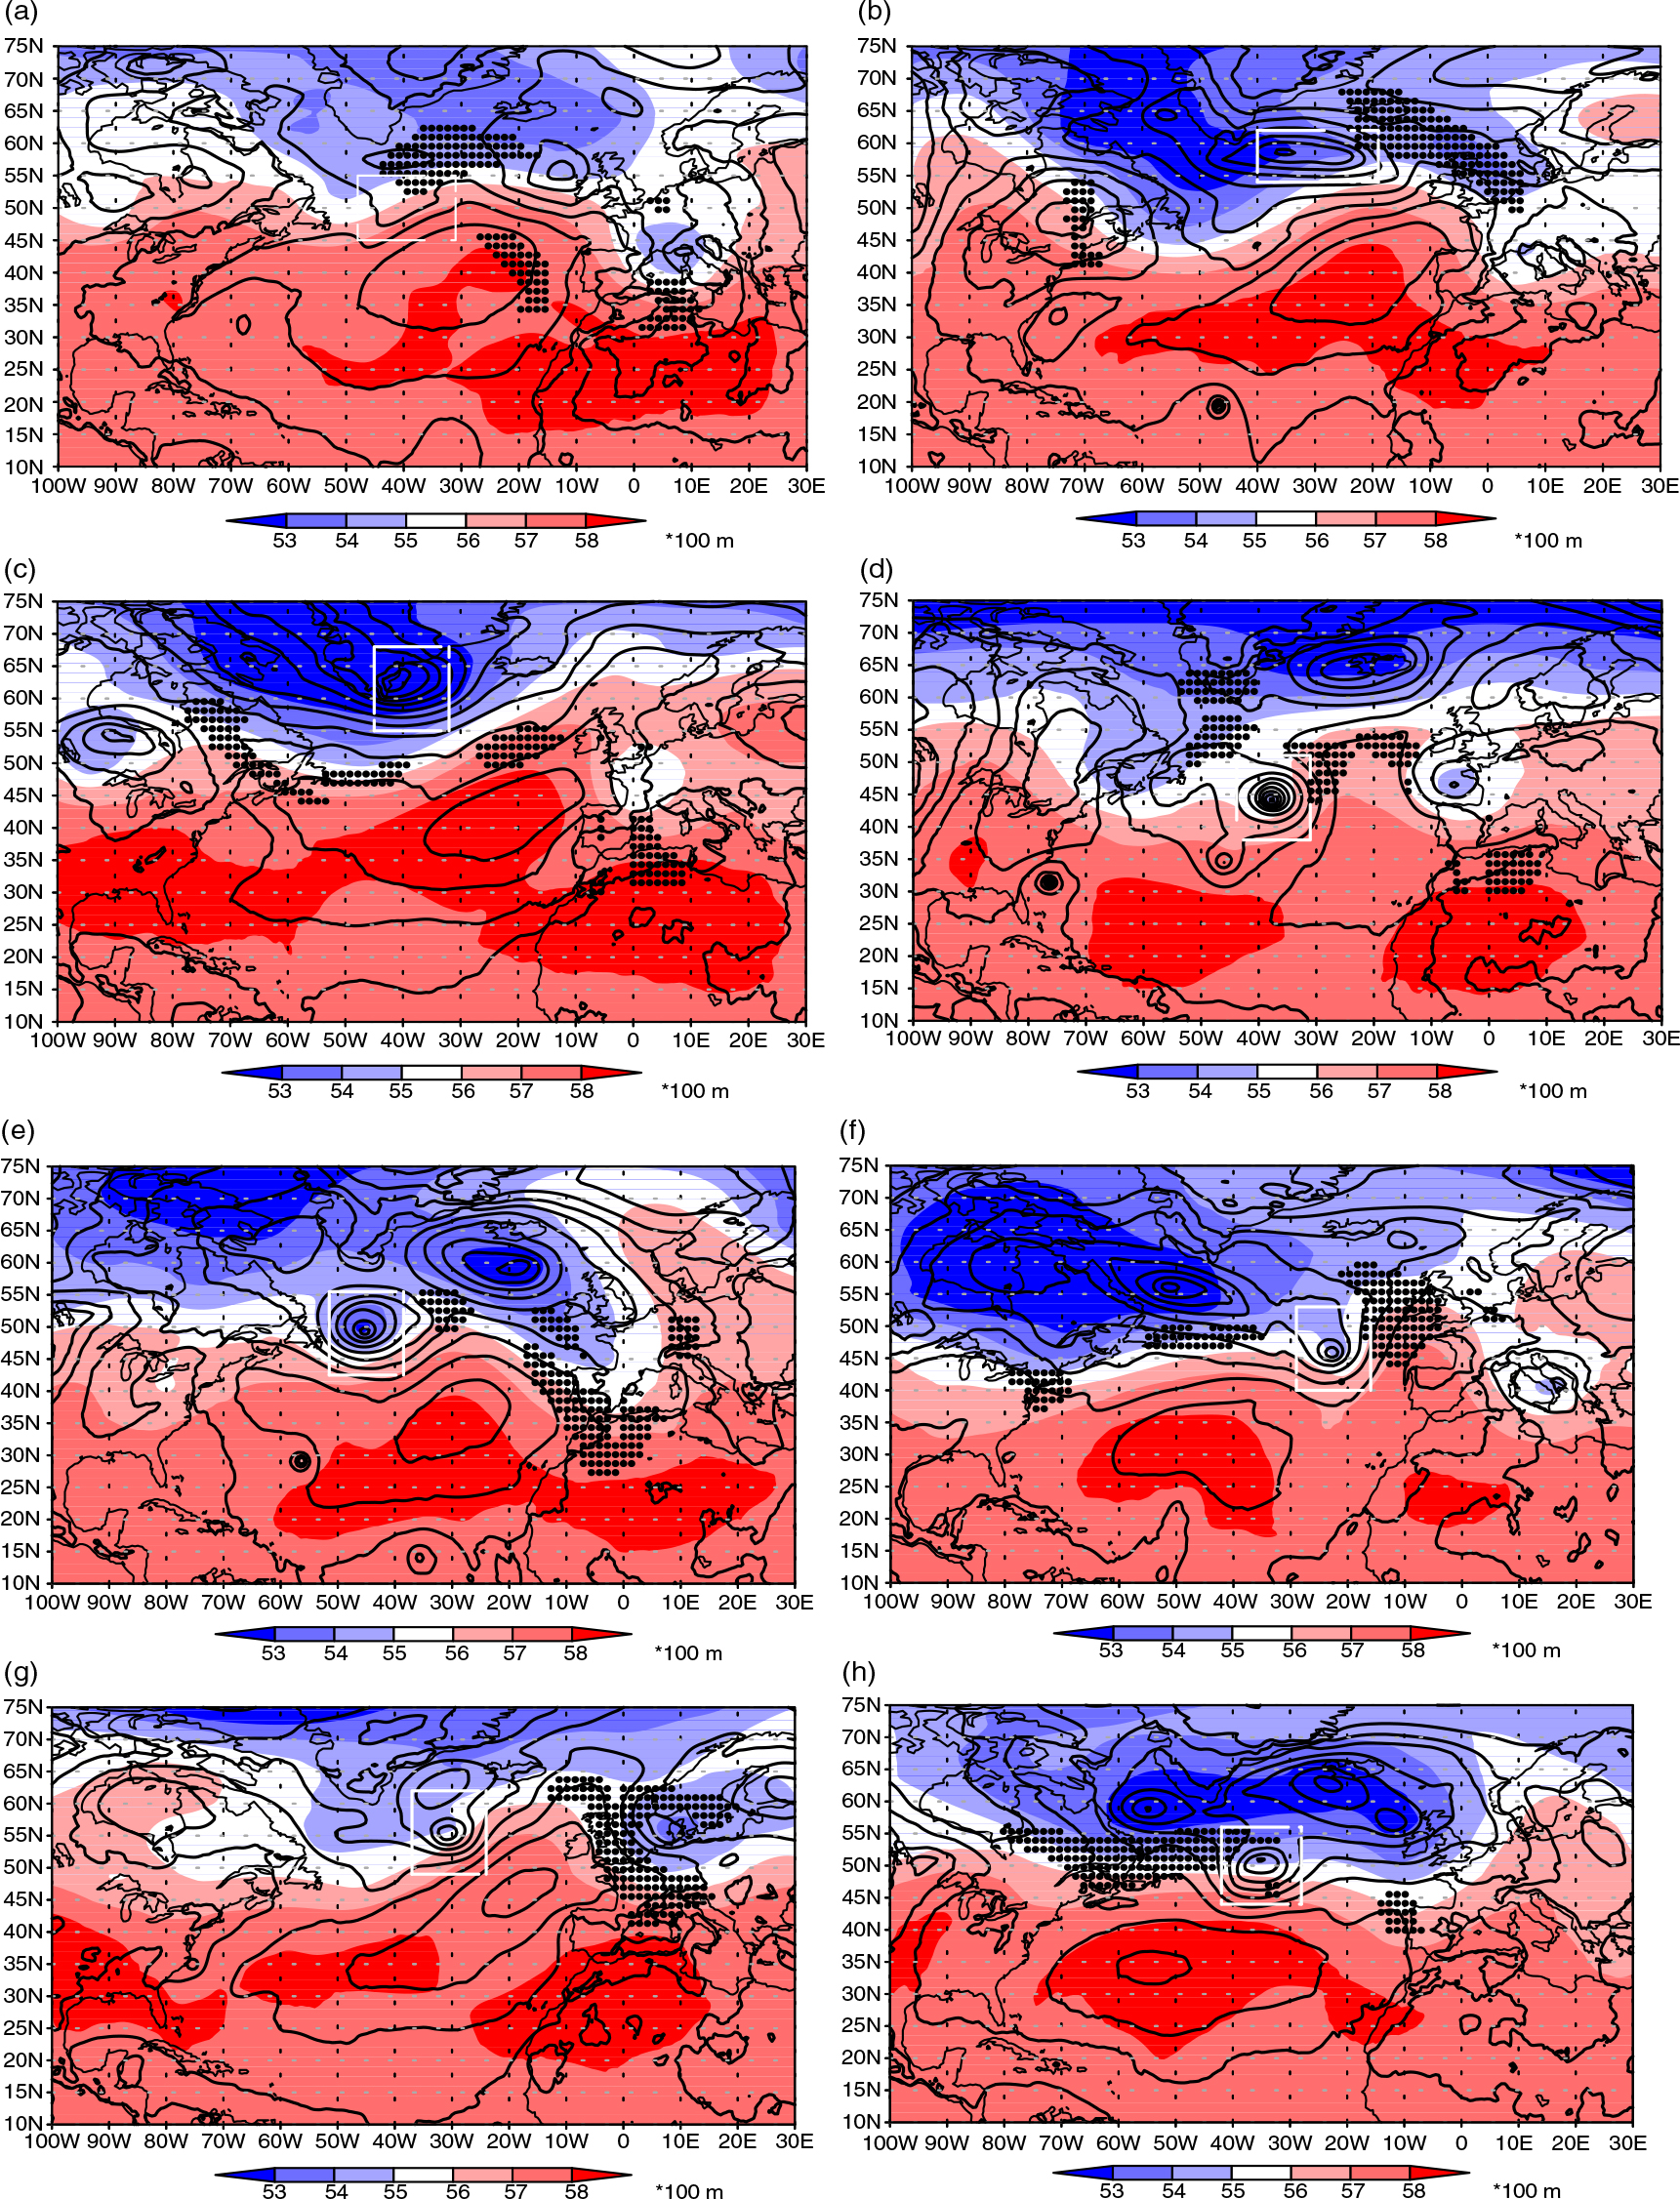
Fig. 2.
a) Percentage and b) total (not normalised by RMSE (Ctrl)) RMSE difference averaged over all denial cases in total energy (m2/s2) between Ctrl and ETout (red) and between Ctrl and SVout (blue) over Europe for all forecast lead times from 12 to 120 h in 12-h steps. In a) both experiments are normalised by the RMSE of Ctrl.
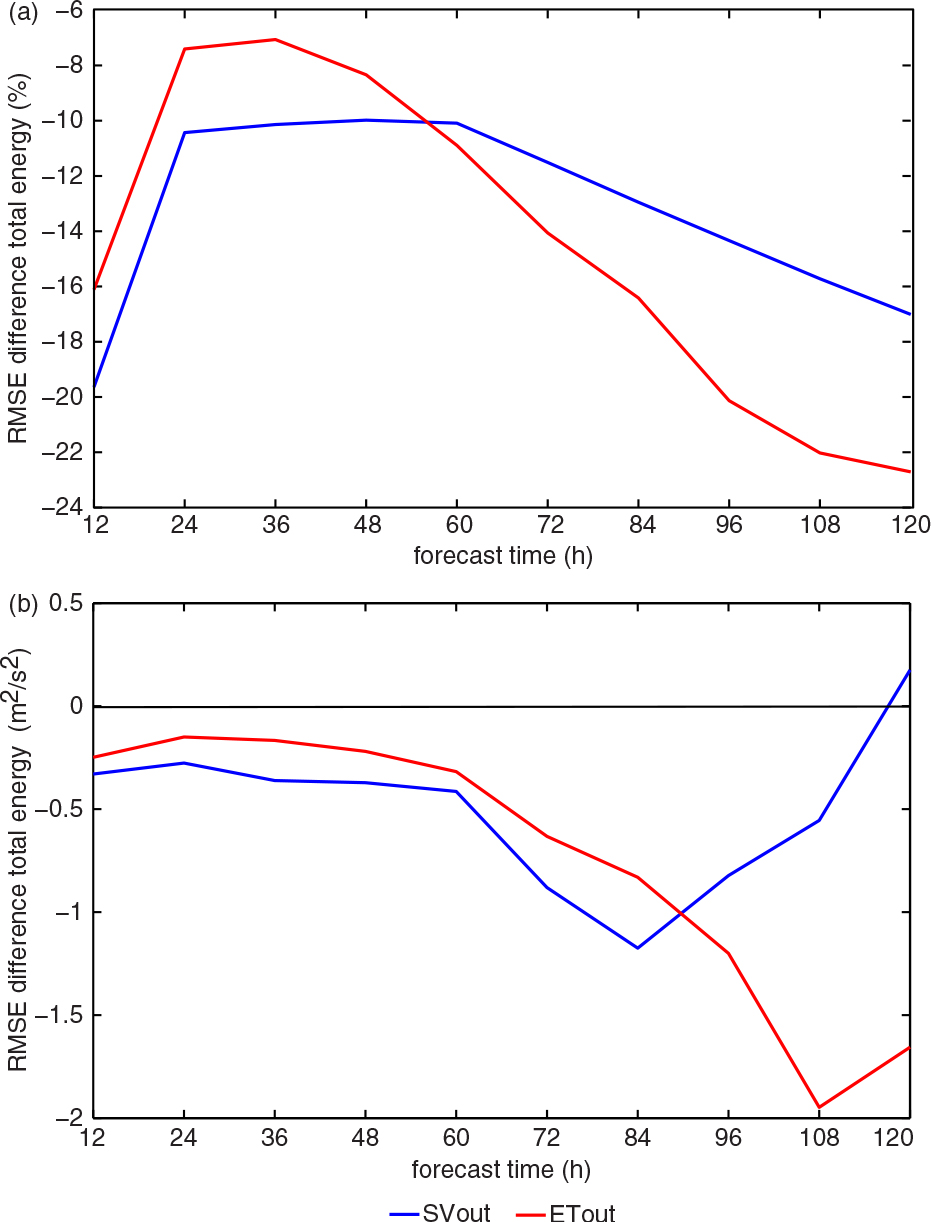
Fig. 3.
As Fig. 2 separated for denial cases a) before and b) after the TC completed ET.
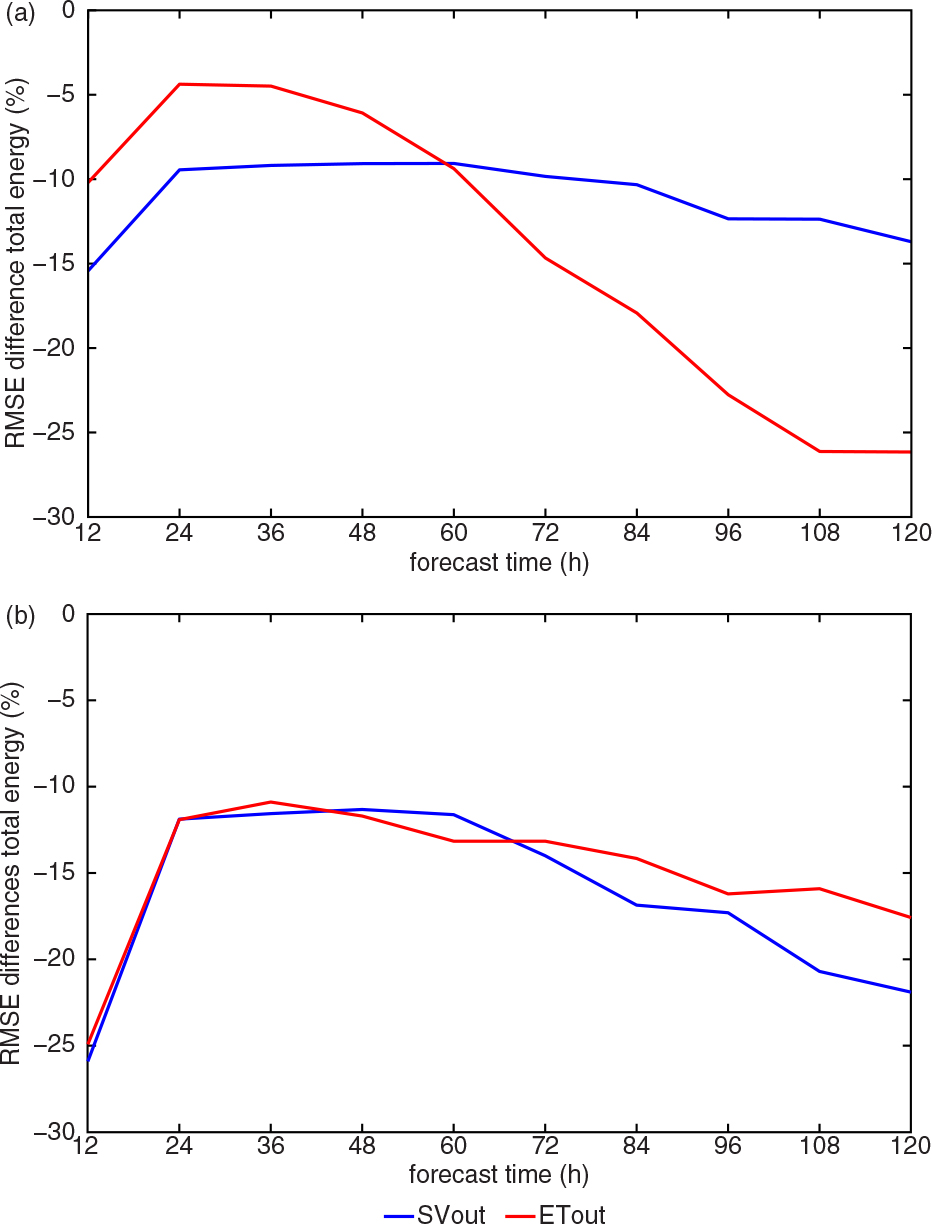
Fig. 4.
Cumulative distribution functions (CDF) of forecast impacts at the 24-h (black), 48-h (blue), 72-h (green), 96-h(red) and 120-h (magenta) forecast steps in a) ETout and b) SVout. The fraction of denial cases (Table 1) is given on the y-axis. On the x-axis the forecast impact is shown in percent.
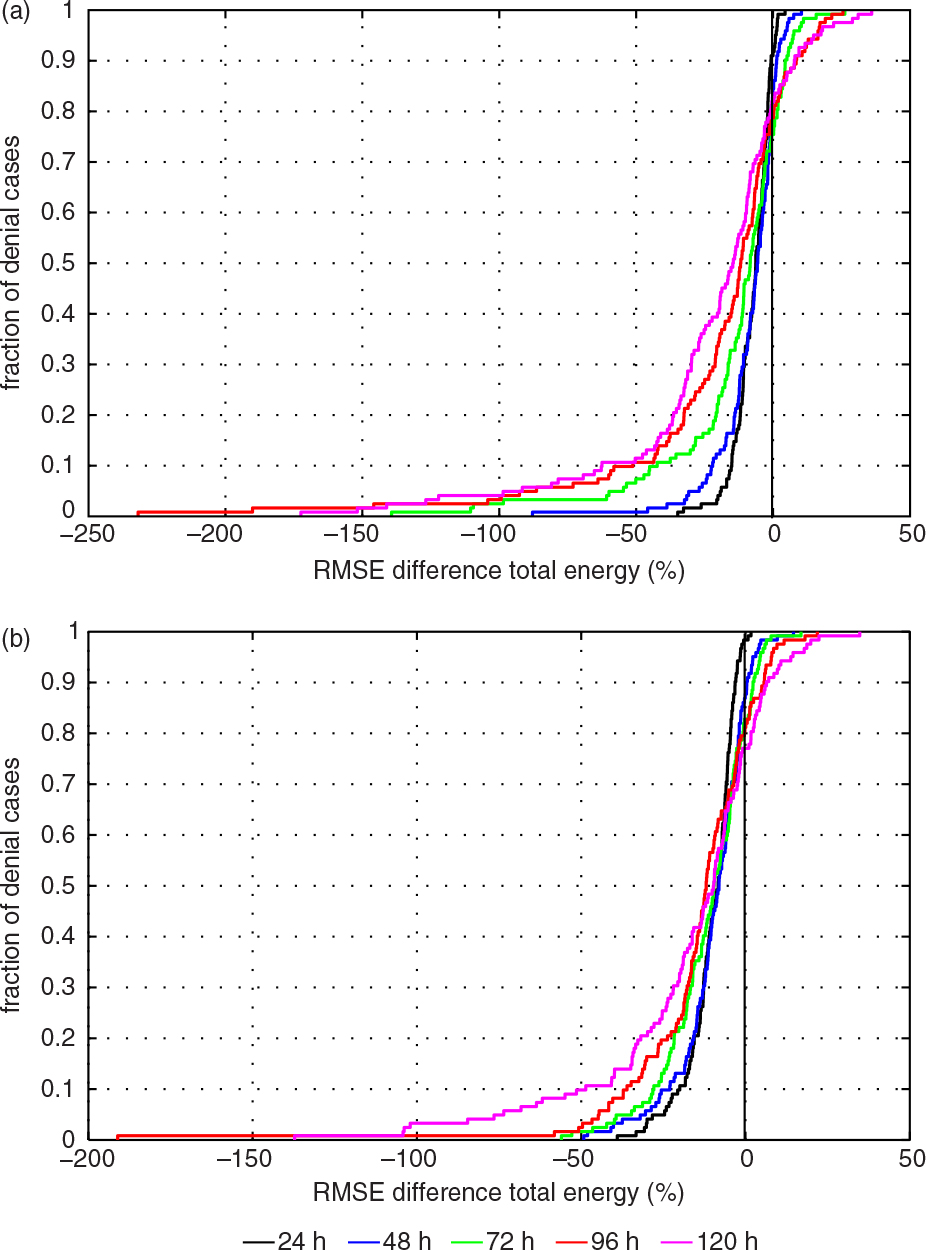
Fig. 5.
a) ETout and b) SVout: Box and whiskers plot of the percentage impact over Europe (35–75°N, 10°–30°E) in terms of total energy for all denial cases. The boxes comprise the 25 and the 75 quantile, the median is indicated by a horizontal red line in each box. The most extreme outliers are shown by the whiskers. ET cases are divided by vertical dashed lines. ET times are indicated by vertical dotted lines.
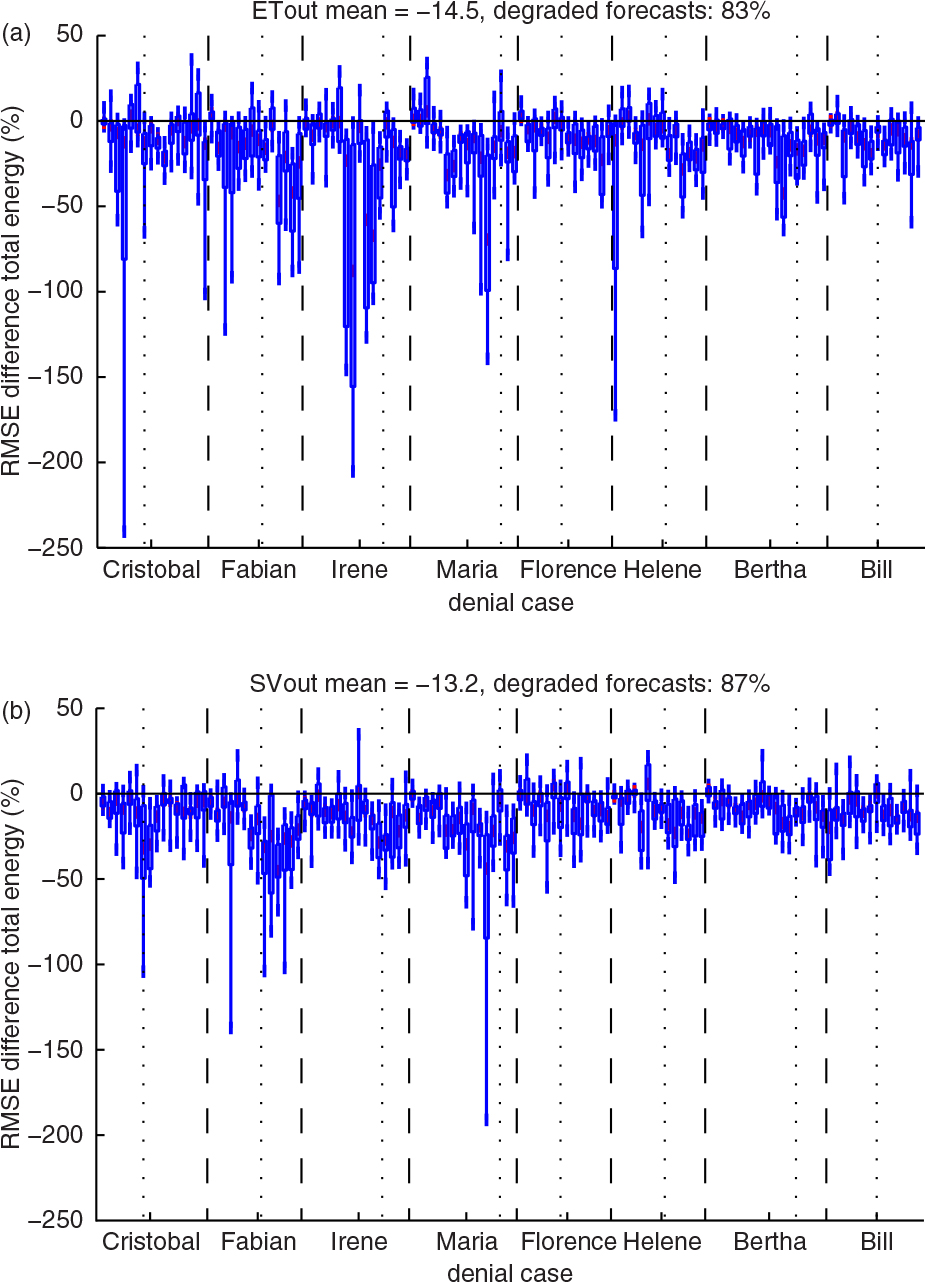
Fig. 6.
a) Total DFS per ET case for Ctrl. b) Total DFS per observation type for Ctrl. The DFS was calculated over the Atlantic/European area (100°W–10°E, 20°–80°N).
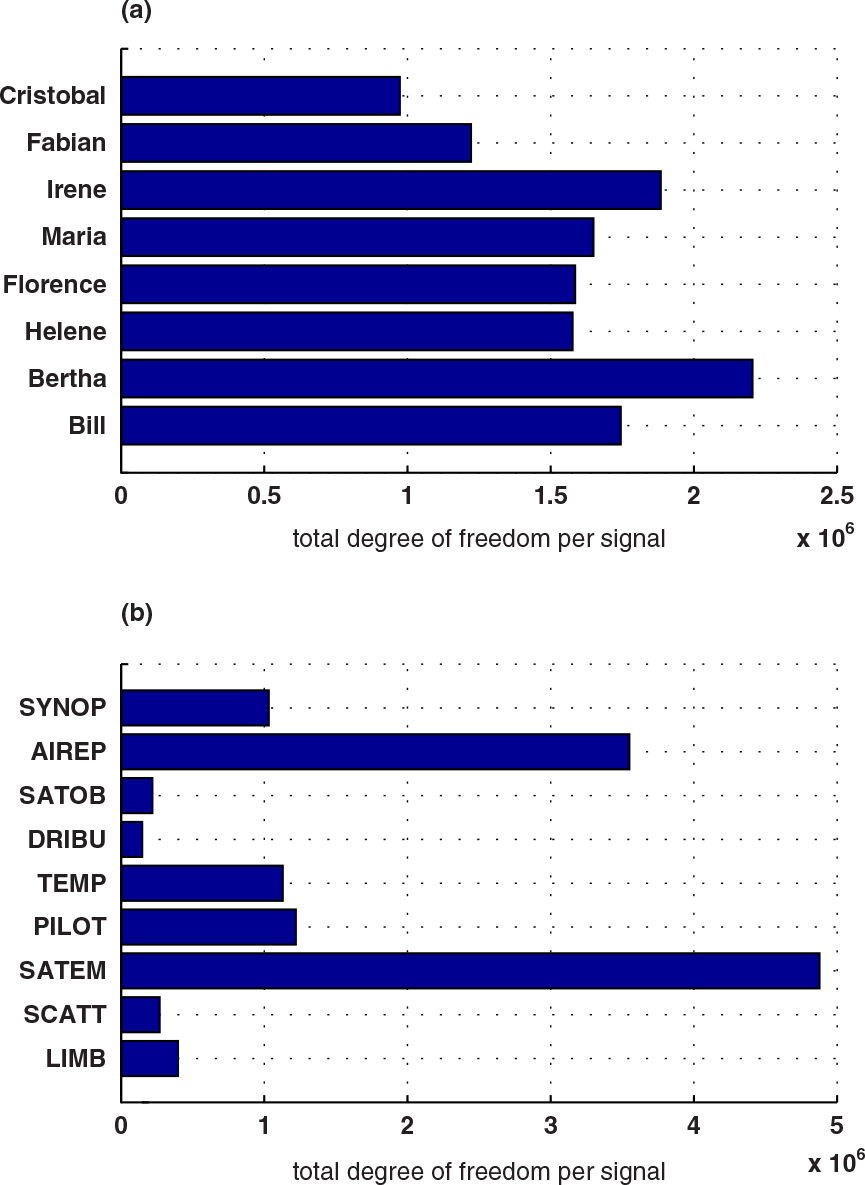
Fig. 7.
Difference between the information content of all observations for ETout–SVout, normalised by SVout, for all eight ET cases in the Atlantic/European area (100°W–10°E, 20°–80°N).
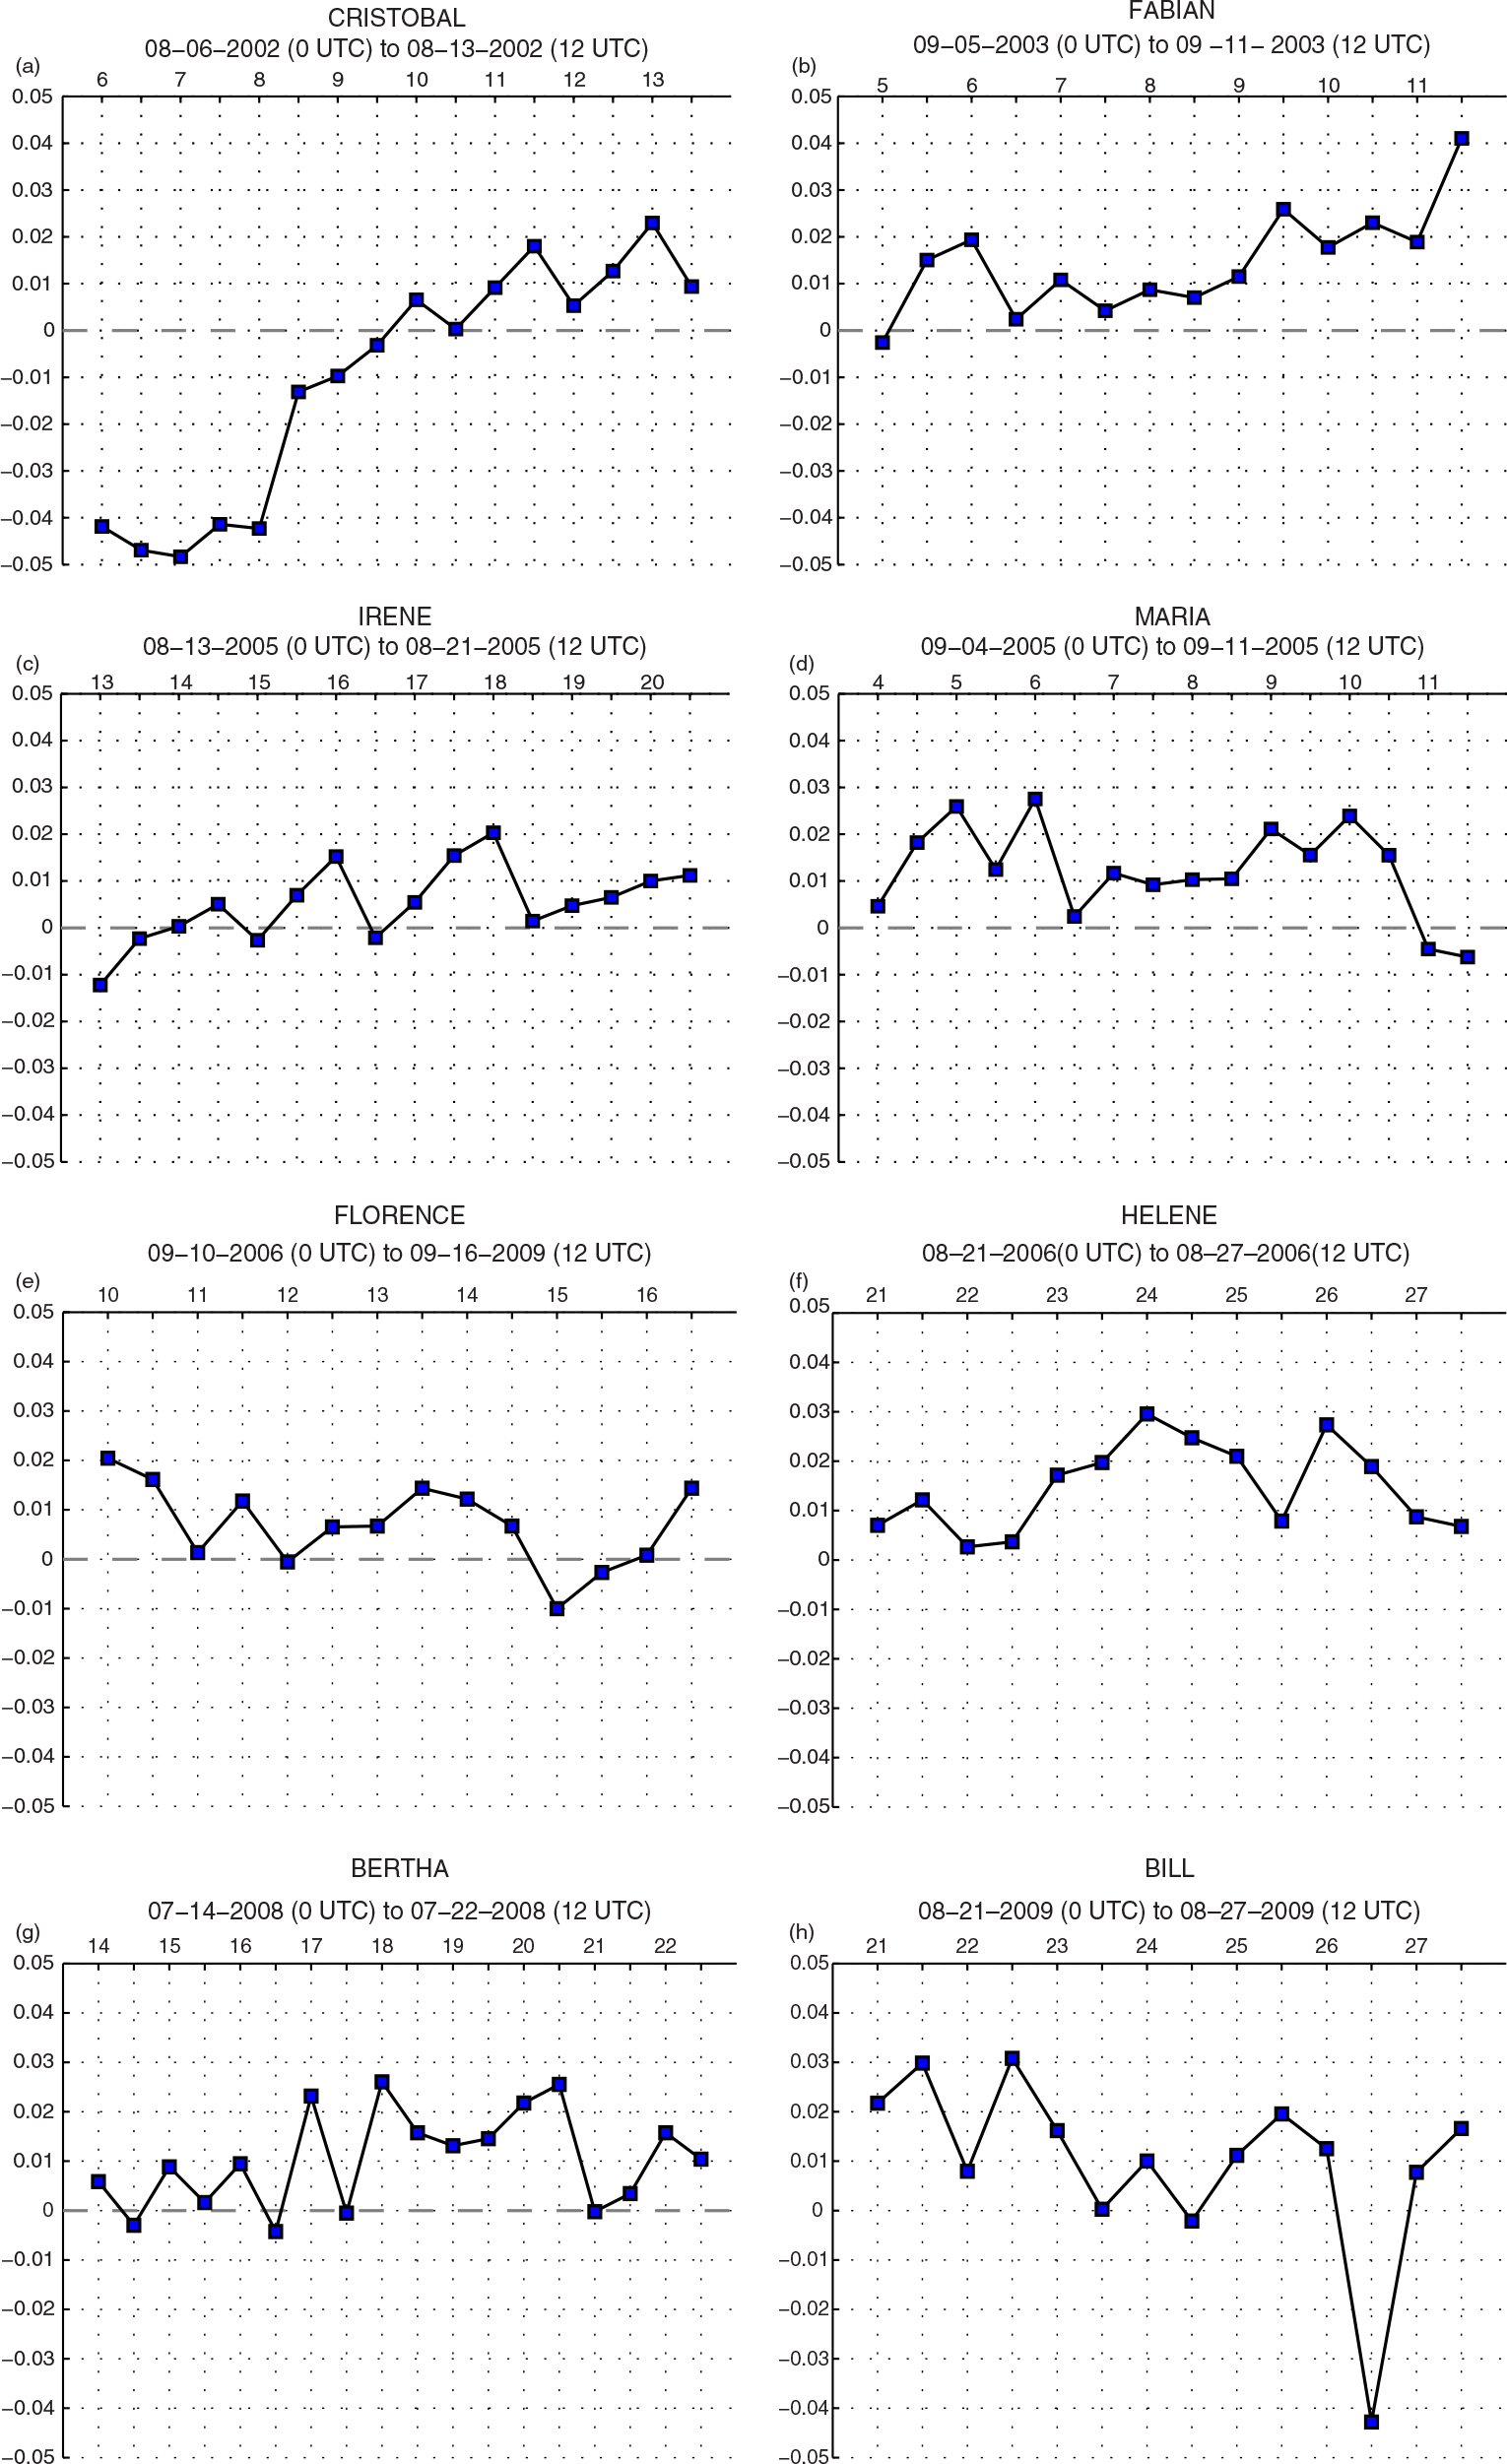
Fig. 8.
Analyses of 16 September 12 UTC for a) Ctrl and b) ETout. Forecasts for c, d) 36 h, e ,f) 60 h and g, h) 84 h initialised on 16 September 12 UTC for Ctrl (left) and ETout (right). 500 hPa geopotential (shaded), mean sea level pressure (contours, contour interval is 2 hPa). The position of Irene is marked by a white TC symbol.
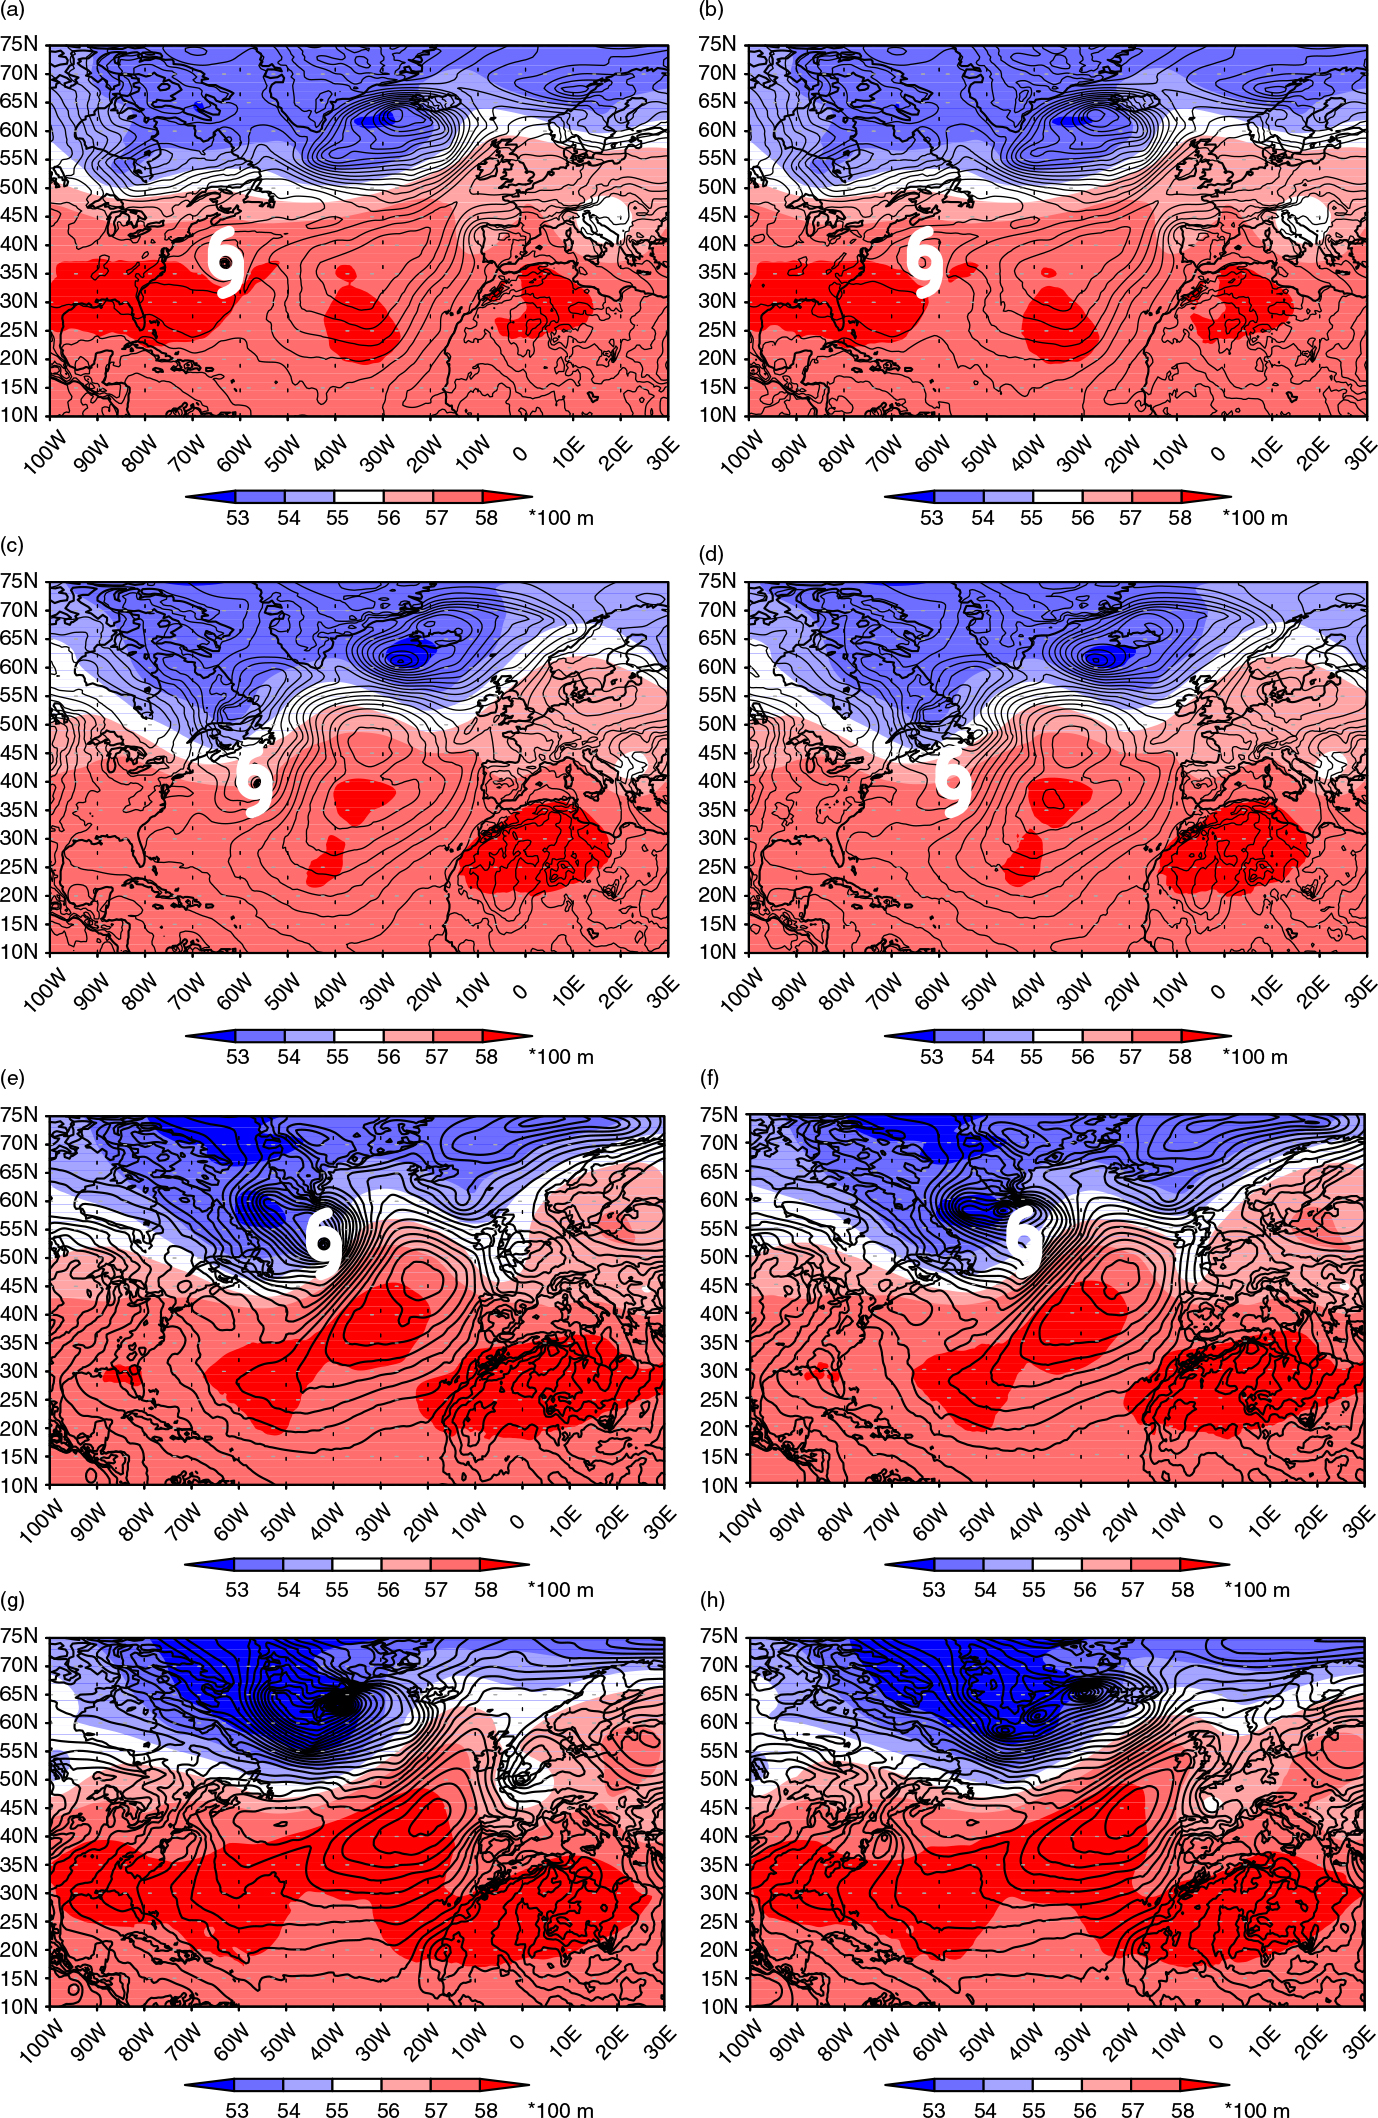
Fig. 9.
Difference between Ctrl and ETout forecasts in terms of the 500 hPa geopotential (shaded) for a) 36-h forecast, b) 60-h forecast and c) 84-h forecast time initialised on 16 September 12 UTC. Ctrl forecast of 500 hPa geopotential (contours).
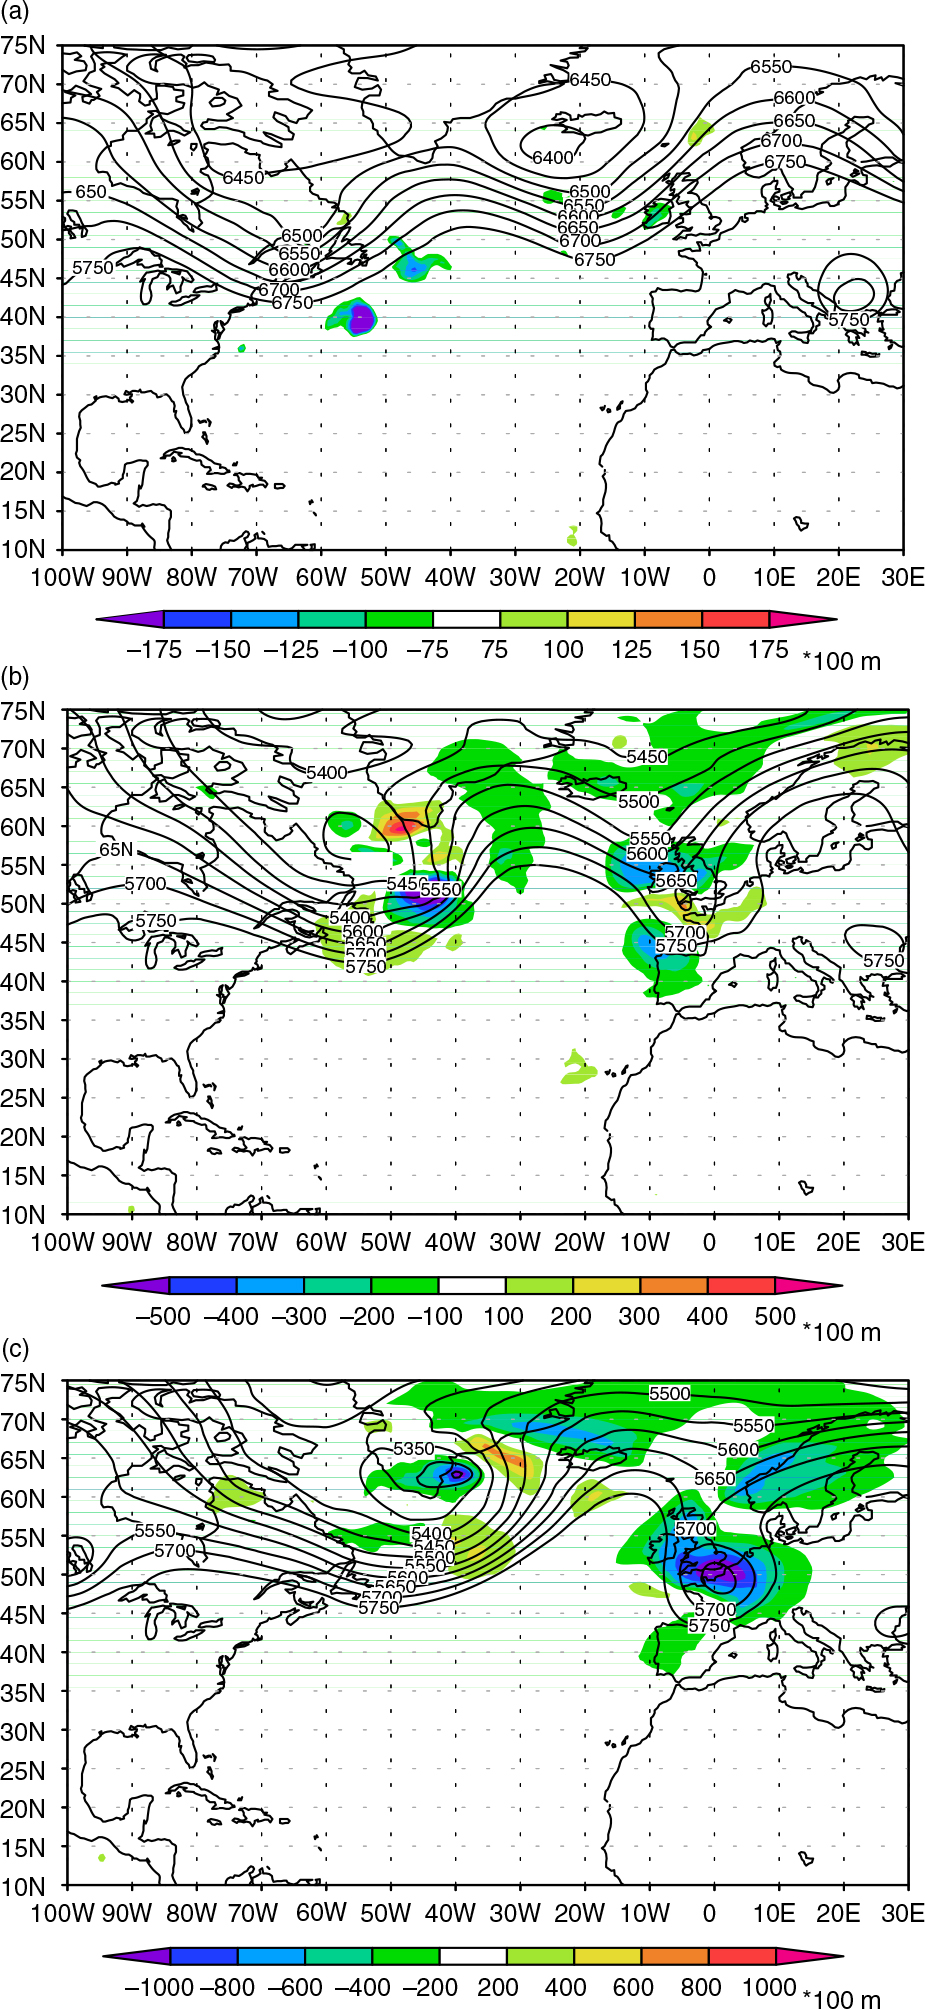
Fig. 10.
Forecast of large scale and convective precipitation (mm) (shaded) and of 200 hPa geopotential (contours) for 120 h (a, b) and 144 h (c, d) initialised on 16 September 12 UTC for Ctrl (left) and ETout (right).
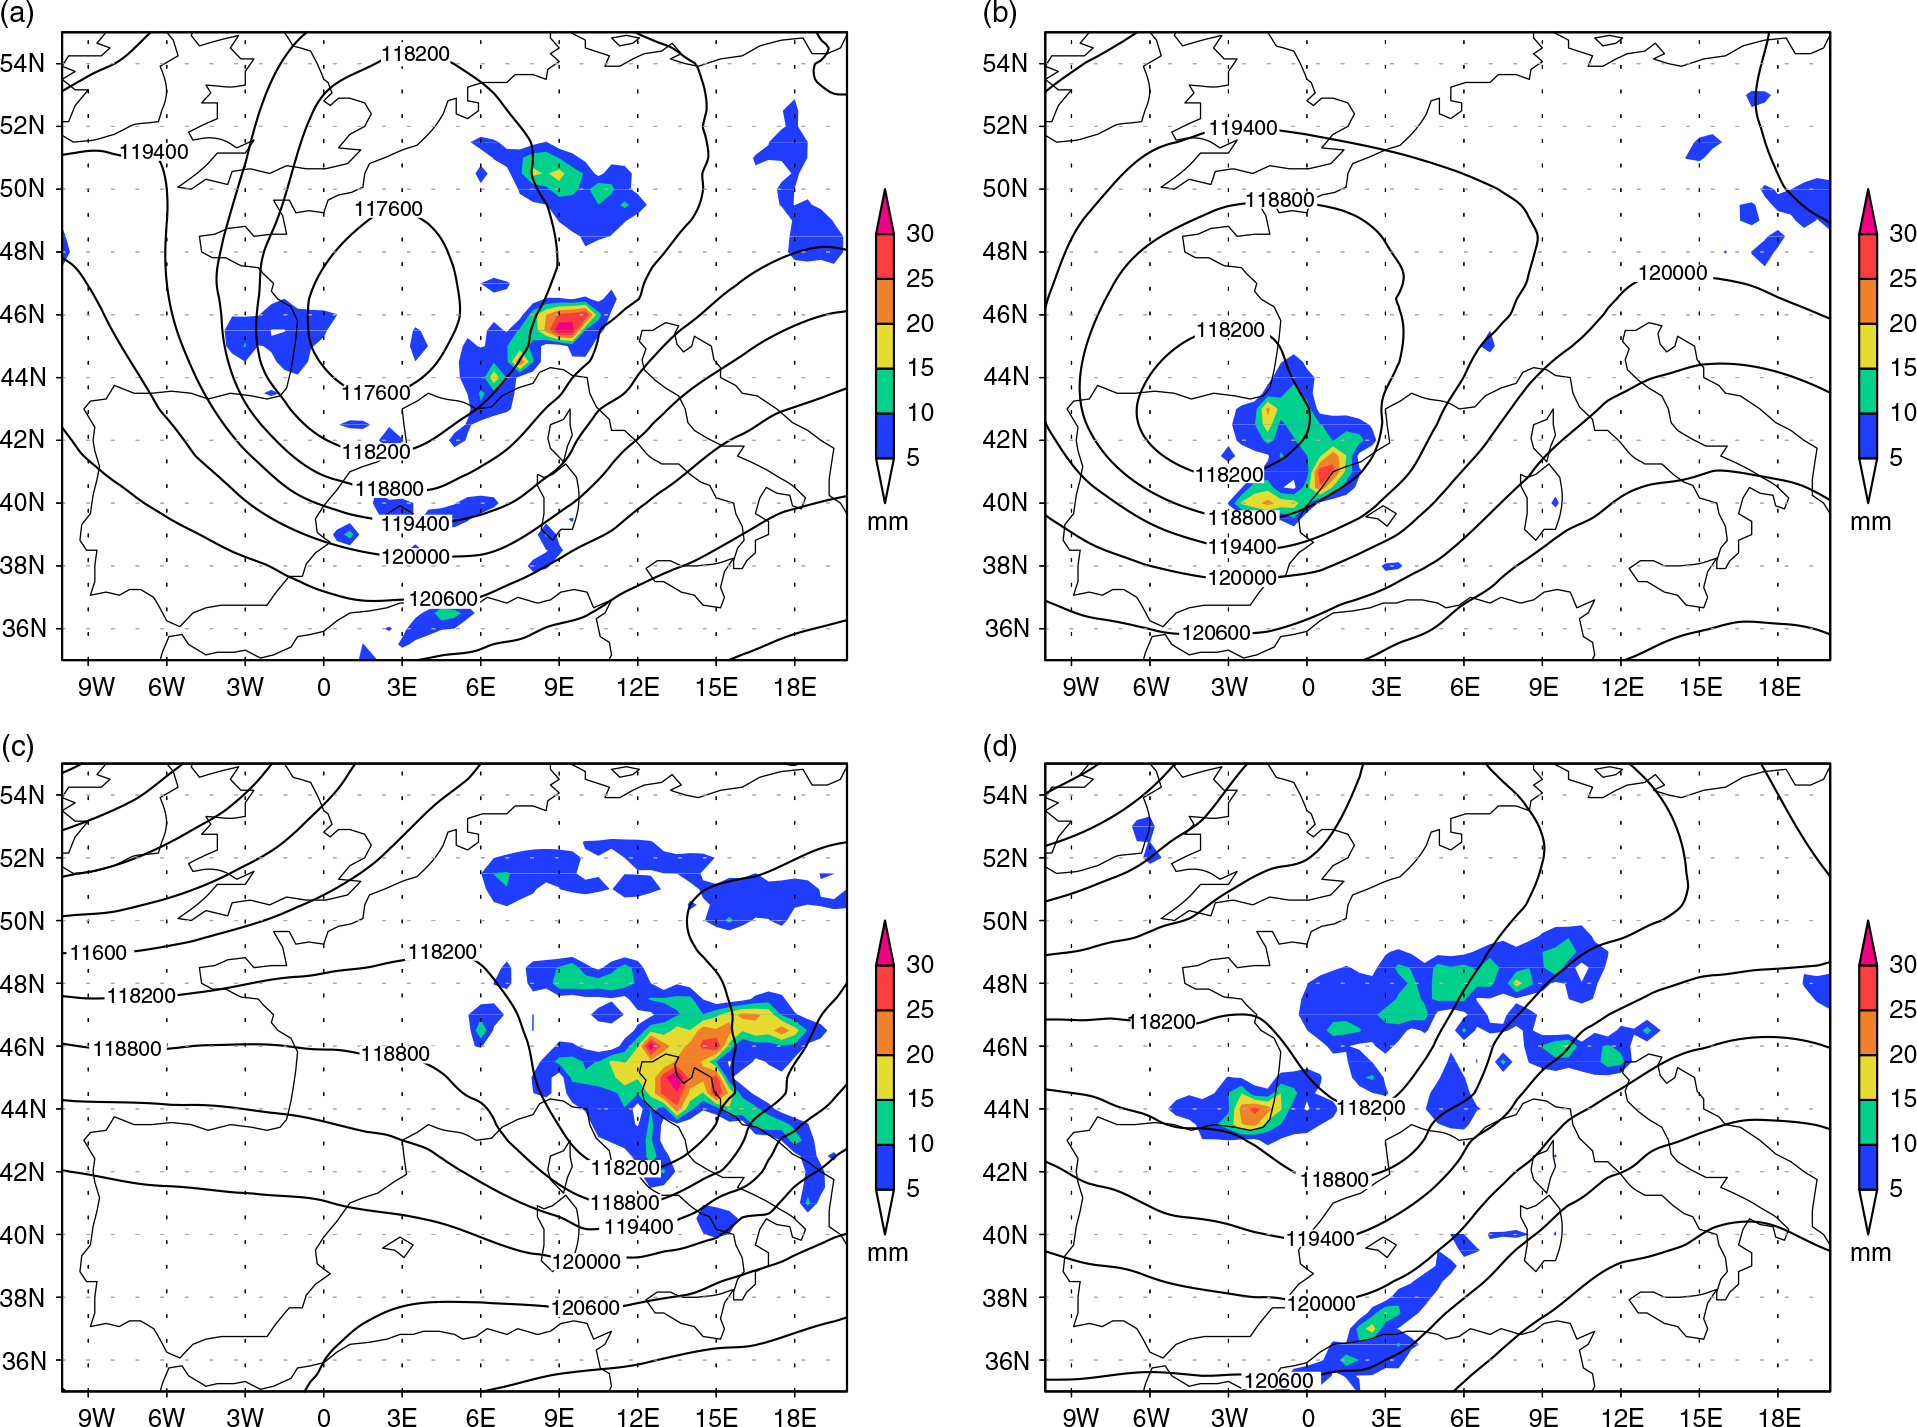
Fig. 11.
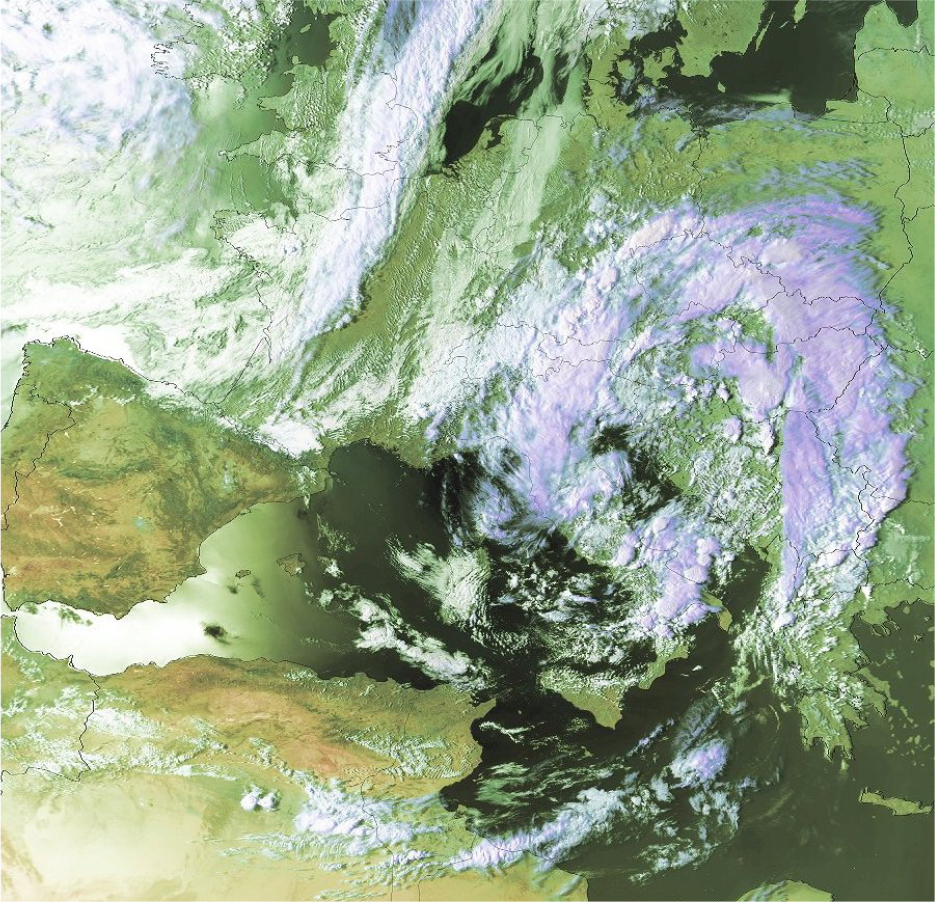
NOAA visible satellite image at 22 August 2005 15:58. www.wettergefahren-fruehwarnung.de; M. Wienzek.