
Fig. 1.
Schematic representation of the leaky funnel model. A 3-D view is given in the inset while the main figure consists of a projection onto the x–z plane. The leaky funnel extends from x=0 to x=∞ with a decreasing section. The entrance of the funnel is fueled with water from the ocean surface. The porous walls allow water to escape the funnel. Advection and diffusion control the transport within the funnel. At the entrance (boundary at x=0), concentrations are set to unity and ages to zero. It is noteworthy to mention that no assumption is made on the nature of the flow outside the funnel nor on the actual position with respect to the mixed layer.
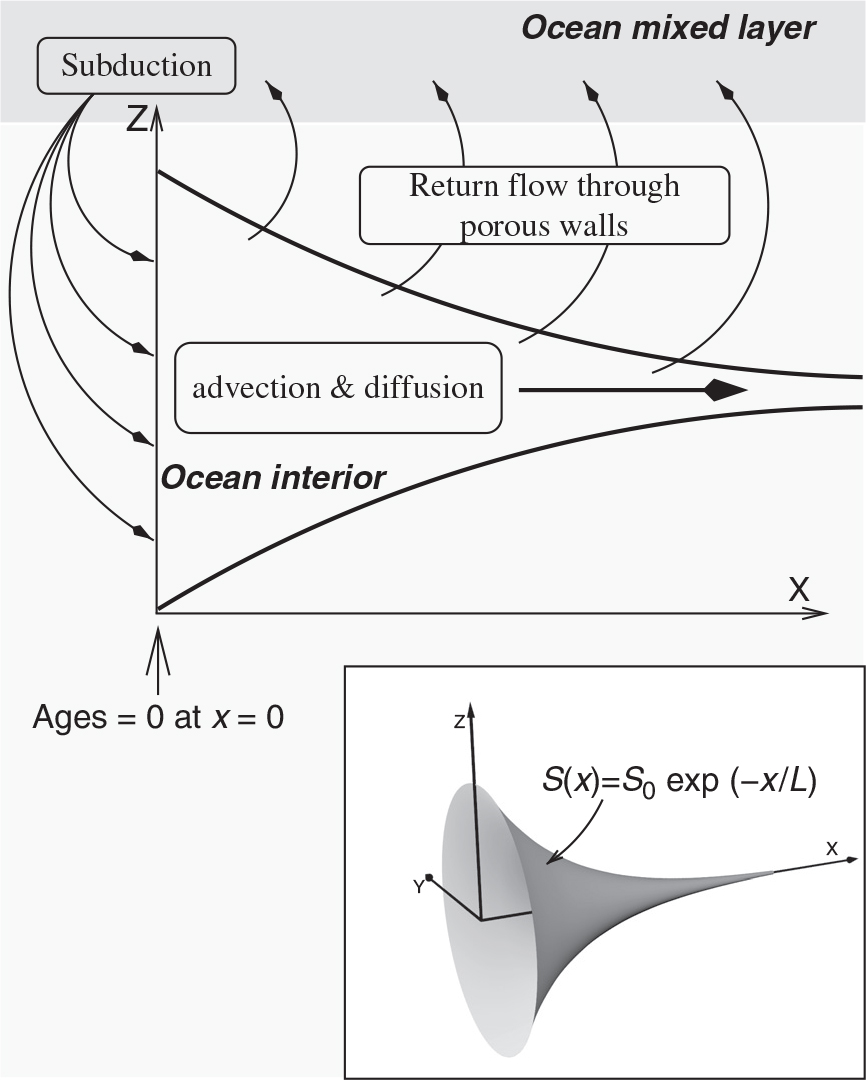
Fig. 2.
Global water age distribution ϕ (solid line) versus age in two 3-D OGCMs, UL-OM (top left) and LSG-OM (top right), compared to that predicted by the leaky funnel (dashed line). The leaky funnel curve in each panel is obtained with the parameters appropriate to the corresponding OGCM from Table 1. In the two upper panels, the curve computed with the parameters as estimated by the method of MD08 is also represented (dotted line). The arrow in those two panels points to the actual global mean water age 〈a〉 obtained with each OGCM. The lower two panels allow the comparison of both OGCMs with focus on ages under 2000 years. Global water age distribution ϕ (bottom left) as obtained with LSG-OM (thin solid) and UL-OM (thick solid) and as estimated by the leaky funnel for each OGCM: LSG-OM (dotted) and UL-OM (dashed). Relative difference (bottom right) between the OGCM and the leaky funnel global water age distributions for LSG-OM (thin solid) and UL-OM (thick solid).
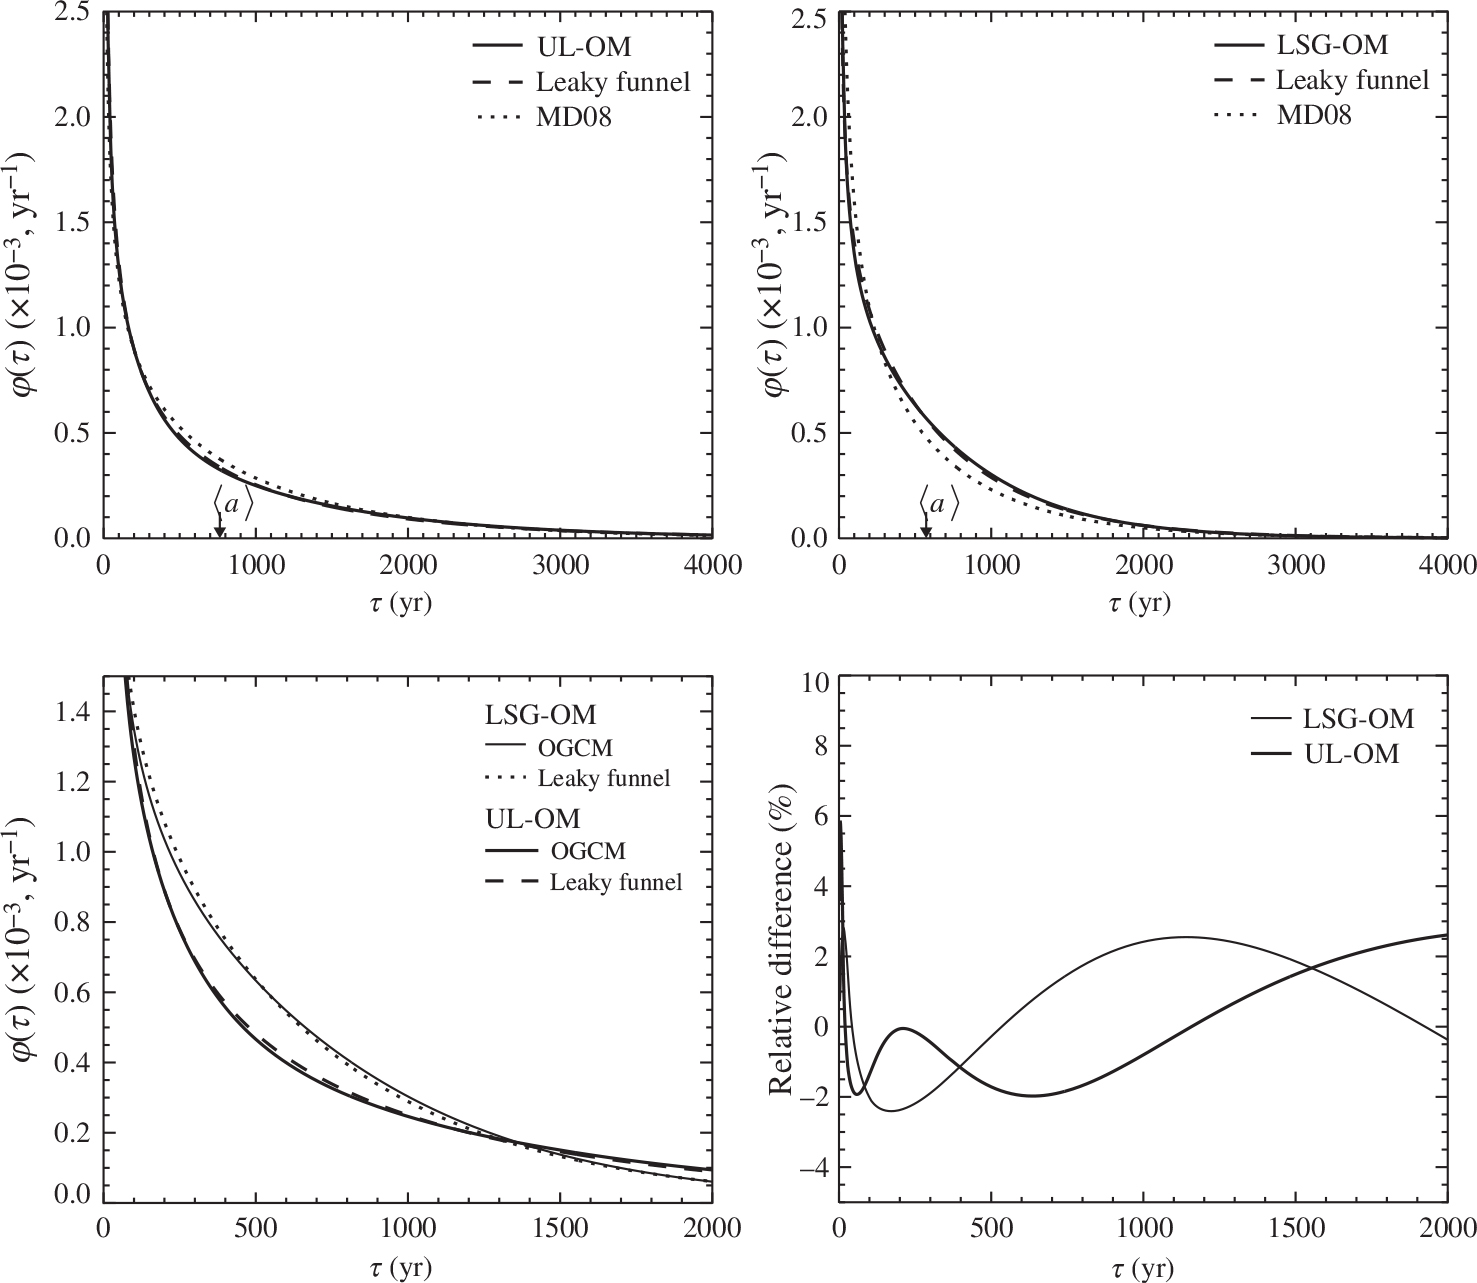
Table 1. Parameters A 0 and A D of the leaky funnel model as obtained from a least squares fit to the 3-D model results
[i] The estimated Pe number and global mean water age are given in columns 4 and 5, respectively. The last column contains the actual global mean water age from the 3-D OGCM experiment.
Fig. 3.
Global water age distribution ϕ in the leaky funnel (solid line) versus age. The two asymptotes when and are represented by the dashed and dotted-dashed lines, respectively. Also illustrated is the global distribution of mean water age φ (dotted line). We build these curves with the help of the A 0 and A D values obtained with the UL-OM model.
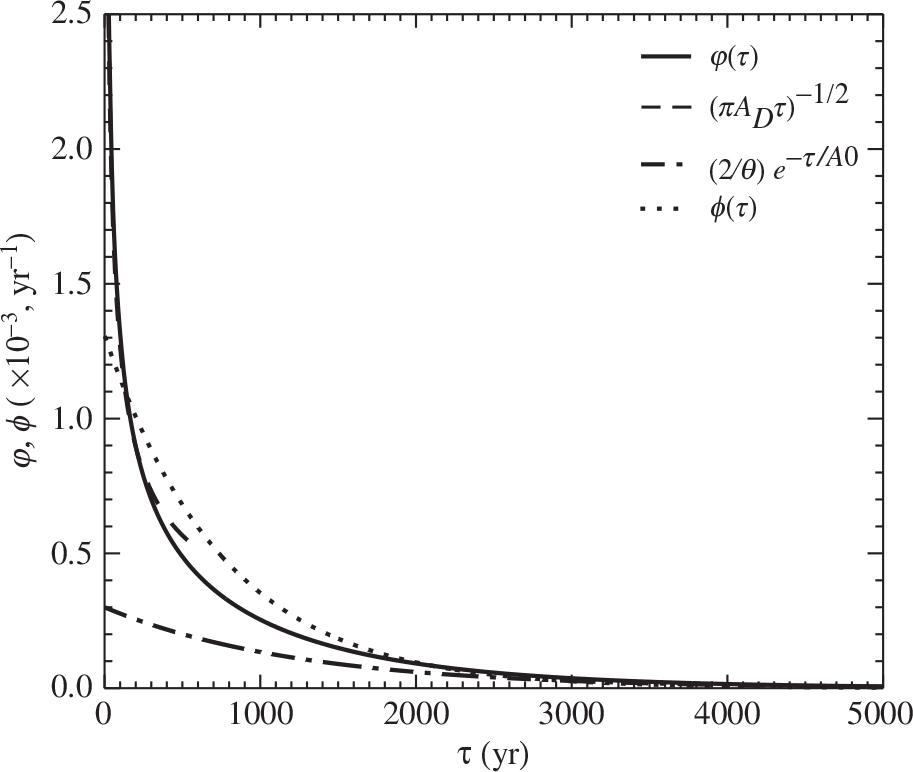
Table 2. Parameters of the leaky funnel model as obtained from a least squares fit to the domain-averaged water ages resulting from several experiments with two 3-D models (UL-OM, column 2, and LSG-OM, column 3)
[i] The values in this Table are obtained by the MD08 method with numerical diffusion explicitly considered. Line 4 gives the effective Peclet number computed from eq. (28) and the last line contains the effective A D scale (A D =Pe A 0).
Fig. 4.
Difference in CO2 cumulative uptake (thick solid line) by two ocean global carbon models. The individual uptakes (represented as anomalies with respect to 1765 A.D.) are obtained from abiotic constrained CO2 experiments with LSG-OM (dashed line) and UL-OM (dotted line). The thin solid line corresponds to the atmospheric CO2 forcing used in these experiments. Units for the atmospheric CO2 are given on the right axis.
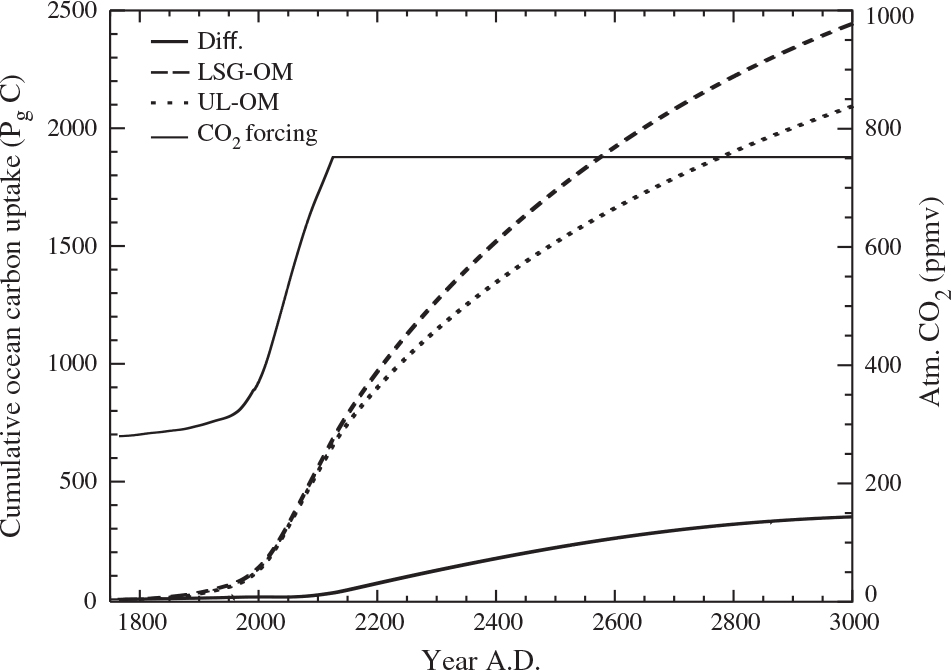
Fig. 5.
Mean δ14C vertical profiles in several ocean basins from GEOSECS (solid lines; Stuiver et al., 1981) and from two pre-industrial experiments with the OGCM standard versions UL-OM (dashed lines) and LSG-OM (dotted lines). The values in the North, Equatorial and Southern Atlantic and Pacific Oceans are reproduced, respectively, in the upper left and right three panels, with the bottom panel representing the Southern Ocean (south of 50°S). The pre-industrial OGCM δ14C is computed with the simplified method of Toggweiler et al. (1989). The discrepancy between models and data in the upper ocean partly results from the penetration of bomb 14C that is not considered in these numerical experiments.
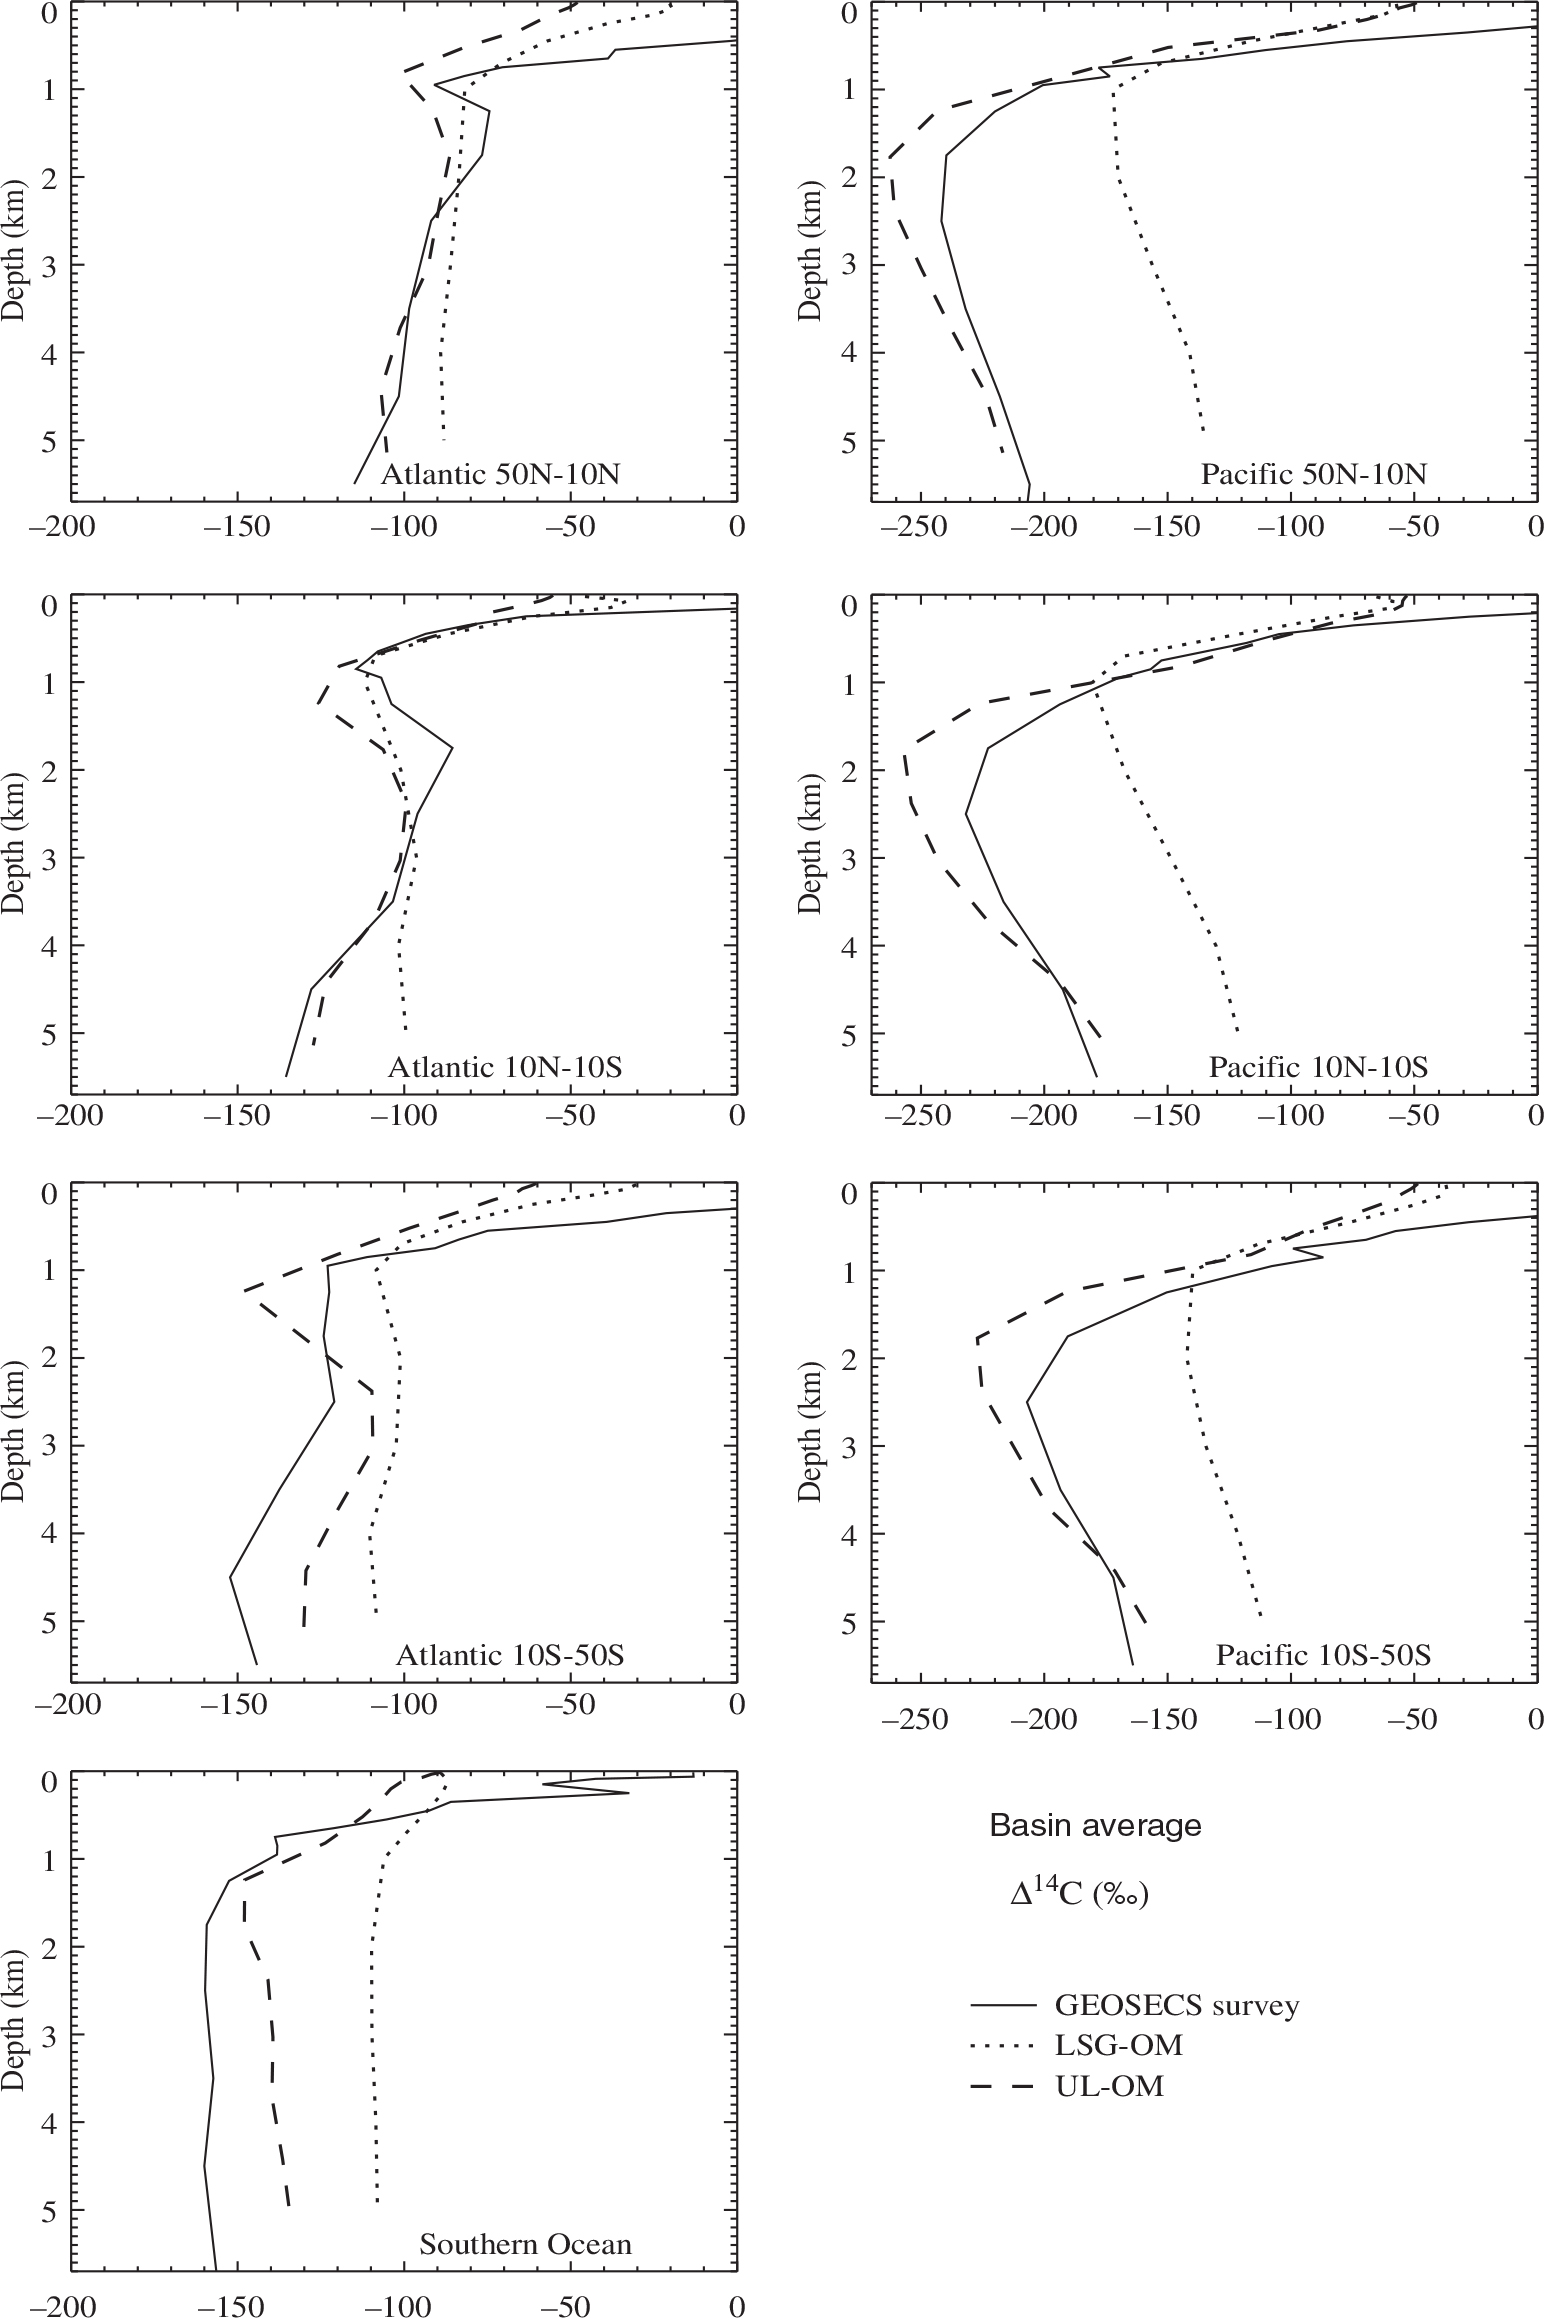
Table 3. Best fit parameters of the leaky funnel when numerical diffusion is considered (rows 4 and 5) or not (rows 7 and 8) in the least squares fitting procedure of MD08
[i] For each OGCM (column 1), this table gives the advective timescale (column 2), the Peclet numbers associated to the explicit and numerical diffusivities (columns 3 and 4) and the effective Pe (column 5). Column 6 contains the estimated domain averaged water age 〈â〉 computed from eq. (23) with the help of A 0 and Pe in the present table. The global mean age predicted by the standard version of the OGCMs (that is, for β i =γ i =1) is given in column 7.