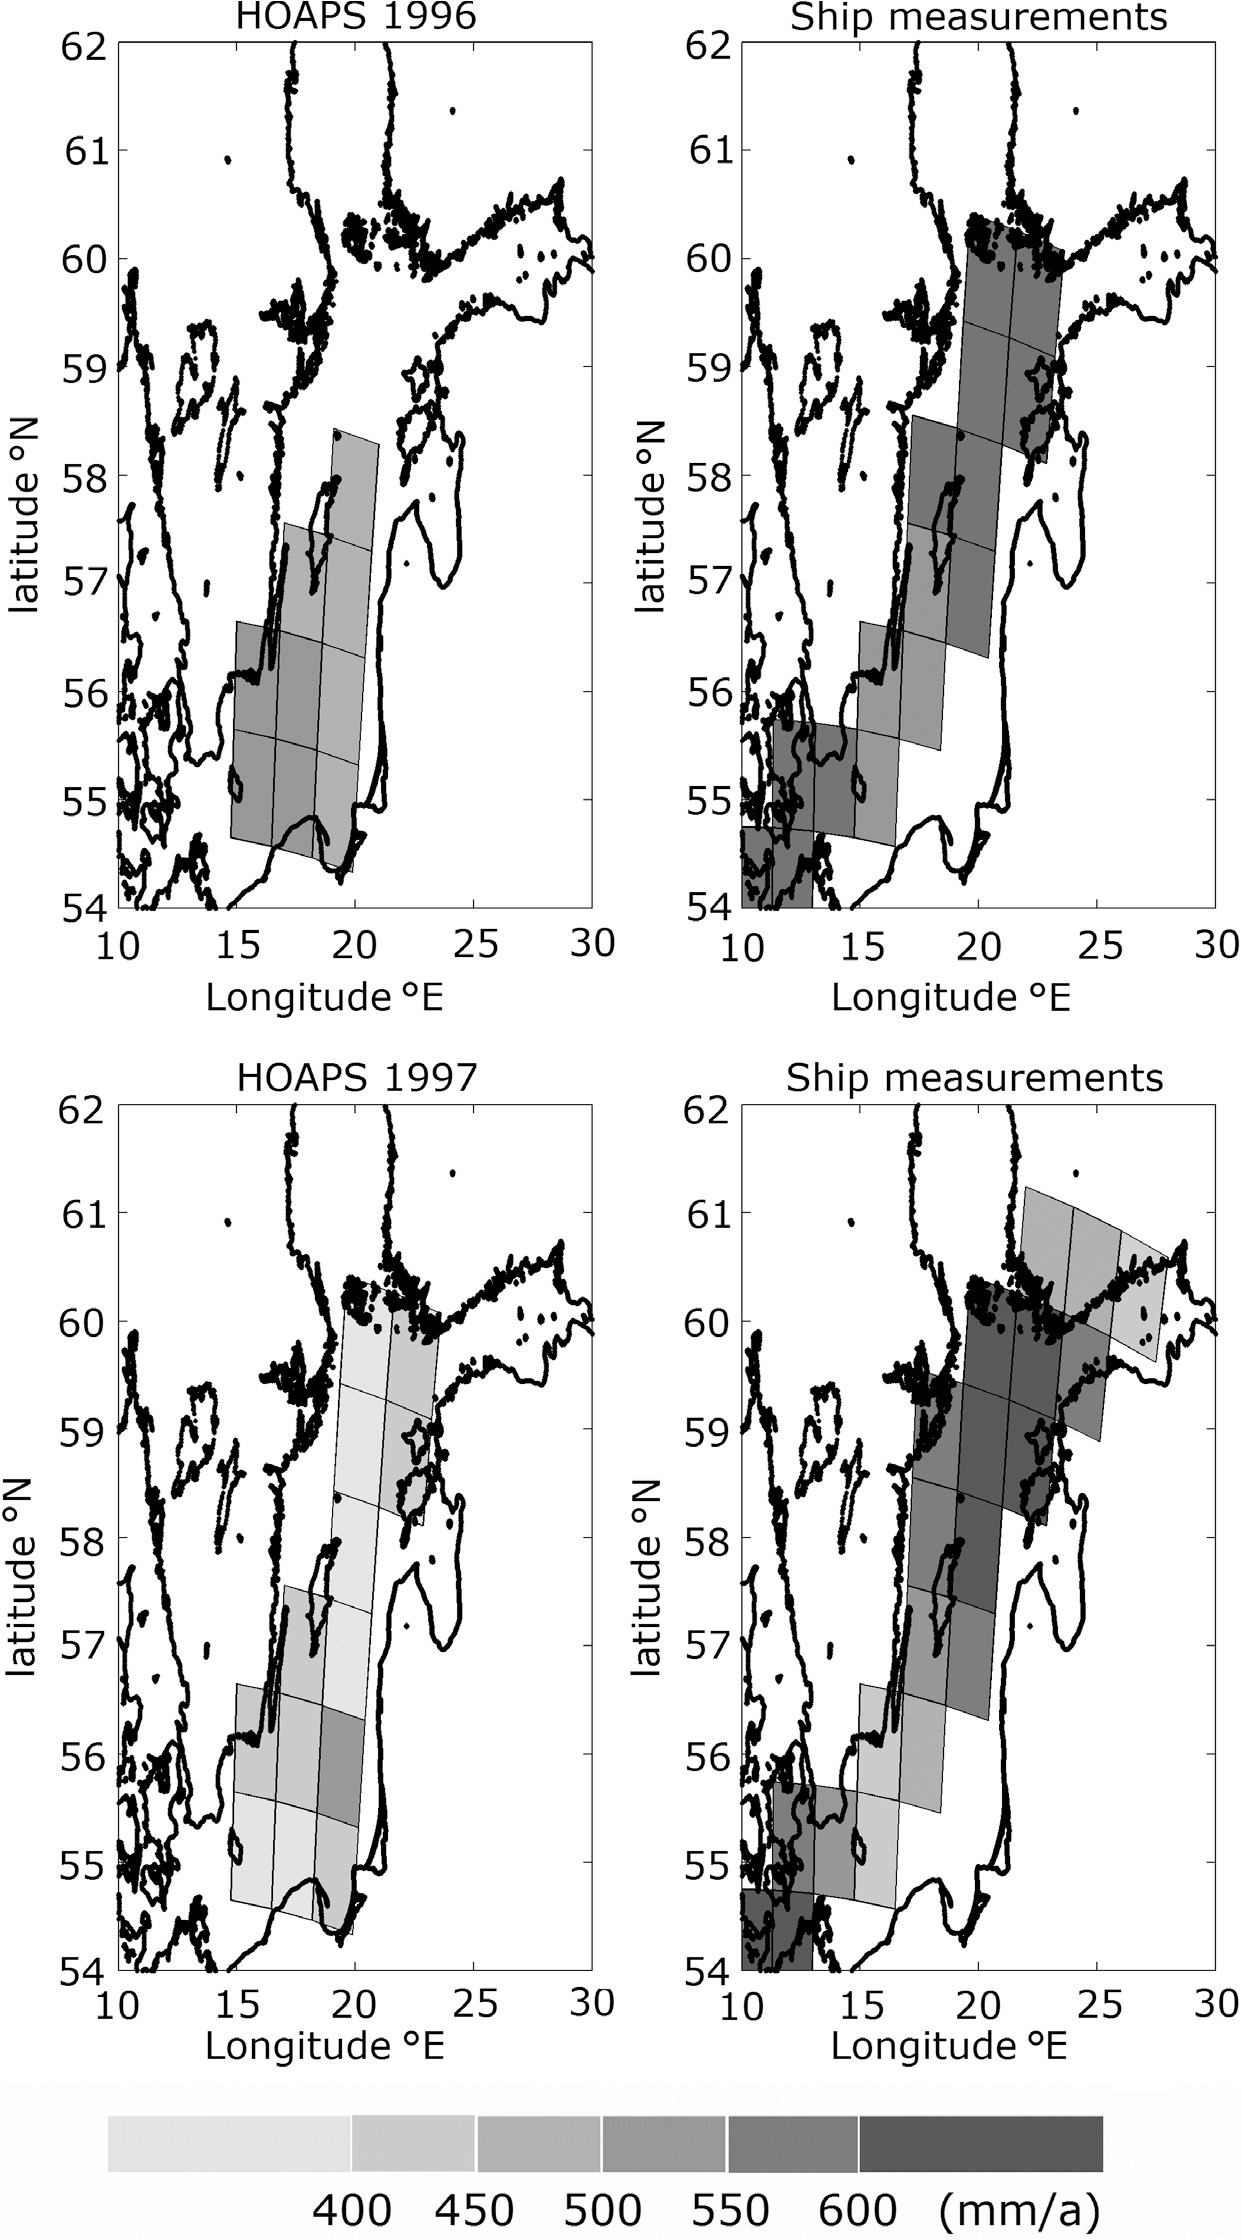
Fig. 1.
Correlation functions for precipitation measurements derived from measurements using an optical disdrometer (Großklaus et al., 1998) on board of R/V Alkor over the Baltic Sea for 1-min averaging intervals (left) and hourly time series (right). Measurements are from 2000 until 2003.
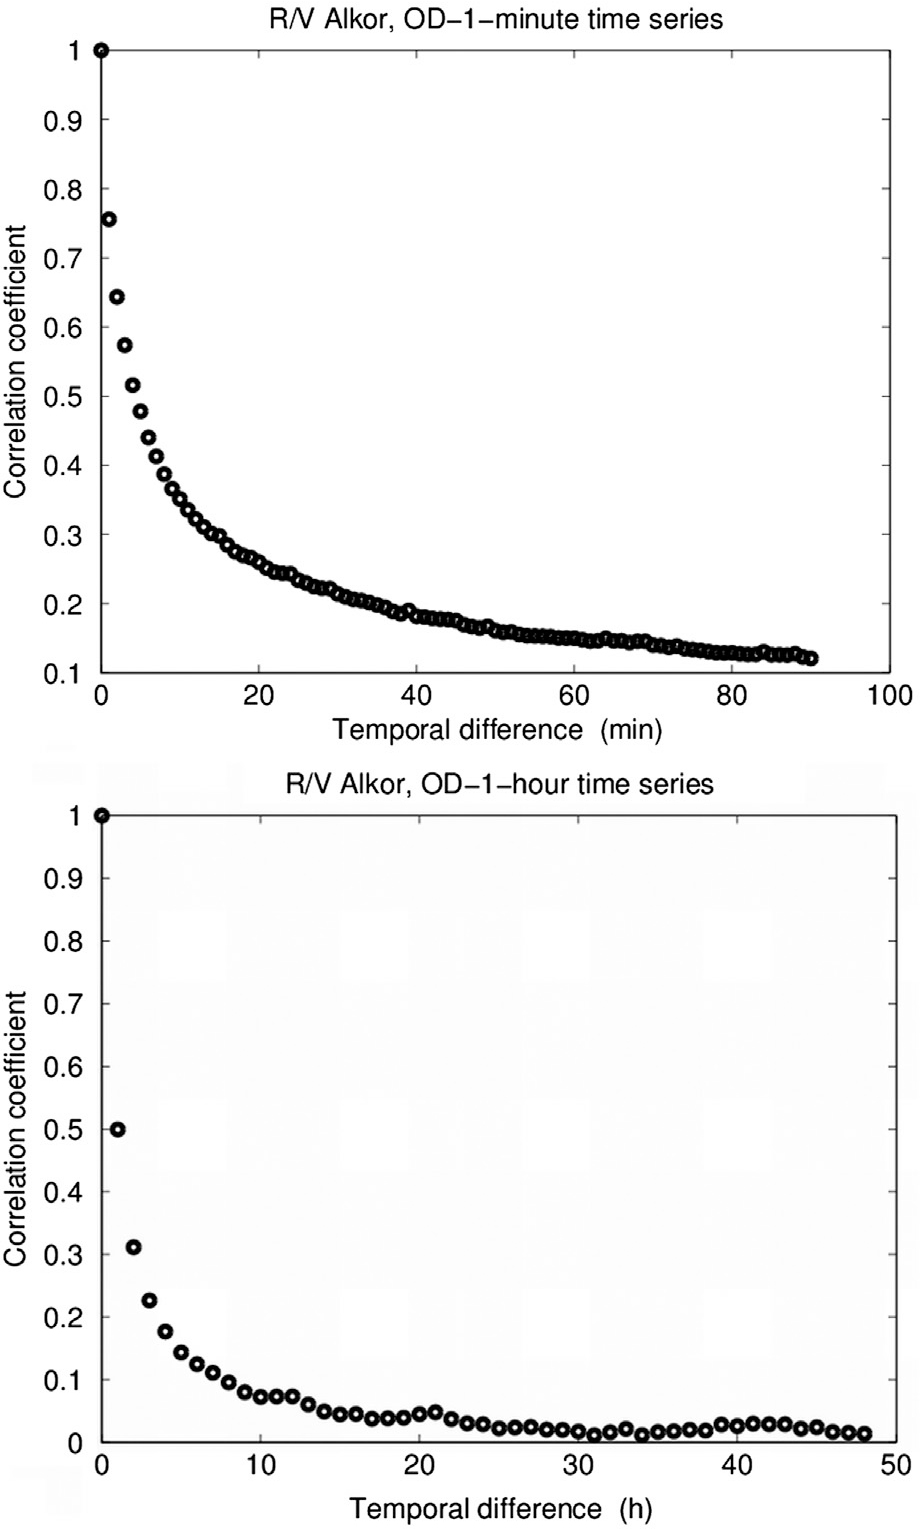
Fig. 2.
Sketch of the ship rain gauge showing the horizontal and lateral collectors and the drop forming devices.
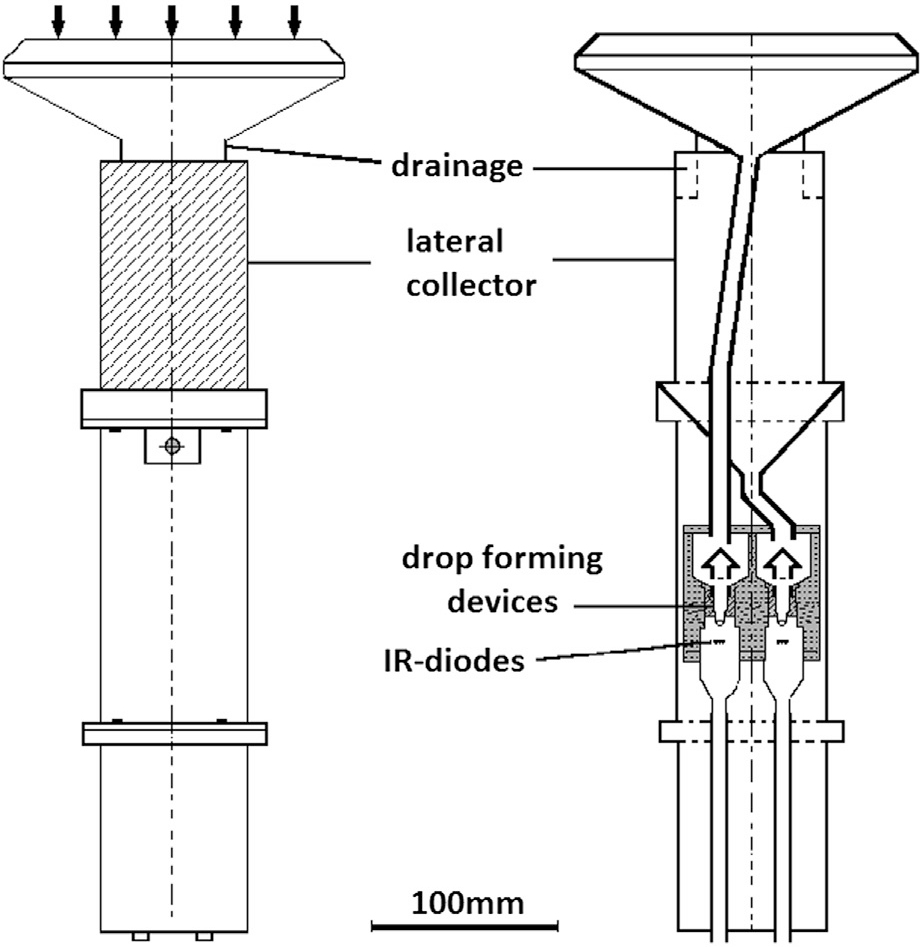
Fig. 3.
Correlation function based on ship rain gauge measurements on merchant ships with 8-min integration time over the Baltic Sea area. Measurements are from 1995 until 1997.
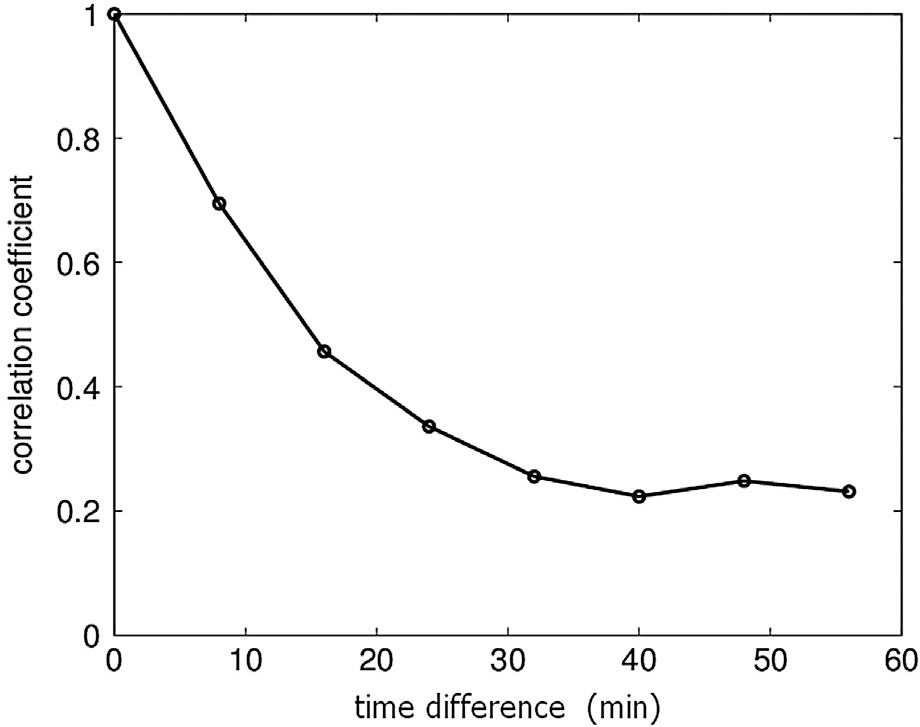
Fig. 4.
Collocated ship measurements (black symbols) and HOAPS data. The HOAPS’ footprints are indicated by the grey lines. Data are from 1995 until 1997, the minimum distance of the ships to the coast is 50 km.
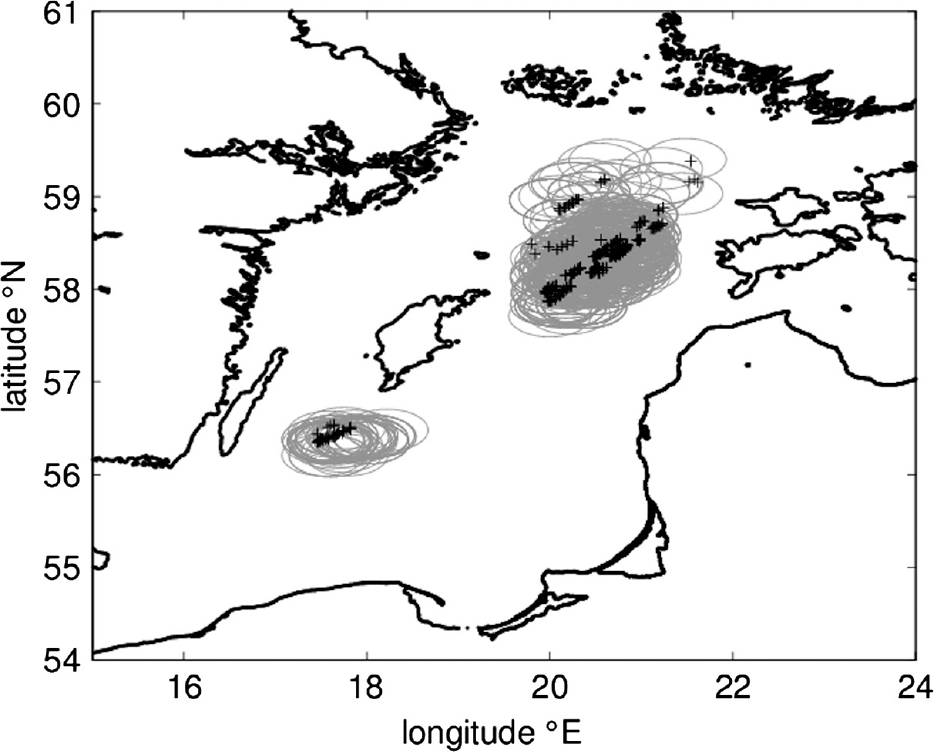
Table 1. 2×2 contingency table for measured precipitation ≥ 0.01 mm h−1 and HOAPS precipitation ≥0.3 mm h−1. Collocated data have been merged to single events according to the time of the satellite's overpass
Table 2. 2×2 contingency table for measured precipitation and HOAPS precipitation, both ≥ 0.3 mm h−1. Collocated data have been merged to single events according to the time of the satellite's overpass
Fig. 5.
Detection of observed precipitation as a function of observed precipitation rate for collocated precipitation measurements and HOAPS data. Allowed temporal distance for collocation is 45 minutes, and the allowed spatial distance is 50 km.
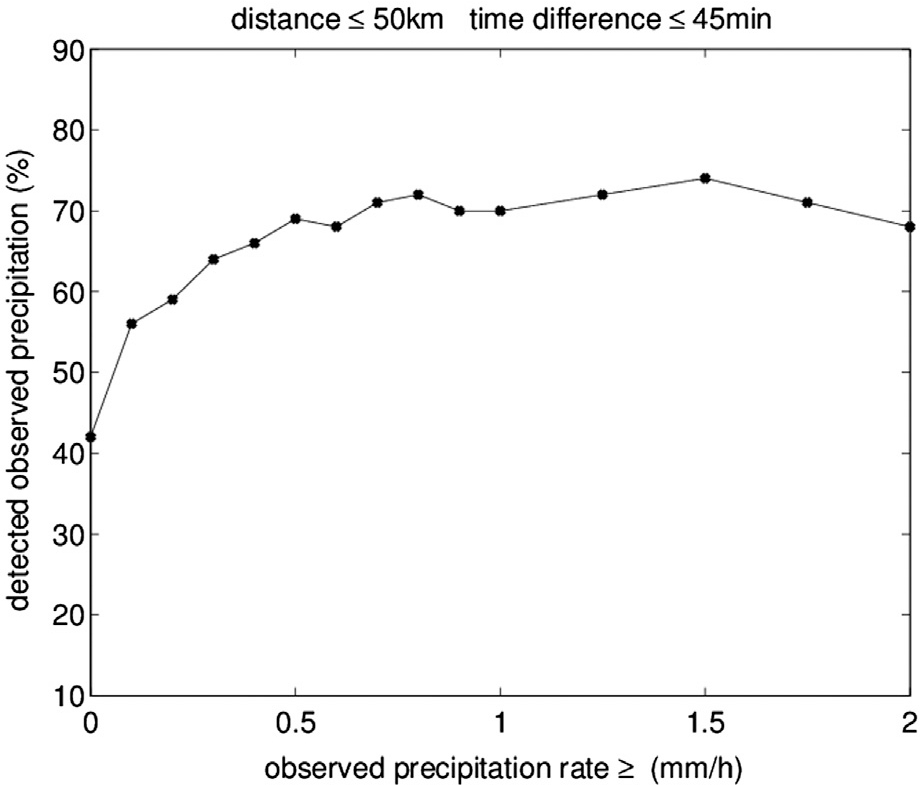
Fig. 6.
Detected observed precipitation as a function of the time difference between observation and HOAPS data. The distance between measurement and HOAPS data is less than or equal to 15 km, the minimum of measured precipitation rate is 0.5 mm h−1. The full line gives the running mean over 11 minutes.
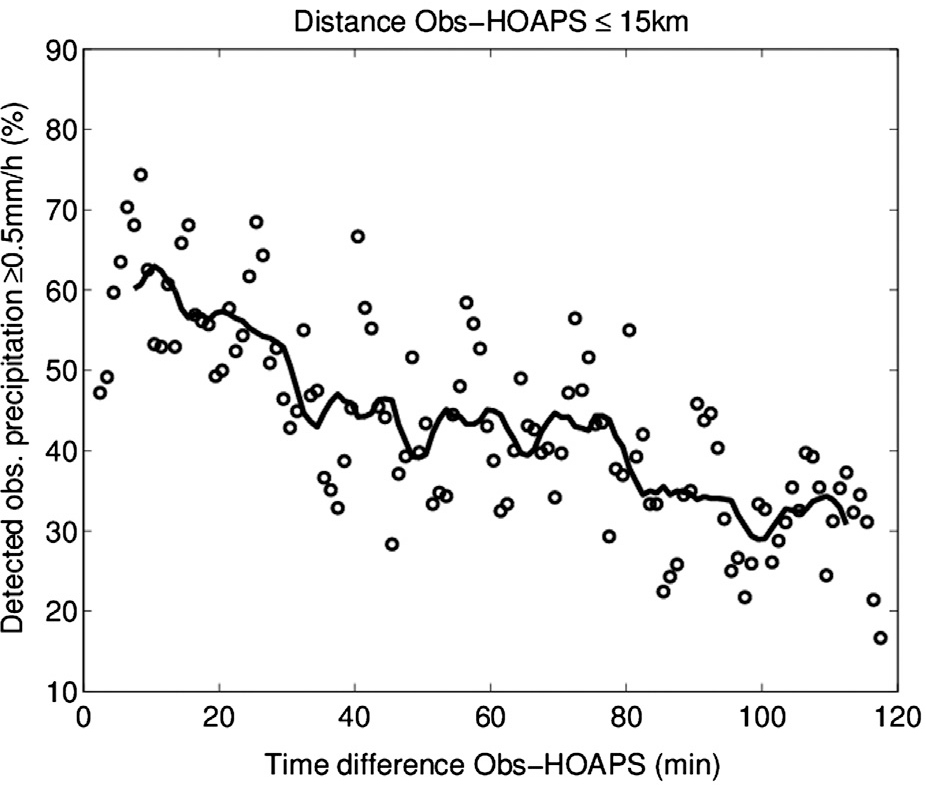
Fig. 7.
Detected observed precipitation as a function of the distance between observation and HOAPS data. Time difference is less than or equal to 20 minutes, the minimum of measured precipitation rate is 0.5 mm h−1. The full line gives a running mean over 11 km.
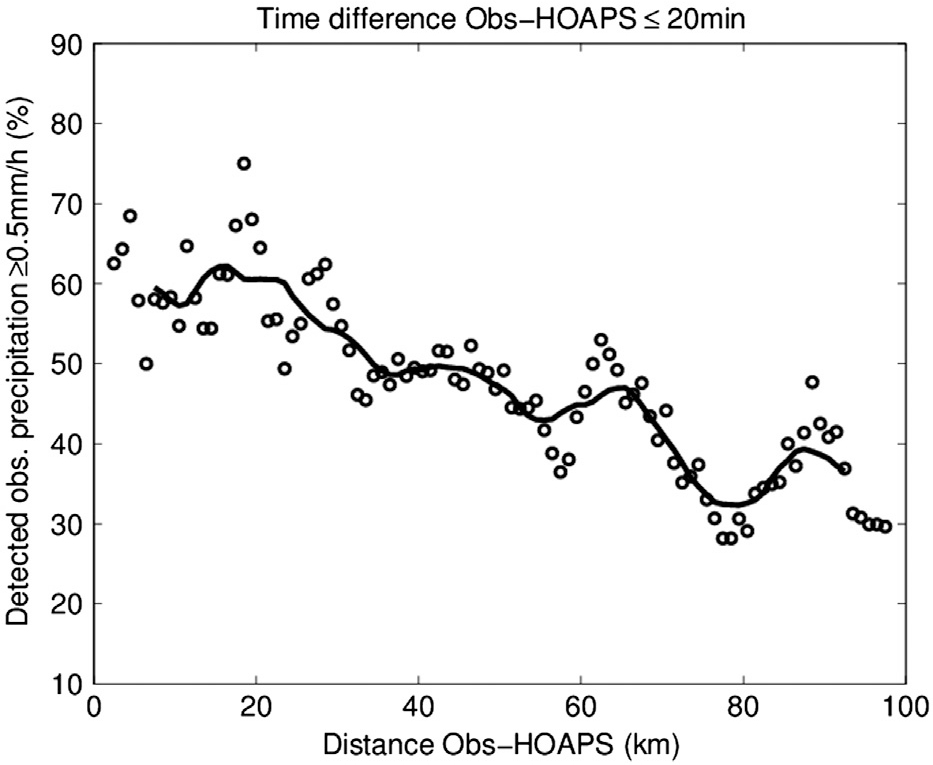
Table 3. Measurements of precipitation and their detectability by HOAPS as a function of the cloud type as it was estimated from infrared satellite images
Table 4. Measurements of precipitation and their detectability by HOAPS as a function of the degree of cloudiness. The cloudiness was taken from the 6- to 24-h weather forecasts of the Europamodell, interpolated linearly in space and time to the ship measurements
Table 5. Measurements of precipitation and their detectability by HOAPS as a function of the type of fronts as estimated from weather maps (Deutscher Wetterdienst, 1995, 1996, 1997) close to locations of measured precipitation
Fig. 8.
Analysed precipitation rates over the Baltic Sea based on HOAPS (left) and ship rain gauge measurements (right) for 1996 (top) and 1997 (bottom). Results are from an analysis based on the Kriging method (Clemens, 2002).