Fig. 1.
The temporal weighting function w of nudging, where t is the model time, t o is the observation time and τ N is the half-period of nudging time window (after Stauffer and Seaman, 1990).
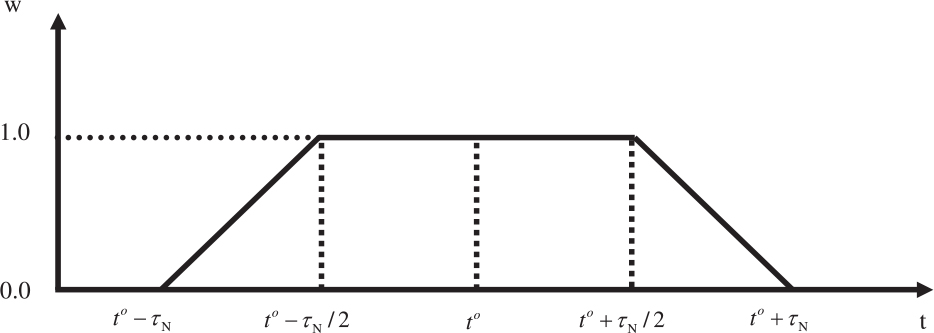
Fig. 2.
Schematic showing the procedures of the HNEnKF approach. The trapezoid around the observation denotes the temporal nudging weighting function over the nudging time window.
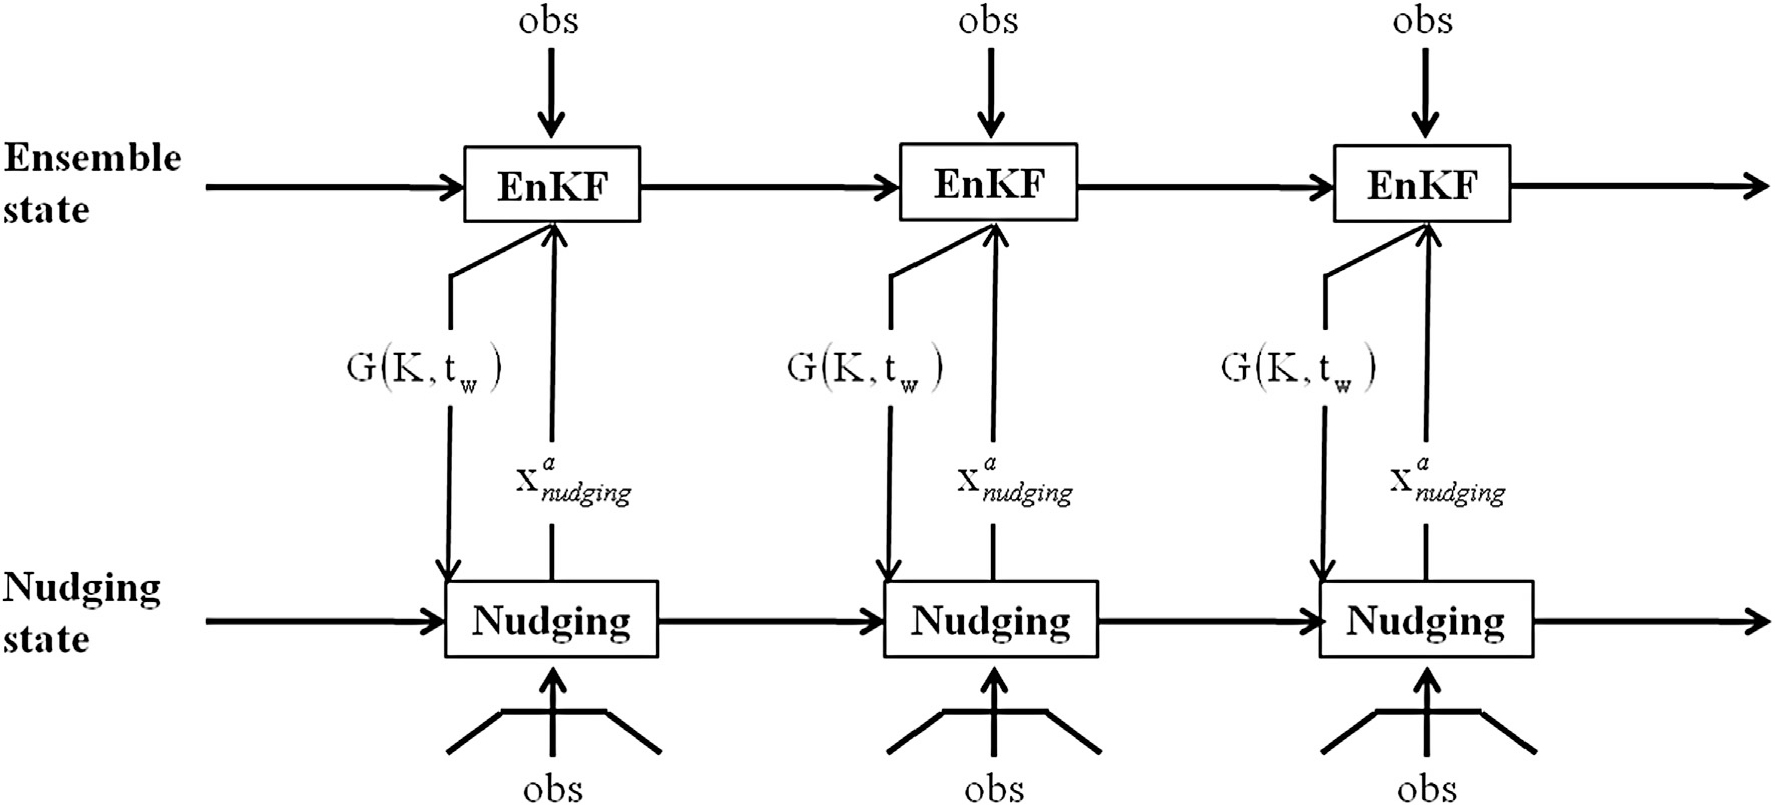
Table 1. Experimental design
Fig. 3.
The average RMS errors for the 3000-step dynamic-analysis period set-up for the control run without data assimilation, traditional nudging and two kinds of HNEnKF approaches described in Table 1 for (a) perfect model and (b) imperfect model.
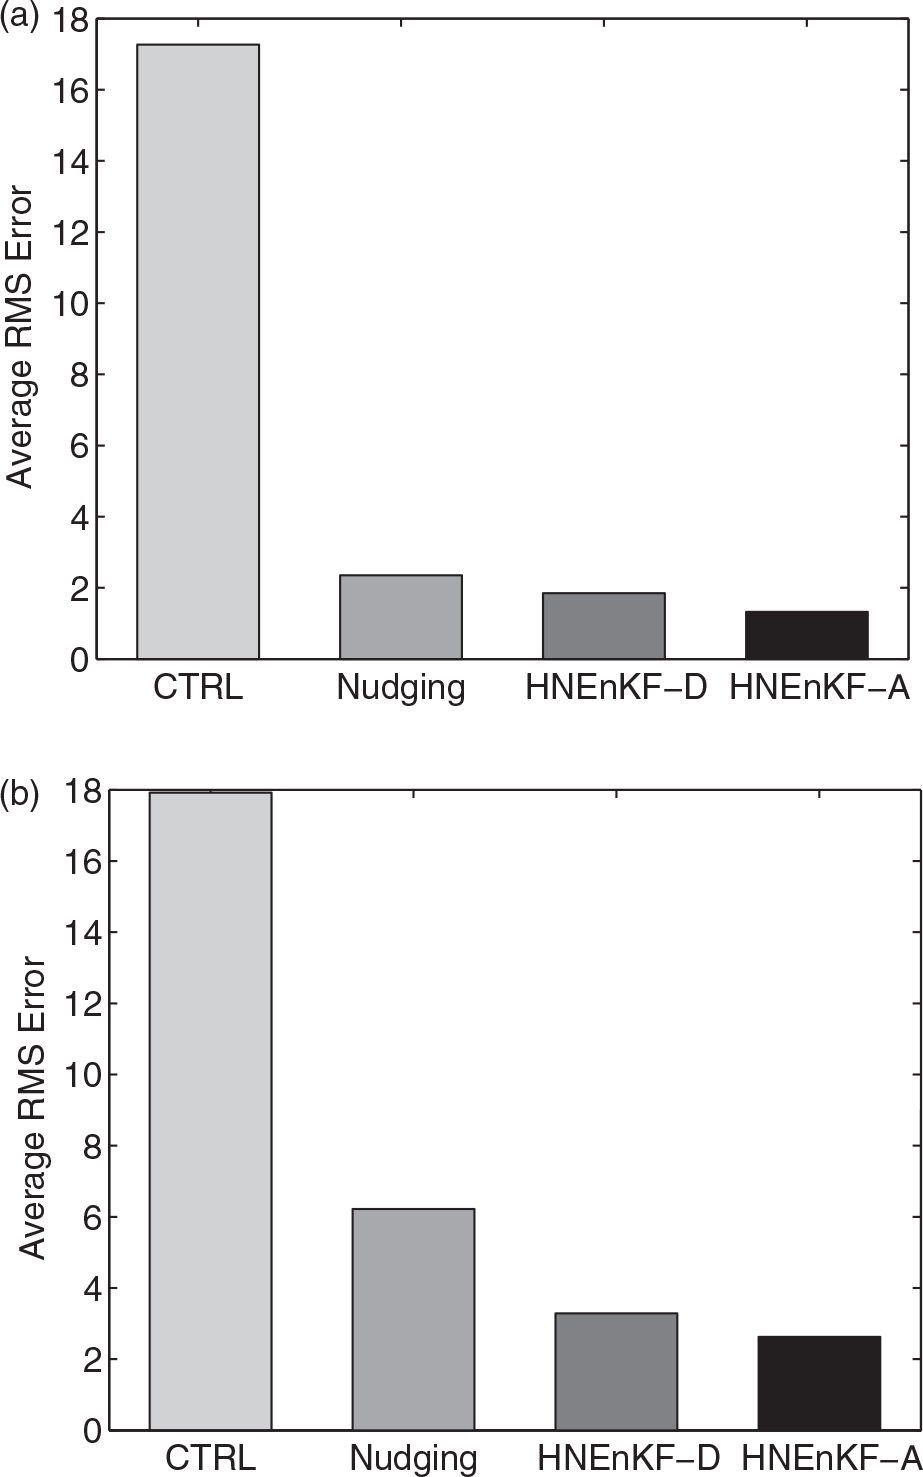
Fig. 4.
The average hybrid nudging coefficients in the 3000-step period set-up in each equation for (a) experiment HNEnKF-D and (b) experiment HNEnKF-A. The dashed line denotes the magnitude of the nudging coefficient used in the traditional nudging approach.
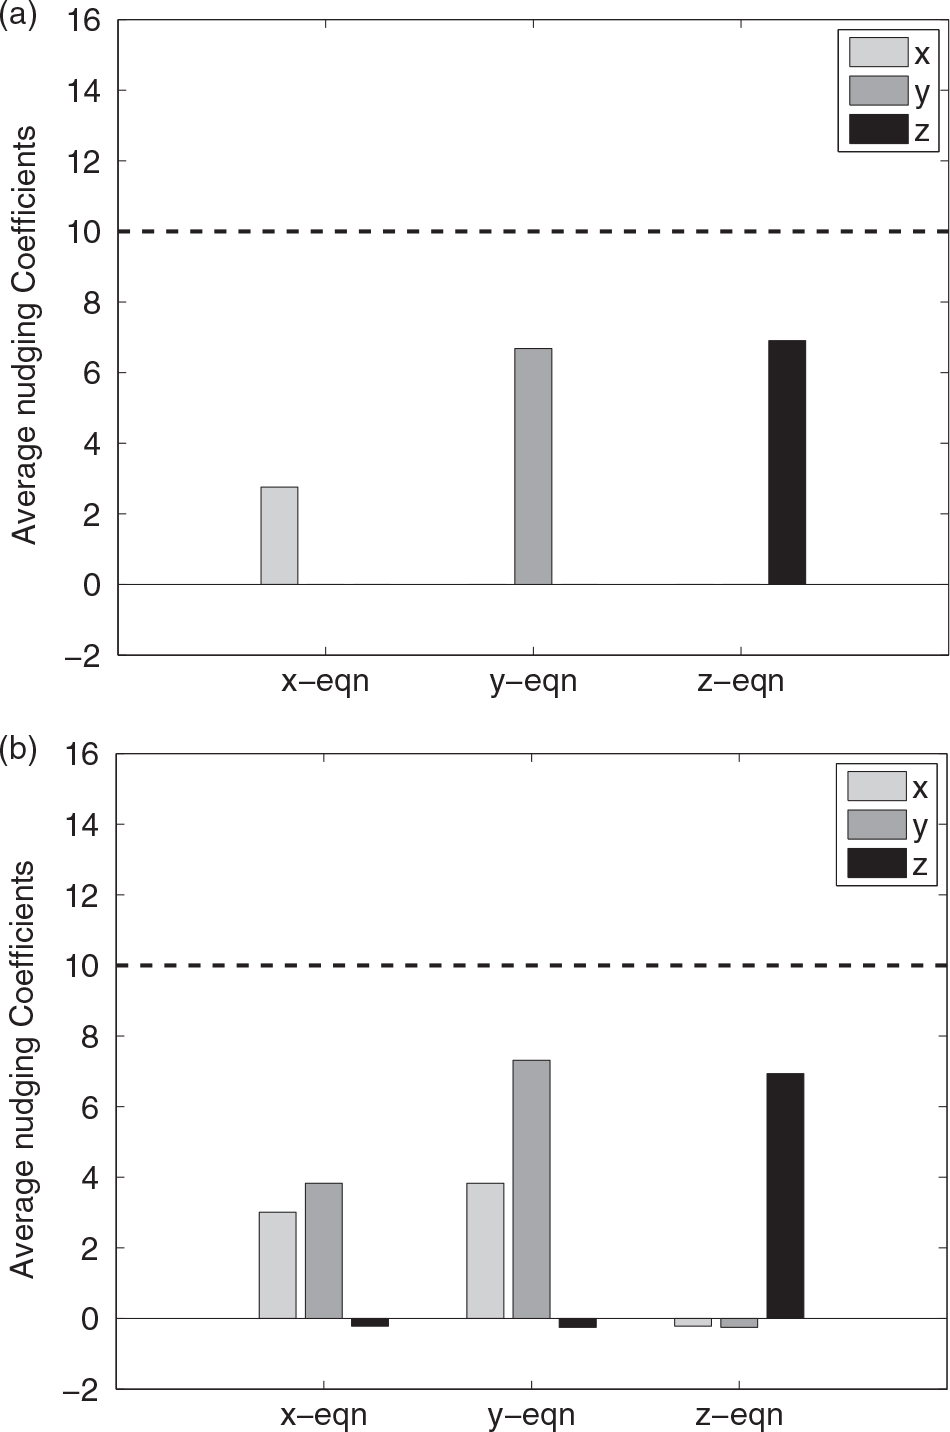
Fig. 5.
The average performance metrics over the 3000-step dynamic-analysis period set-up for the different data assimilation methods described in Table 1 with various observation frequencies of one per 10 time steps (OF10), one per 25 time steps (OF25) and one per 50 time steps (OF50), under a perfect model assumption for (a) RMS error and (b) DP. Smaller values are more desirable for both metrics.
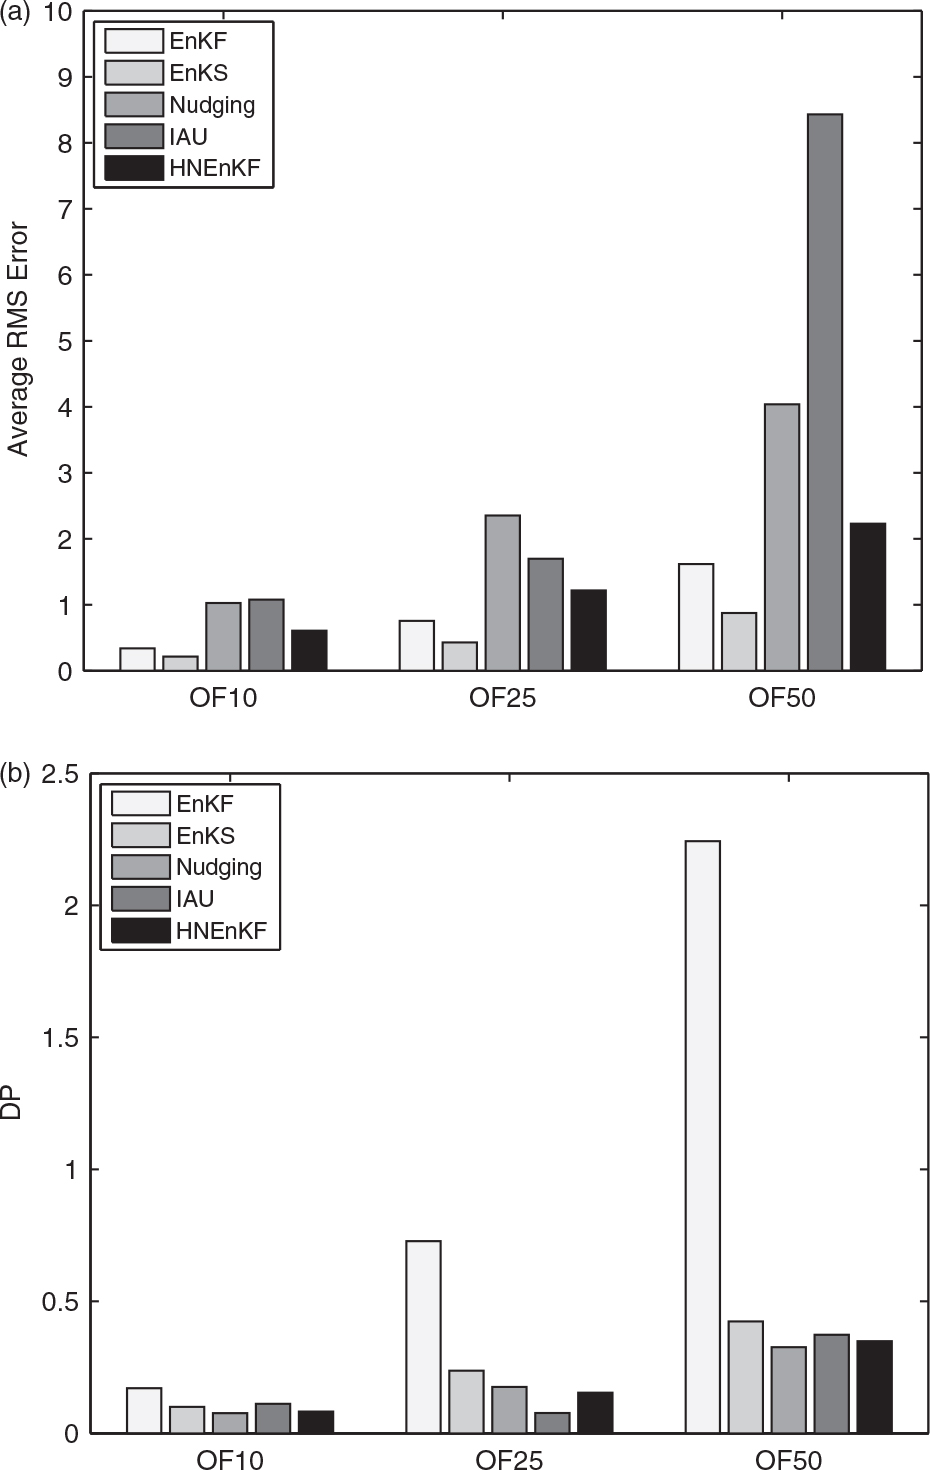
Fig. 6.
Same as Fig. 5, except for the imperfect model.
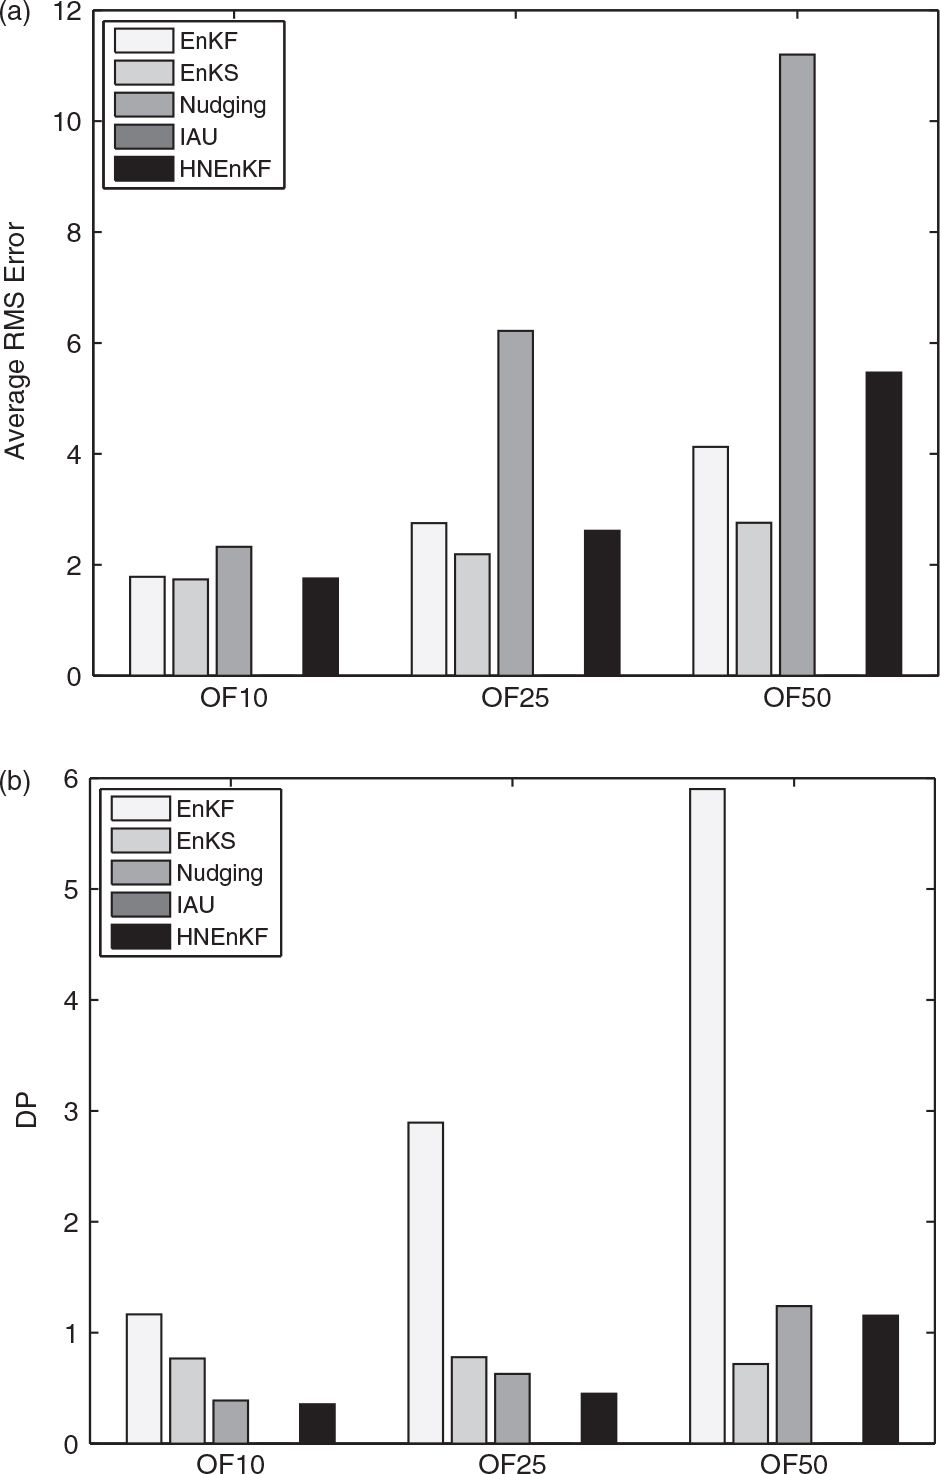
Fig. 7.
The ensemble spread and error of the 3000-step period set-up using an observation frequency one per 25 time steps. (a) Perfect model and (b) imperfect model.
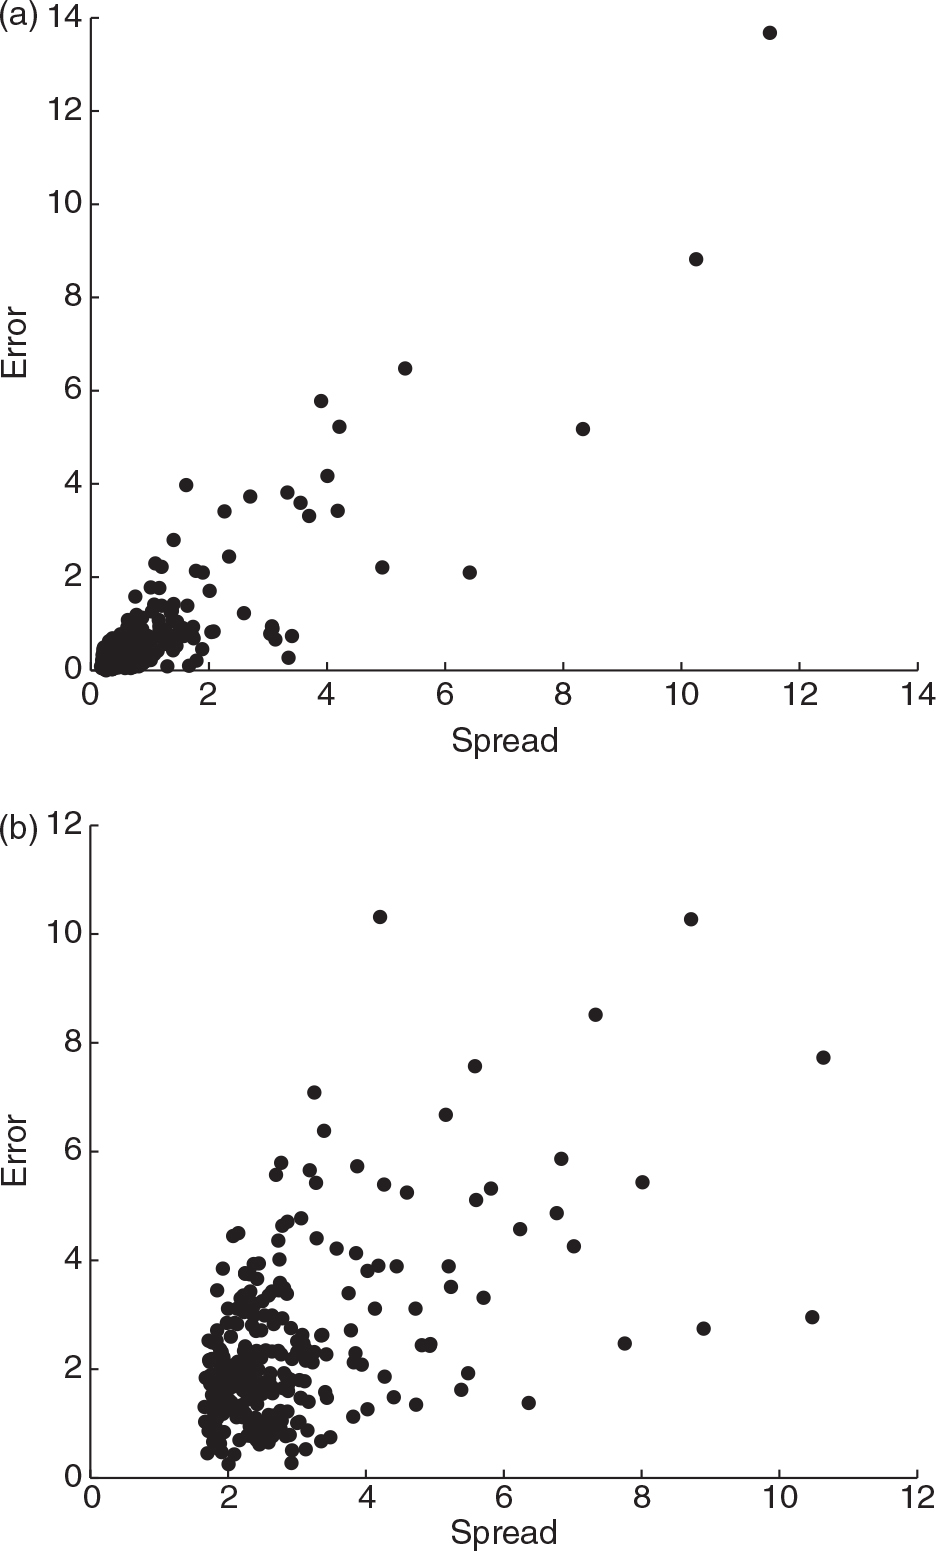
Table 2. The average RMS error in the 100 random initial conditions set-up for the data assimilation methods described in Table 1 with the default observation frequency (one per 25 time steps) for the perfect model
[i] There is significant difference (+) and no significant difference (−).
Table 3. Same as Table 2, except for the DP
Table 4. Same as Table 2, except for the imperfect model
Table 5. Same as Table 4, except for the DP
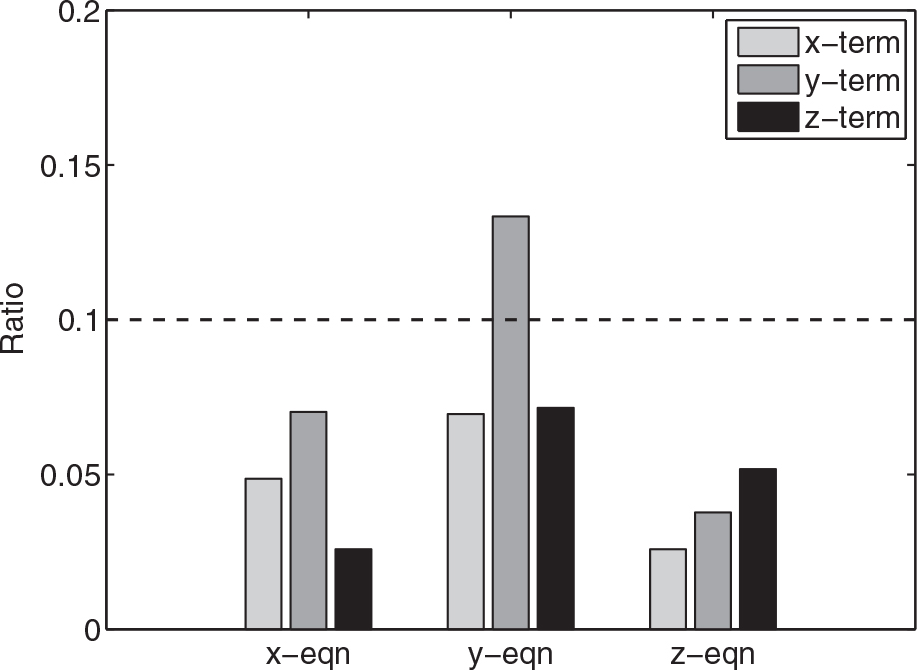
Fig. 8.
The average ratios of the hybrid nudging terms in each equation compared with the sum of the physical terms for the 3000-step period set-up for Experiment HNEnKF. The dashed line denotes a ratio of 0.1, where the nudging term is an order of magnitude smaller than the sum of the physical forcing terms.