
Fig. 1.
Map of the Faroe-Shetland Channel (FSC) region including bathymetry and a schematic representation of the large-scale surface currents. South of the Norwegian-Sea gyre, the inflow from the Atlantic is seen to have two main branches: one, constituted by Modified North Atlantic Waters (MNAW), which crosses the Iceland-Faroe Ridge west of the Faroes, and an eastern branch traversing the Wyville-Thomson Ridge (WTR) which transports North Atlantic Waters (NAW). Green squares show the hydrographic stations of the Nòlsoy-Flugga (NF) section; temperature–salinity diagrams are based on the station in magenta. The black line in the middle of the channel is used for time-latitude diagram analysis.
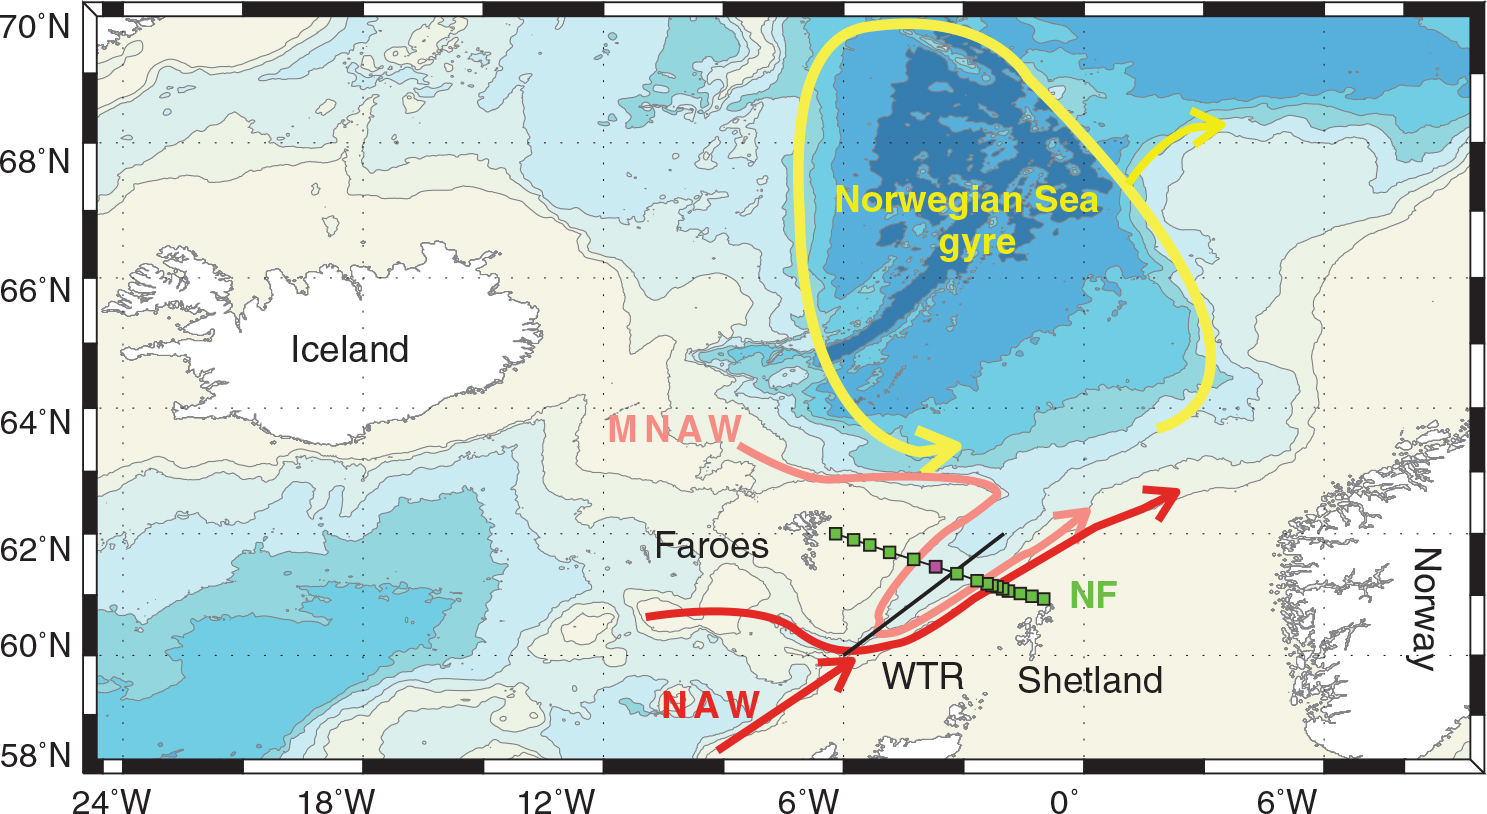
Fig. 2.
Suite of absolute dynamic topographies (cm) and associated geostrophic-velocity vectors from November 2009 to February 2010. Black lines represent isobaths with 500 m spacing down to 1500 m. The diagram illustrates the sequence of events associated with the deflection of the Shetland-slope current.

Fig. 3.
Sequence of the velocity magnitudes (speeds) in]centimetre per second overlaid by the associated geostrophic-velocity vectors for the same periods as in Fig. 2.
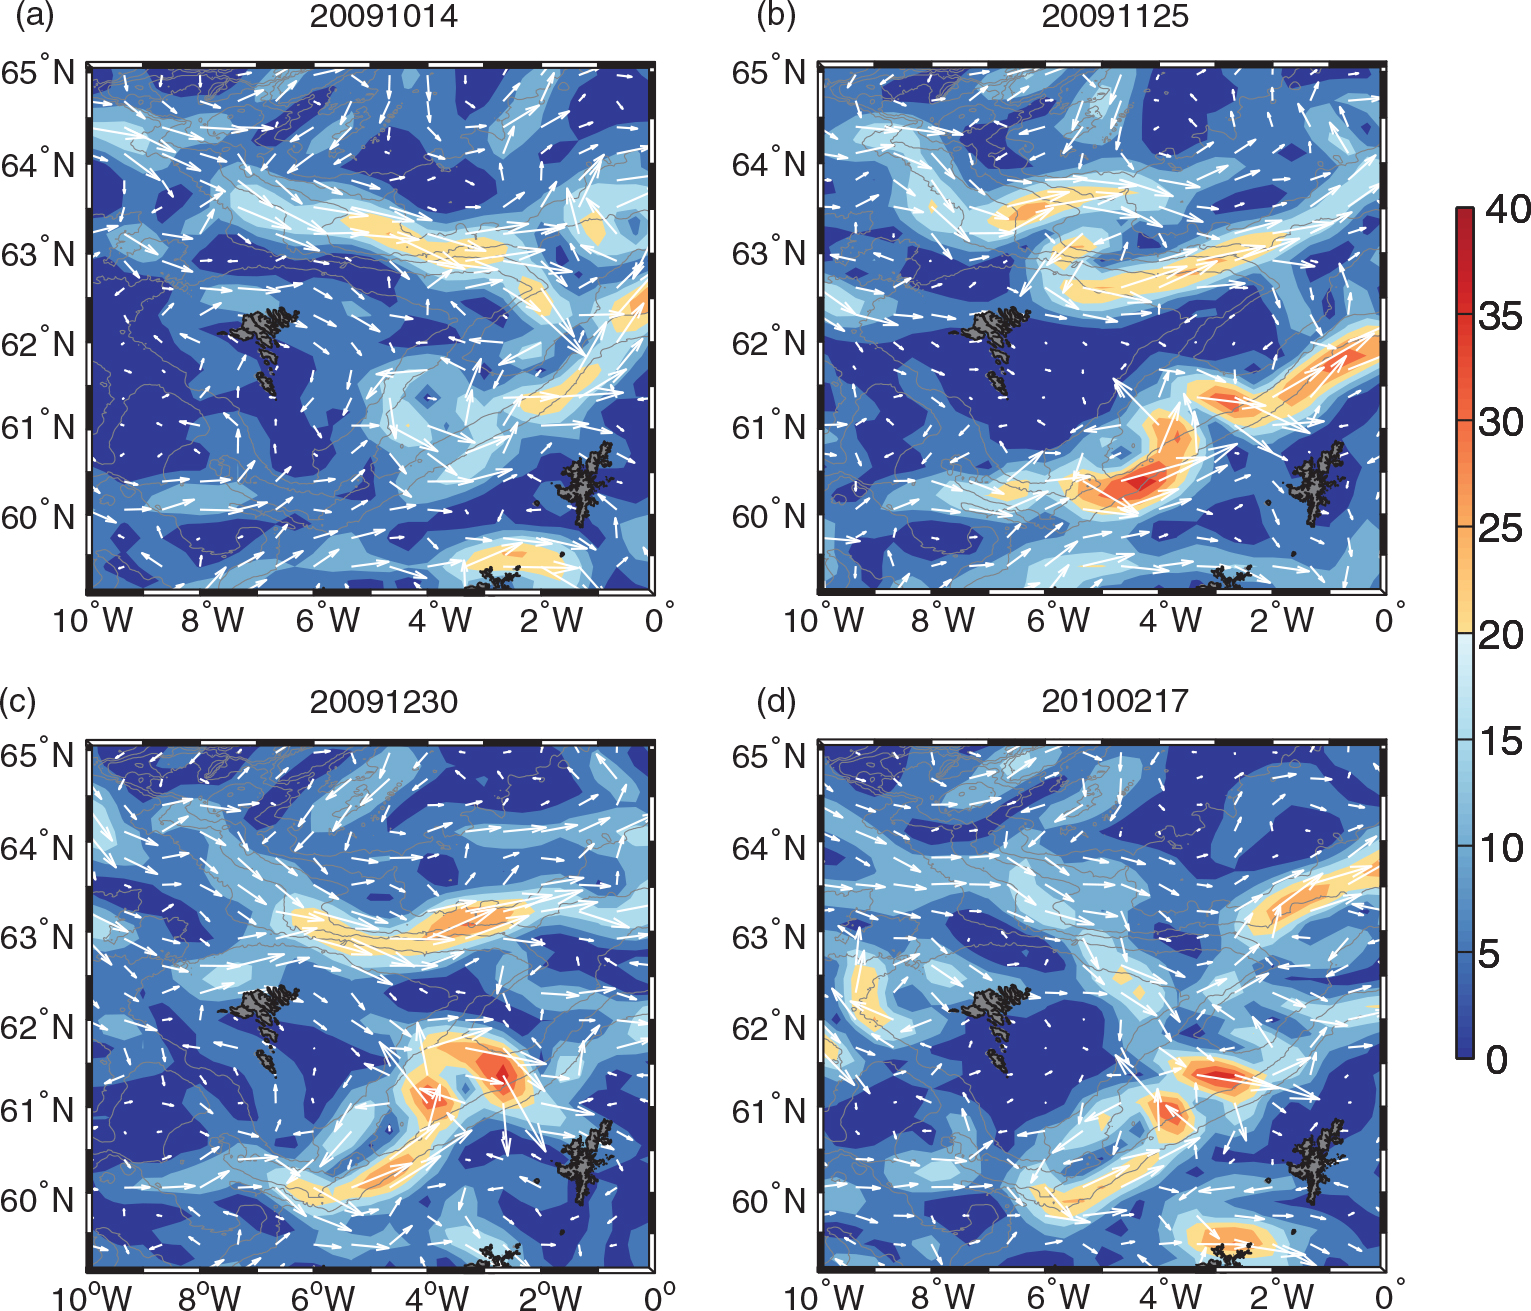
Fig. 4.
September 2009–March 2010 time-latitude (Hovmøller) diagram of the weekly along-channel absolute dynamic topography gradient (low-passed using a fourth-order Butterworth filter with an 8-week cut-off). A lag of around 2 weeks between the cyclonic and anticyclonic eddy is clearly discernible.
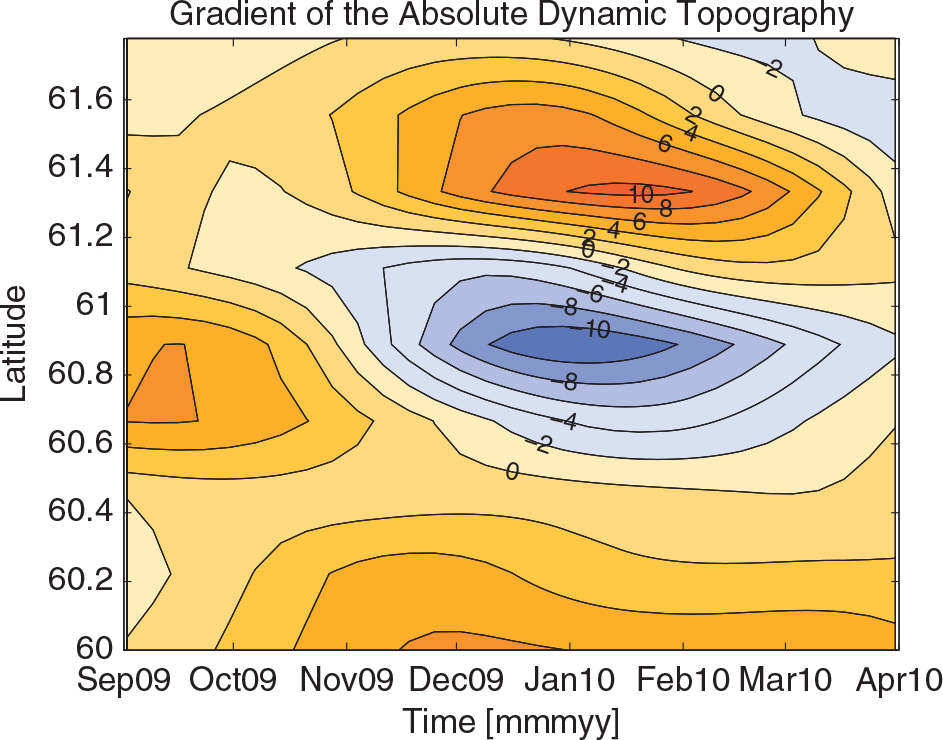
Fig. 5.
Composites of satellite-derived sea surface temperatures around the Faroe-Shetland Channel (F=Faroes; S=Shetland) from 6 to 12 October, 19 to 25 November, and 3 to 9 December 2009 showing the evolution of the cold-core eddy and the deflection of the warm Shetland-slope current. (Courtesy of NEODAAS.)
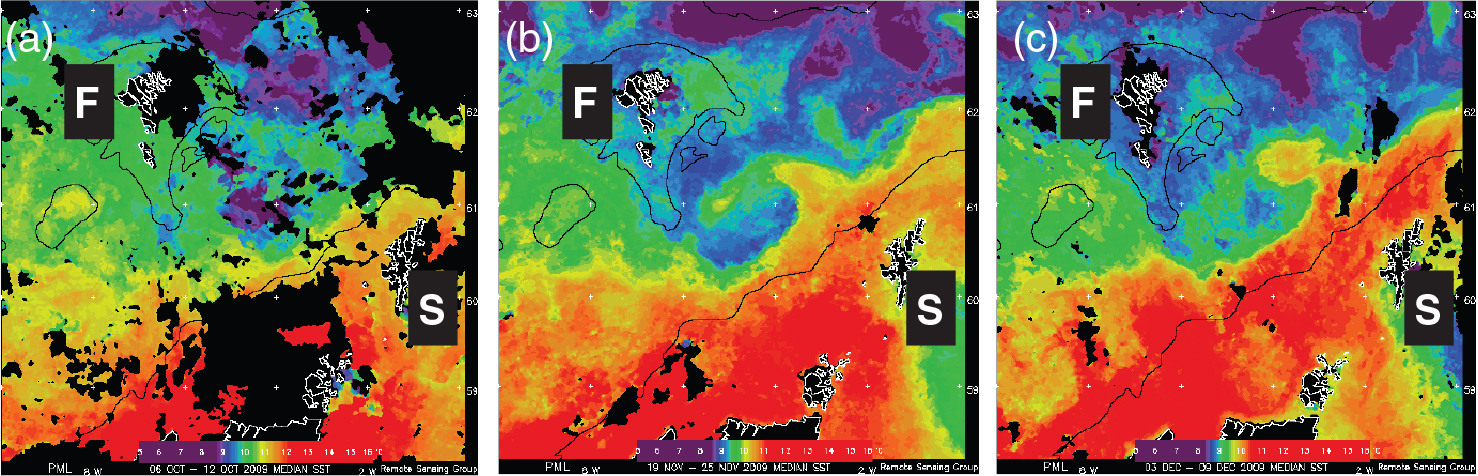
Fig. 6.
Salinity distribution across the Nòlsoy-Flugga section on 12 October and 8 December 2009. These surveys are chosen to show the effects of cyclonic and anticyclonic surface-water motion, respectively. The blue 35 psu contours highlight the shoaling and deepening of the halocline. Black 35.4 psu contours delimit the warm cores of the northward-directed slope current. The cross-channel SLA distributions from the same days as the hydrography are also included on top of the diagrams.
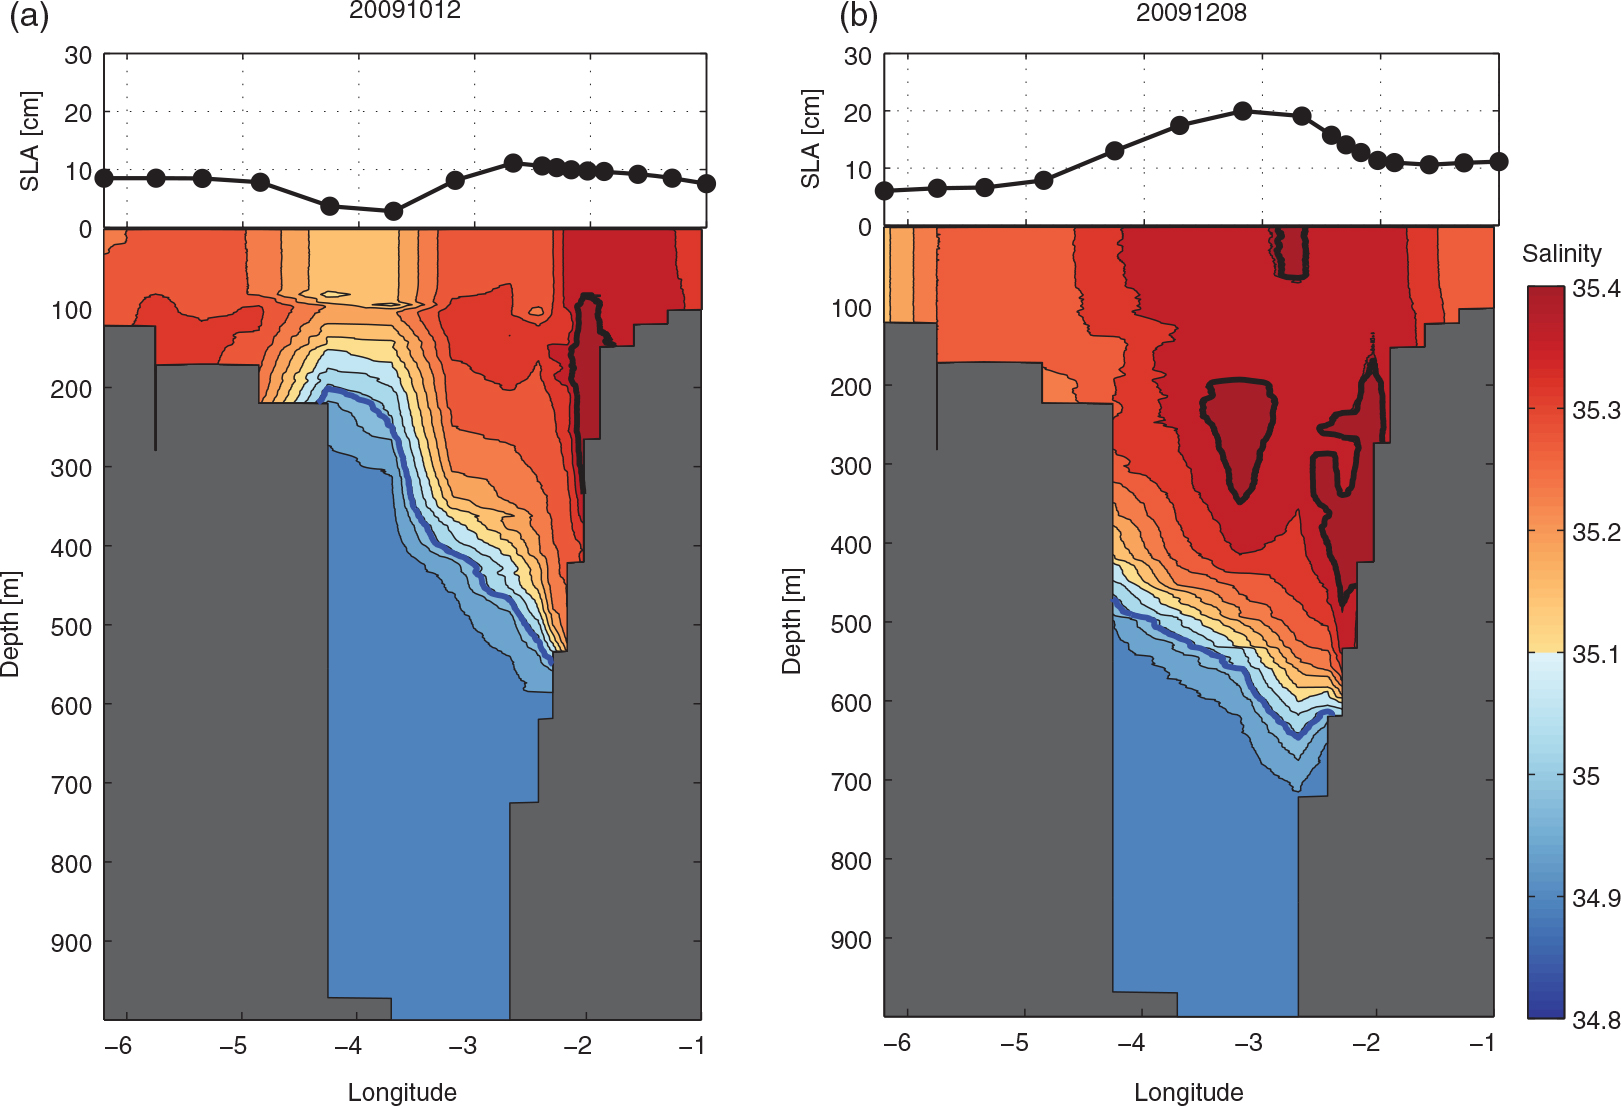
Fig. 7.
Temperature–salinity profiles from a centrally located station on the Nòlsoy-Flugga section (magenta in Fig. 1) from the same surveys as represented in Fig. 6. The blue profile (12 October) shows the presence of low-saline Modified North Atlantic water (MNAW) related to the cyclonic circulation; the red profile (8 December) comprises North Atlantic water (NAW) of higher salinity due to the deflection of the Shetland-slope current and the resulting anticyclonic circulation. The cold Norwegian-Sea deep water (NSDW) is also shown.
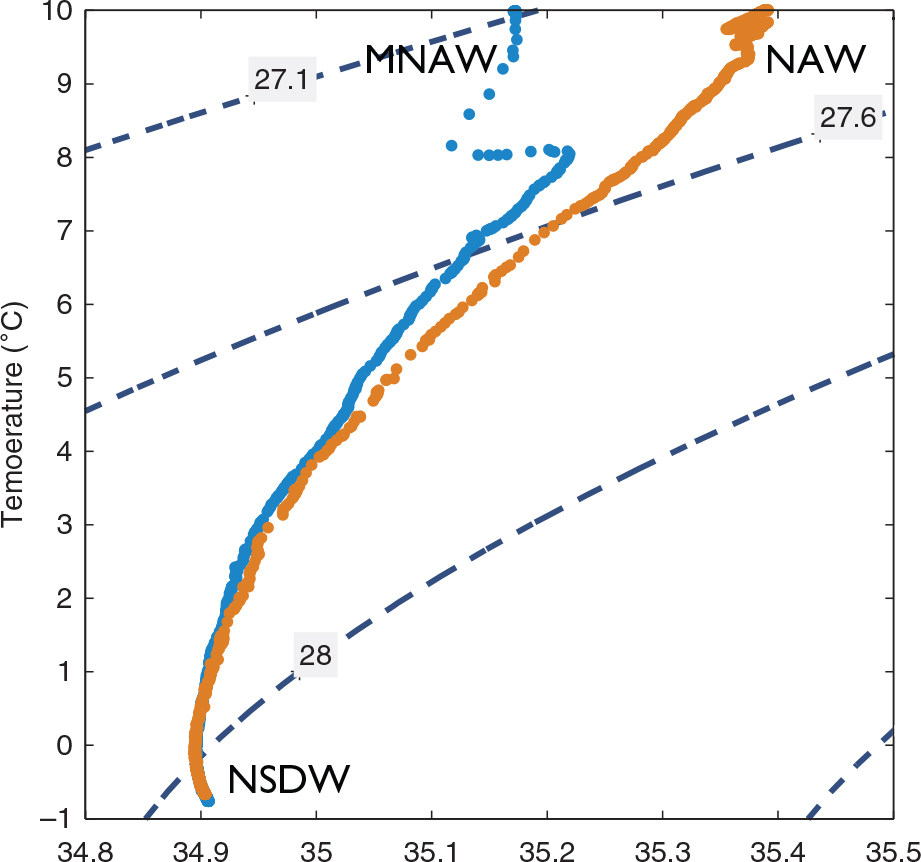
Fig. 8.
Composites of observed ADT distributions and their associated velocity vectors for extremely high (≥3) and low (≤−3) NAO-index weeks. During conditions of high NAO the sea-surface height (SSH) field is depressed and the associated flow pattern resembles the ‘standard’ circulation illustrated in Fig. 1. For low NAO, the depressed SSH has retreated northwards and a prominent bulge intrudes over the deeper parts of the Faroe-Shetland Channel.
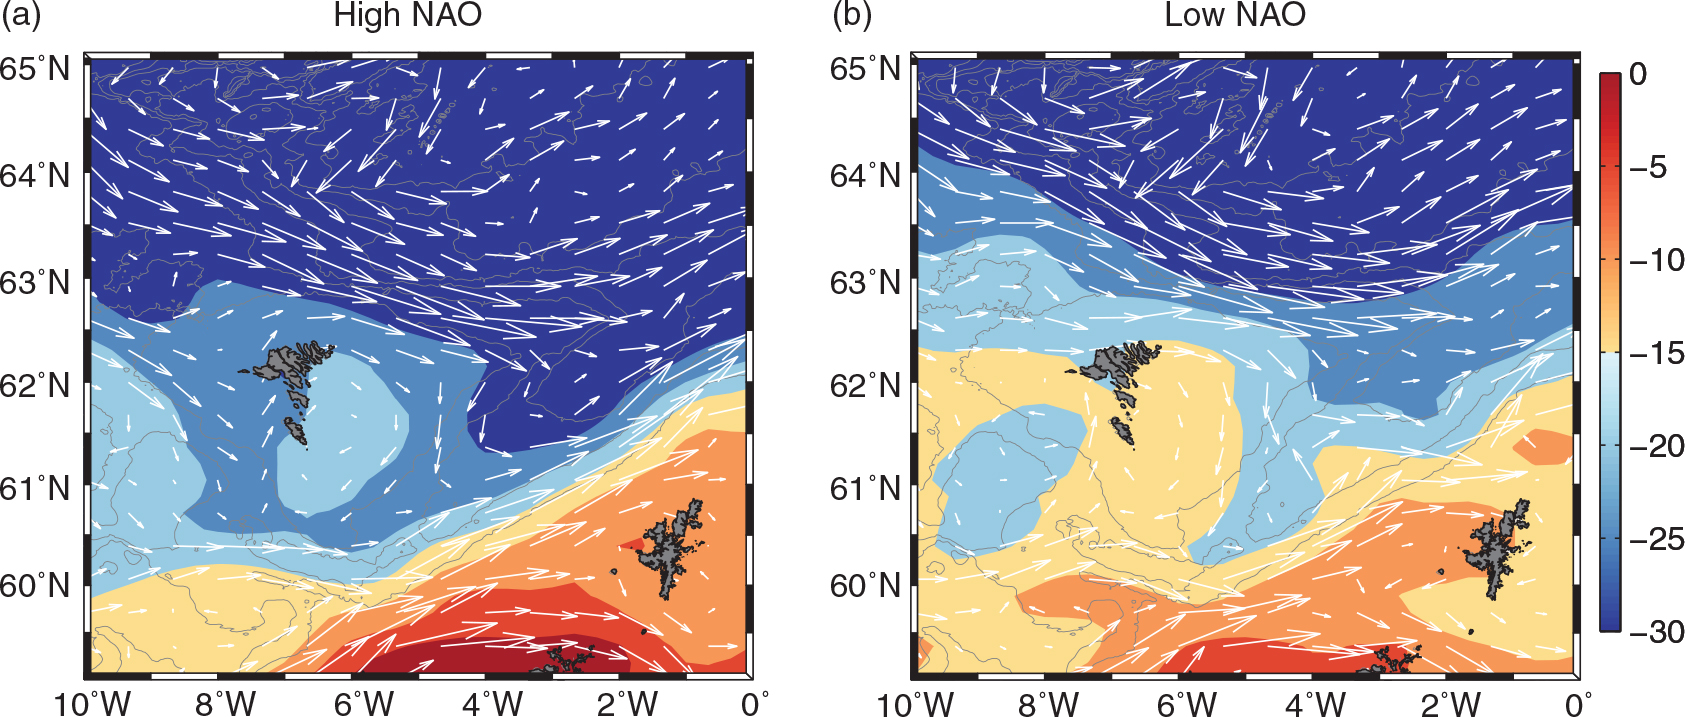
Fig. 9.
Absolute dynamic topography isolines originating from the Nordic Seas (−30 cm) and from the North Atlantic (−10 cm) for the same high- and low-NAO-index weeks used when constructing the composites shown in Fig. 8. Black lines with a spacing of 500 m pertain to the bathymetry. The diagrams are aimed at clarifying the degree of topographic control exerted on the flow during high and low phases of the NAO.
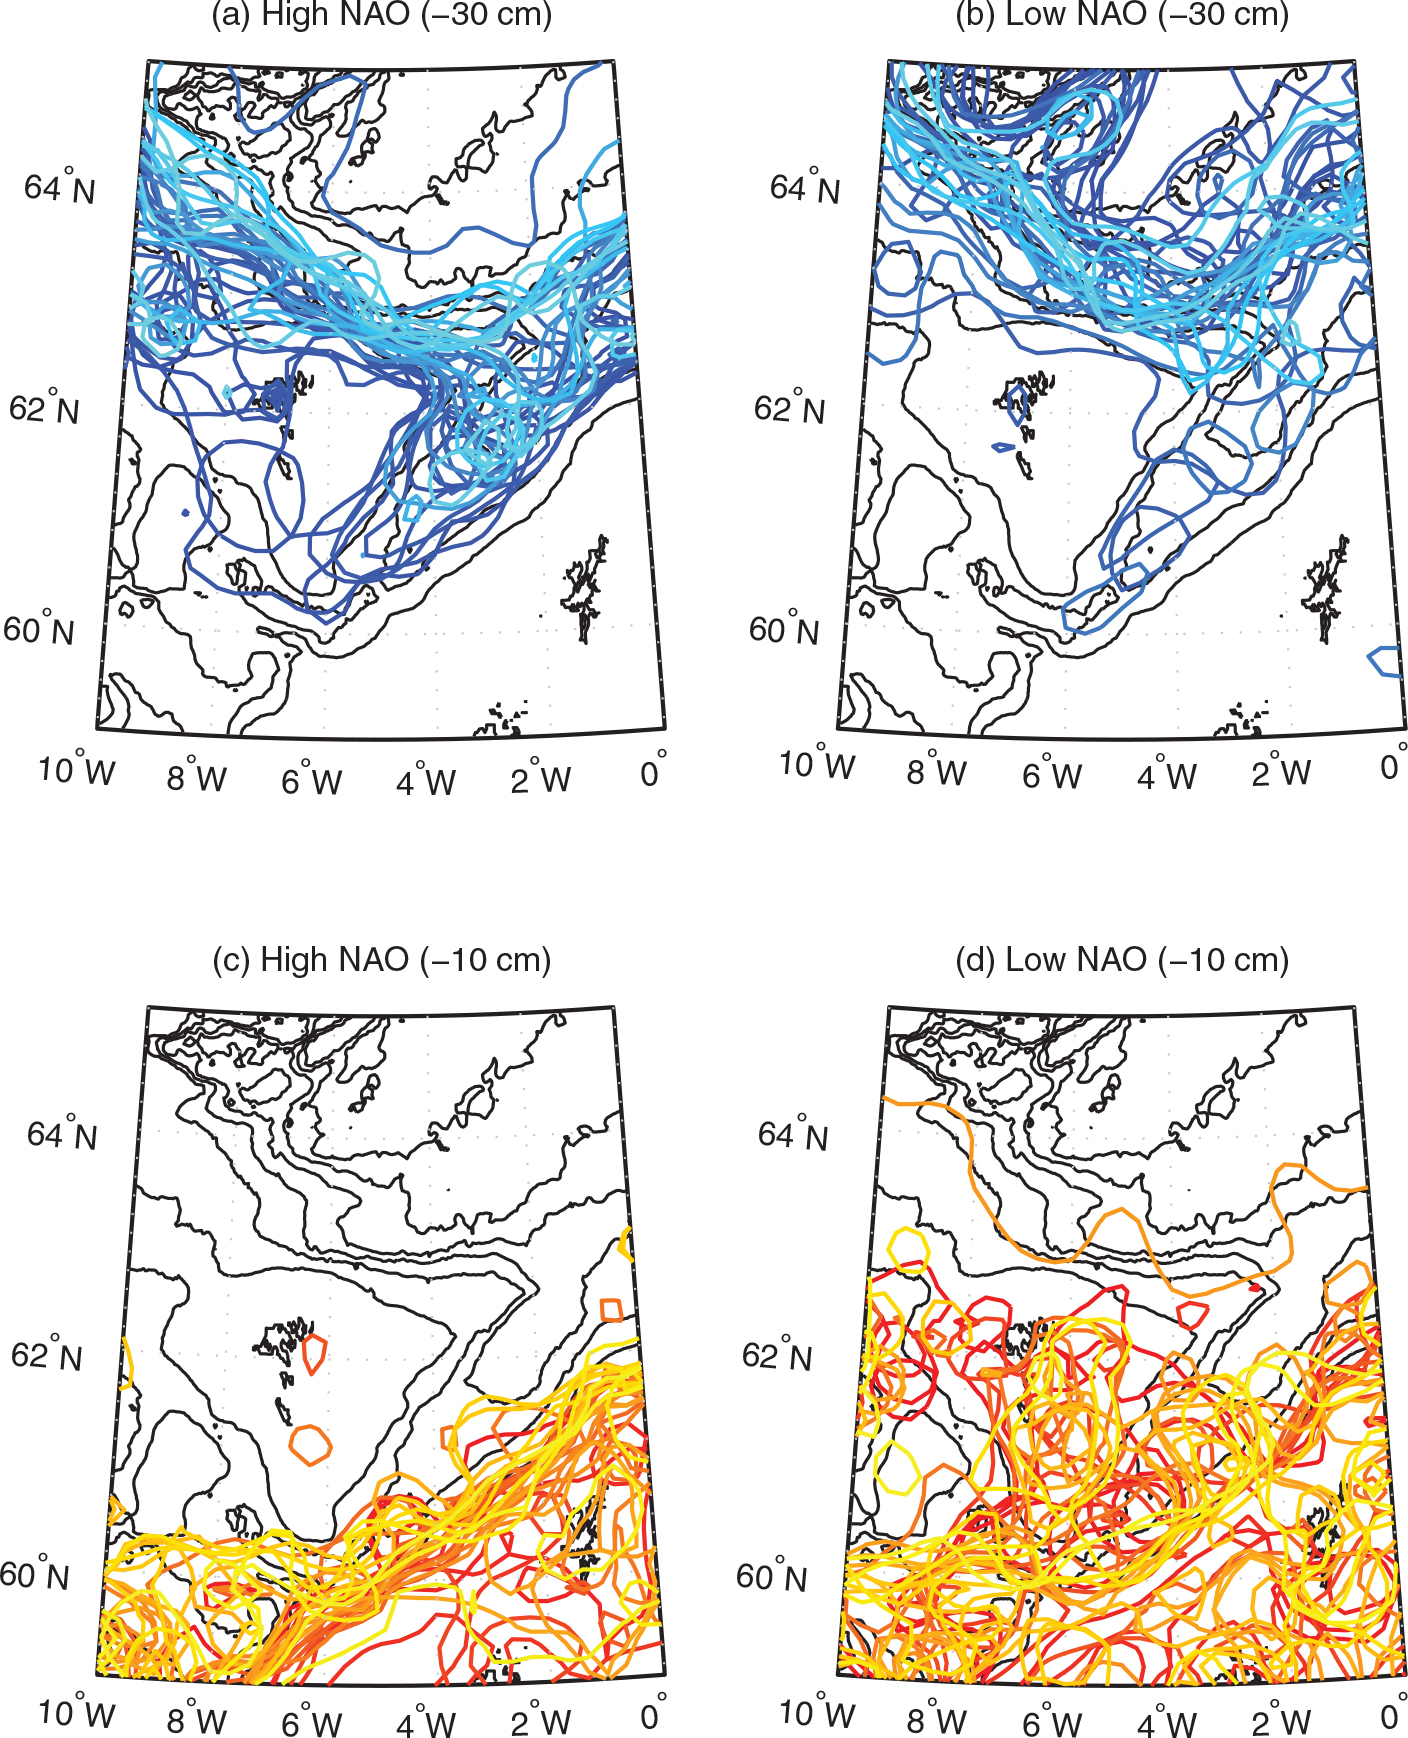
Fig. 10.
Composites of the eddy kinetic energy (EKE) distributions for high (≥3) and low (≤−3) NAO-index weeks, see Fig. 8. The overall EKE values in the high-NAO case are smaller than for a low NAO. Furthermore, the locations of the maxima do not correspond, indicating qualitatively different flow fields.
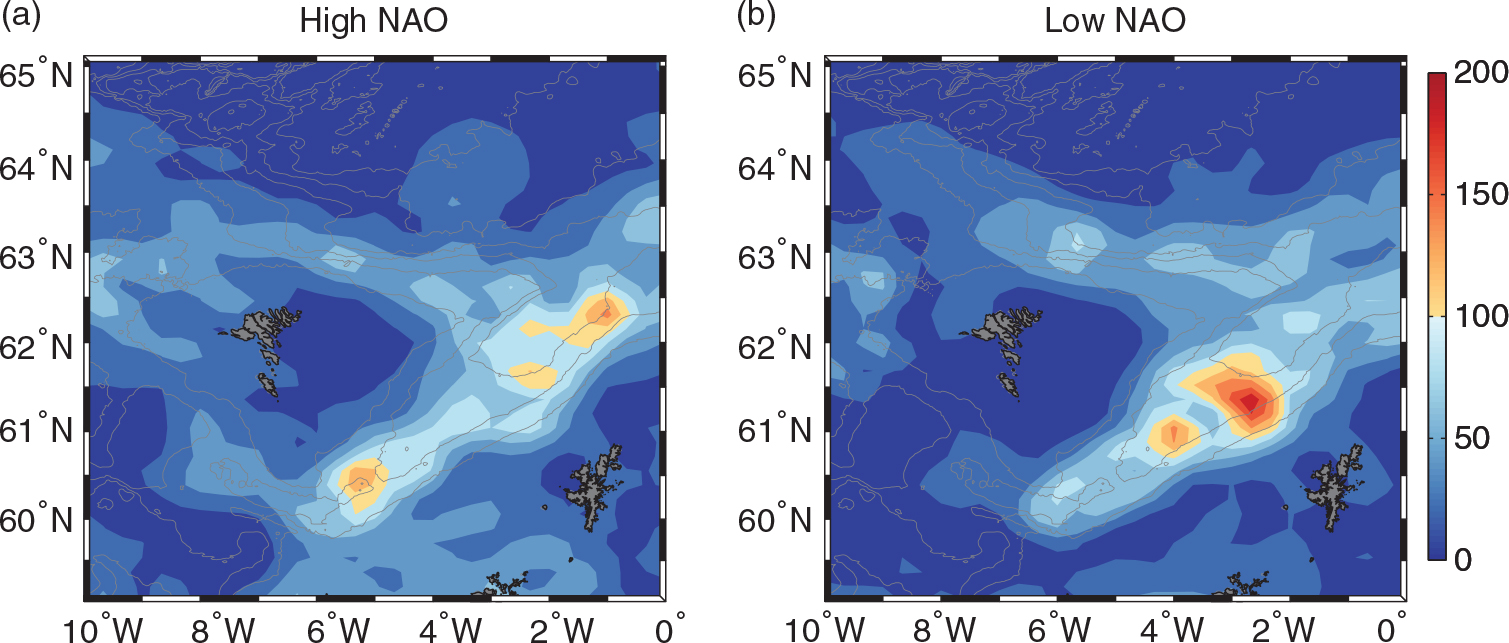
Fig. 11.
Schematic diagram summarising the main results related to the low-NAO regime. The large-scale flow pattern and its associated eddies clearly differ from the ‘standard’ surface circulation shown in Fig. 1. Note the accumulation of North Atlantic Water in the Faroe-Shetland Channel (FSC) related to the deflection of the Shetland-slope current accompanied by an anticyclonic circulation. The northward migration of the recirculation in the FSC associated with the contraction of the Norwegian-Sea gyre is also in clear evidence.
