
Fig. 1.
Maps showing the location of GSL and GBL within the Mackenzie River Basin and meteorological stations.
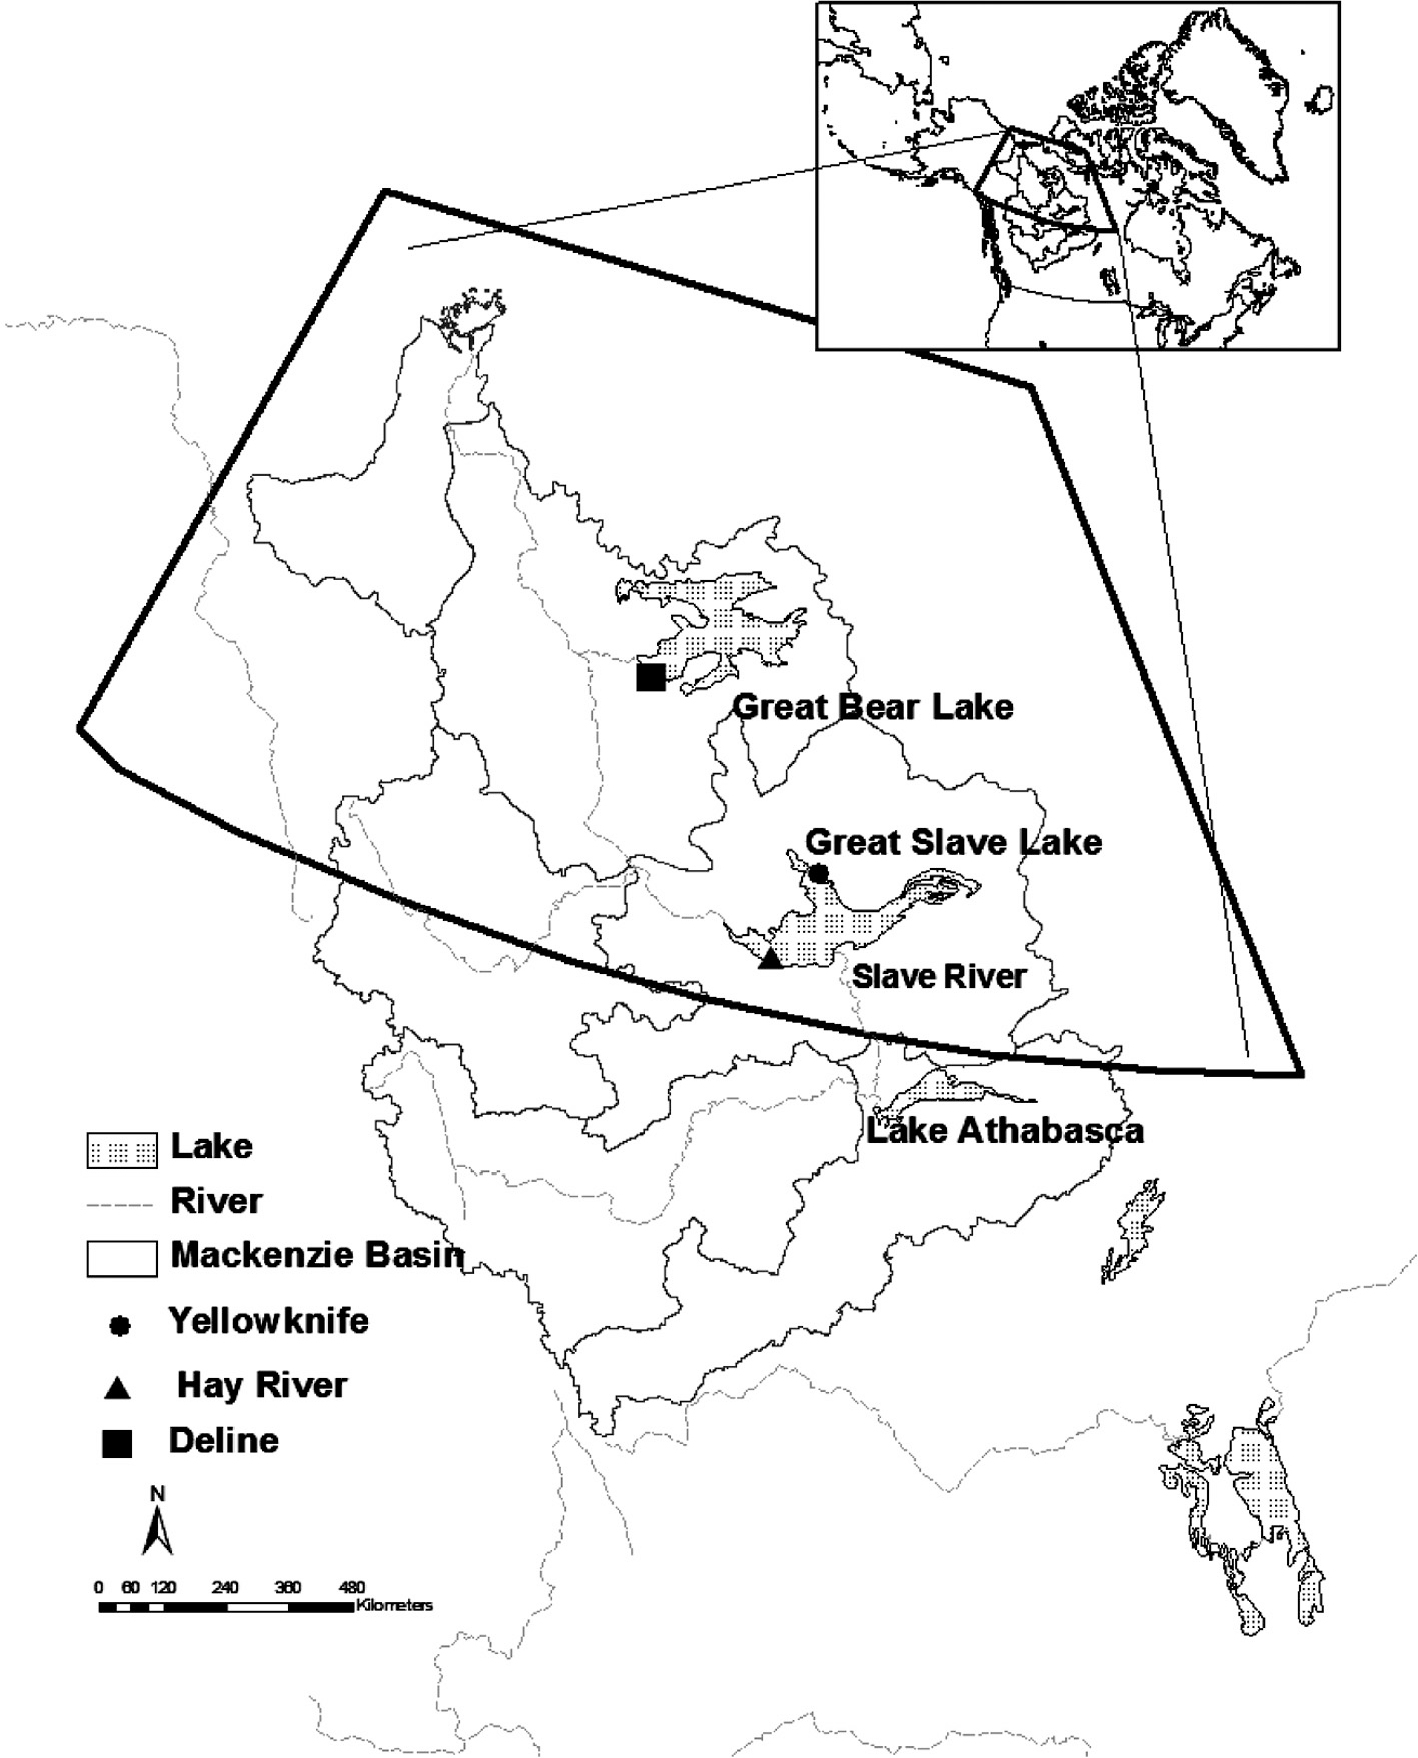
Table 1. Physical characteristics of GSL and GBL
[i] Z ML is the effective mixed layer depth.
[ii] Z ROI is the actual lake depth at each site (region of interest, ROI).
[iii] Z Max is the maximum depth.
[iv] Z Mean is the average depth.
[v] V is the lake volume.
[vi] A is the lake area.
[vii] Z ML is used in CLIMo simulations (see explanation in Section 3.3).
Fig. 2.
Comparison of modelled LSTs from CLIMo and FLake with MODIS-derived LSTs data during full year for 2002–2010: (a) Back Bay (Yellowknife station), (b) Hay River, (c) GSL (Main Basin) and (d) Deline-GBL.
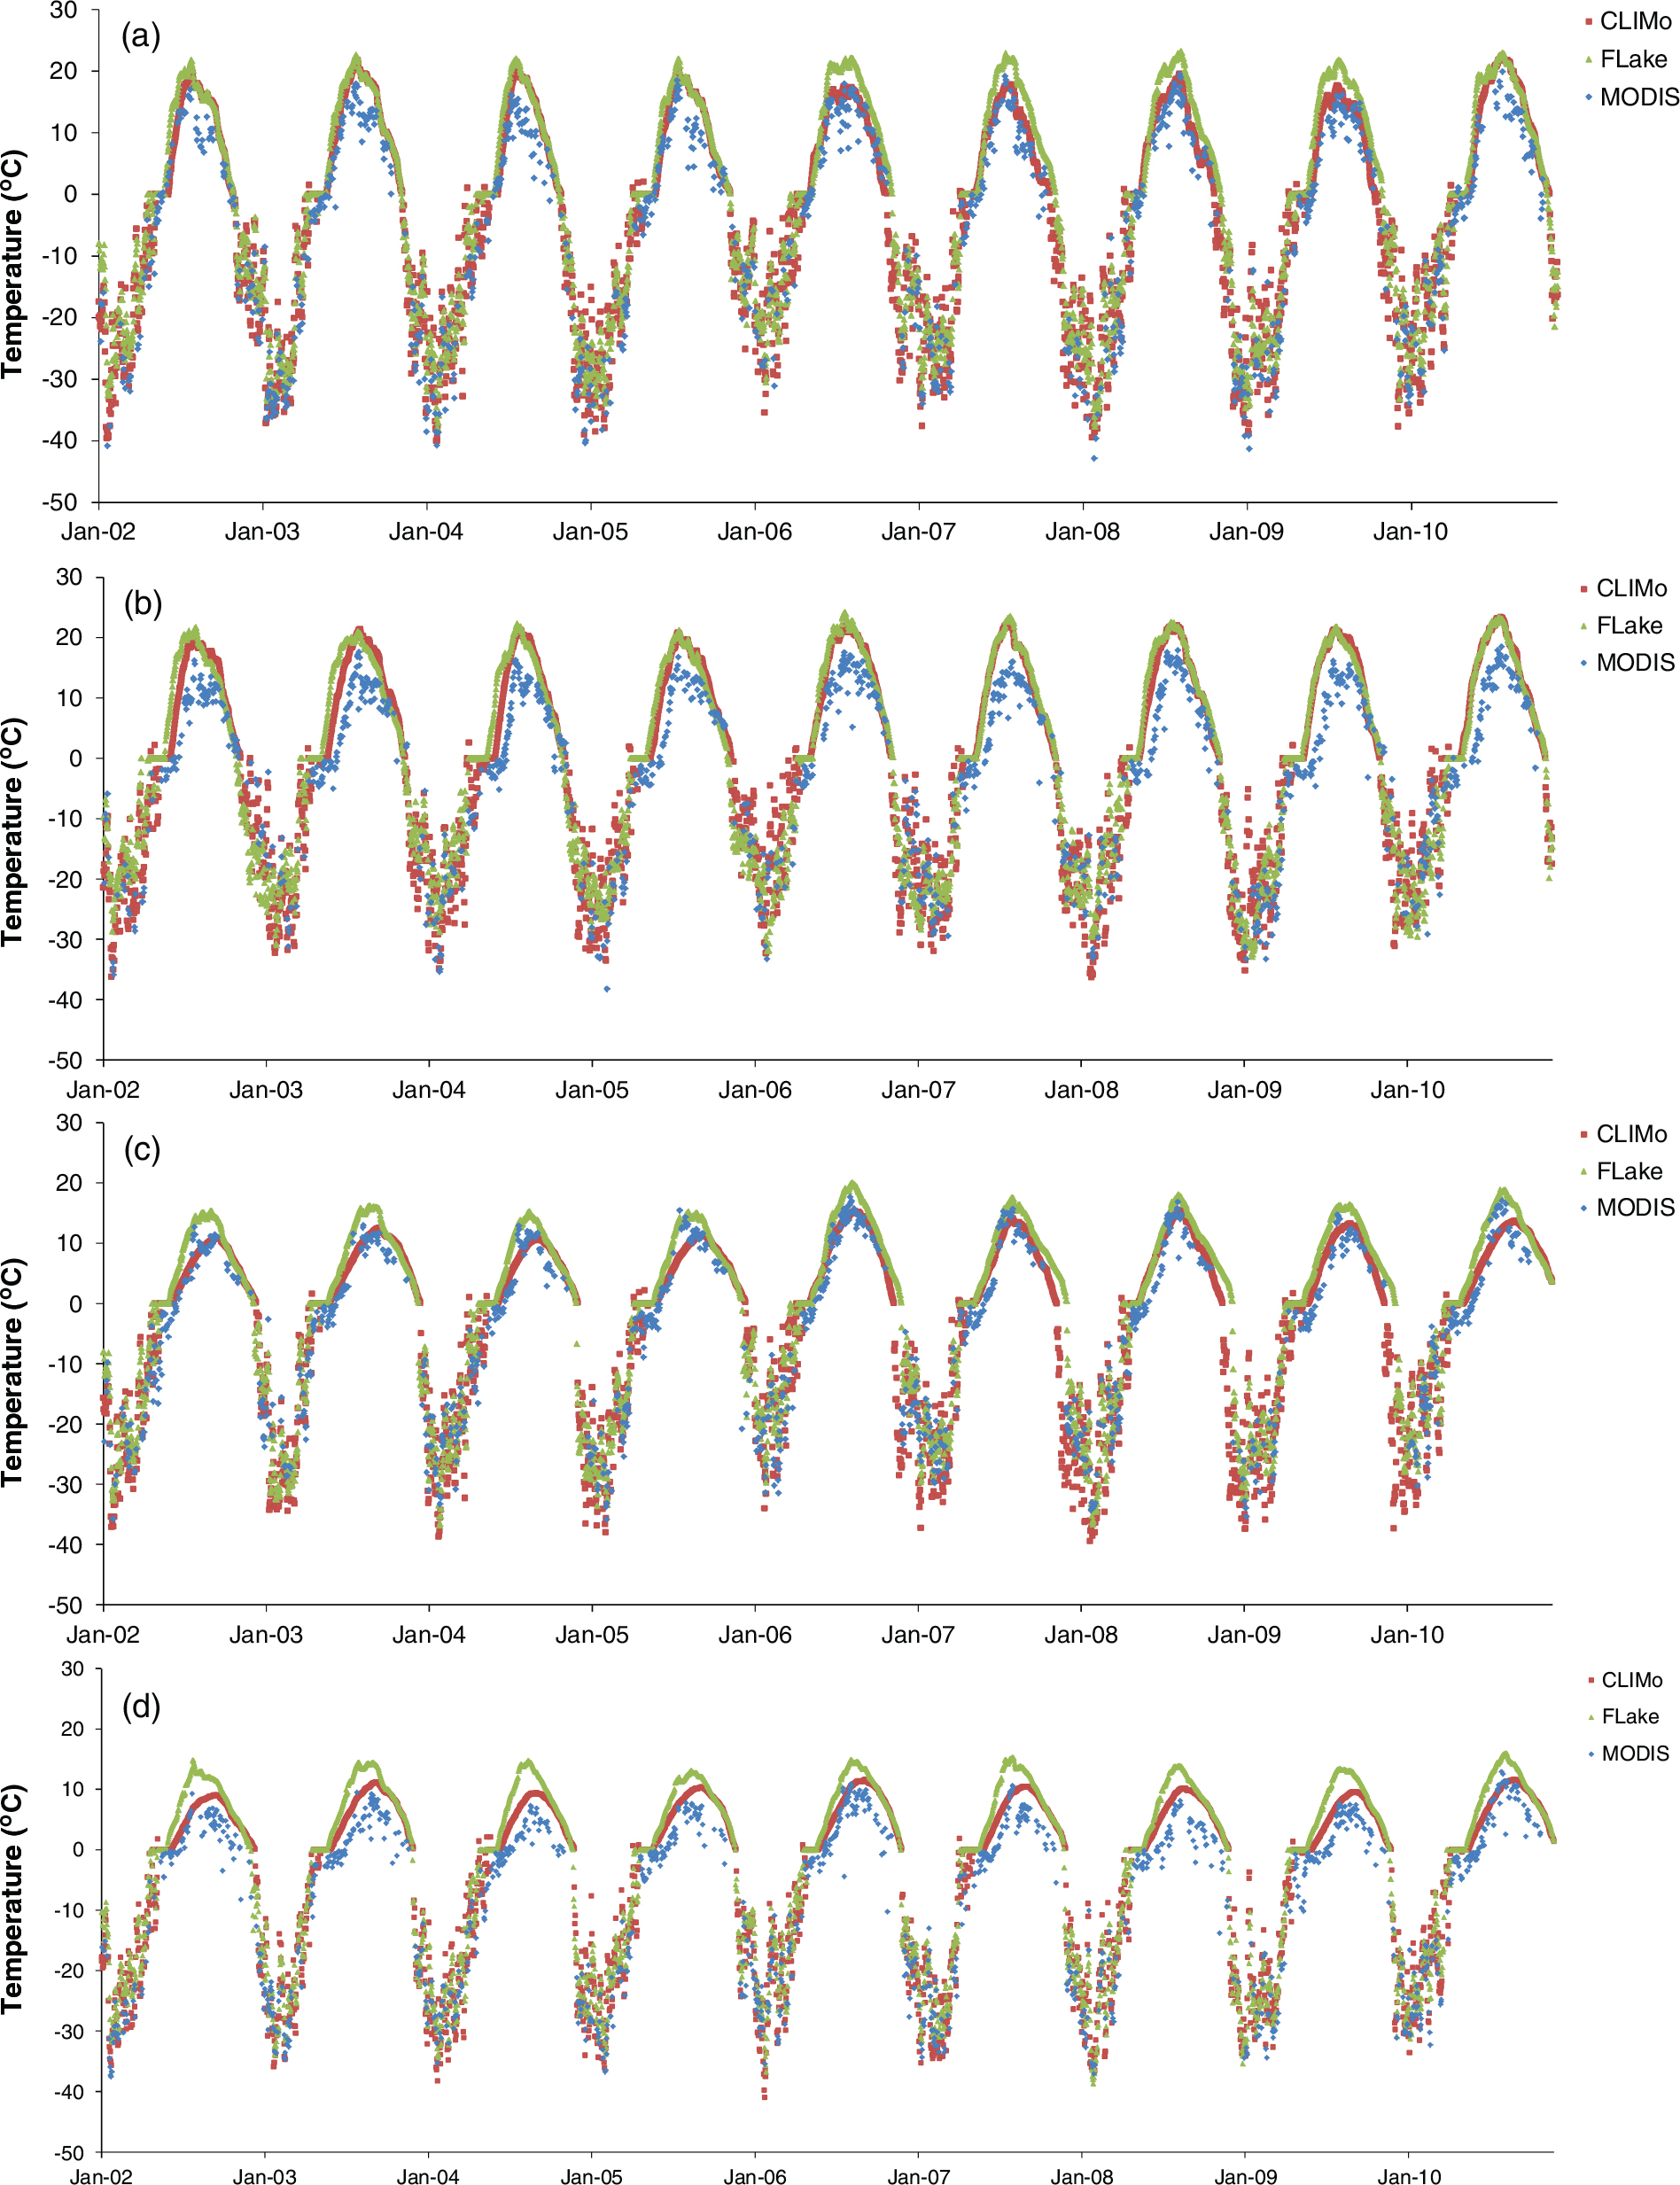
Fig. 3.
Comparison of modelled LSTs from CLIMo and FLake with MODIS-derived LSTs (°C) data during full year for 2002–2010: (a, b) Back Bay (Yellowknife station), (c, d) Hay River, (e, f) GSL (Main Basin) and (g, h) Deline-GBL.
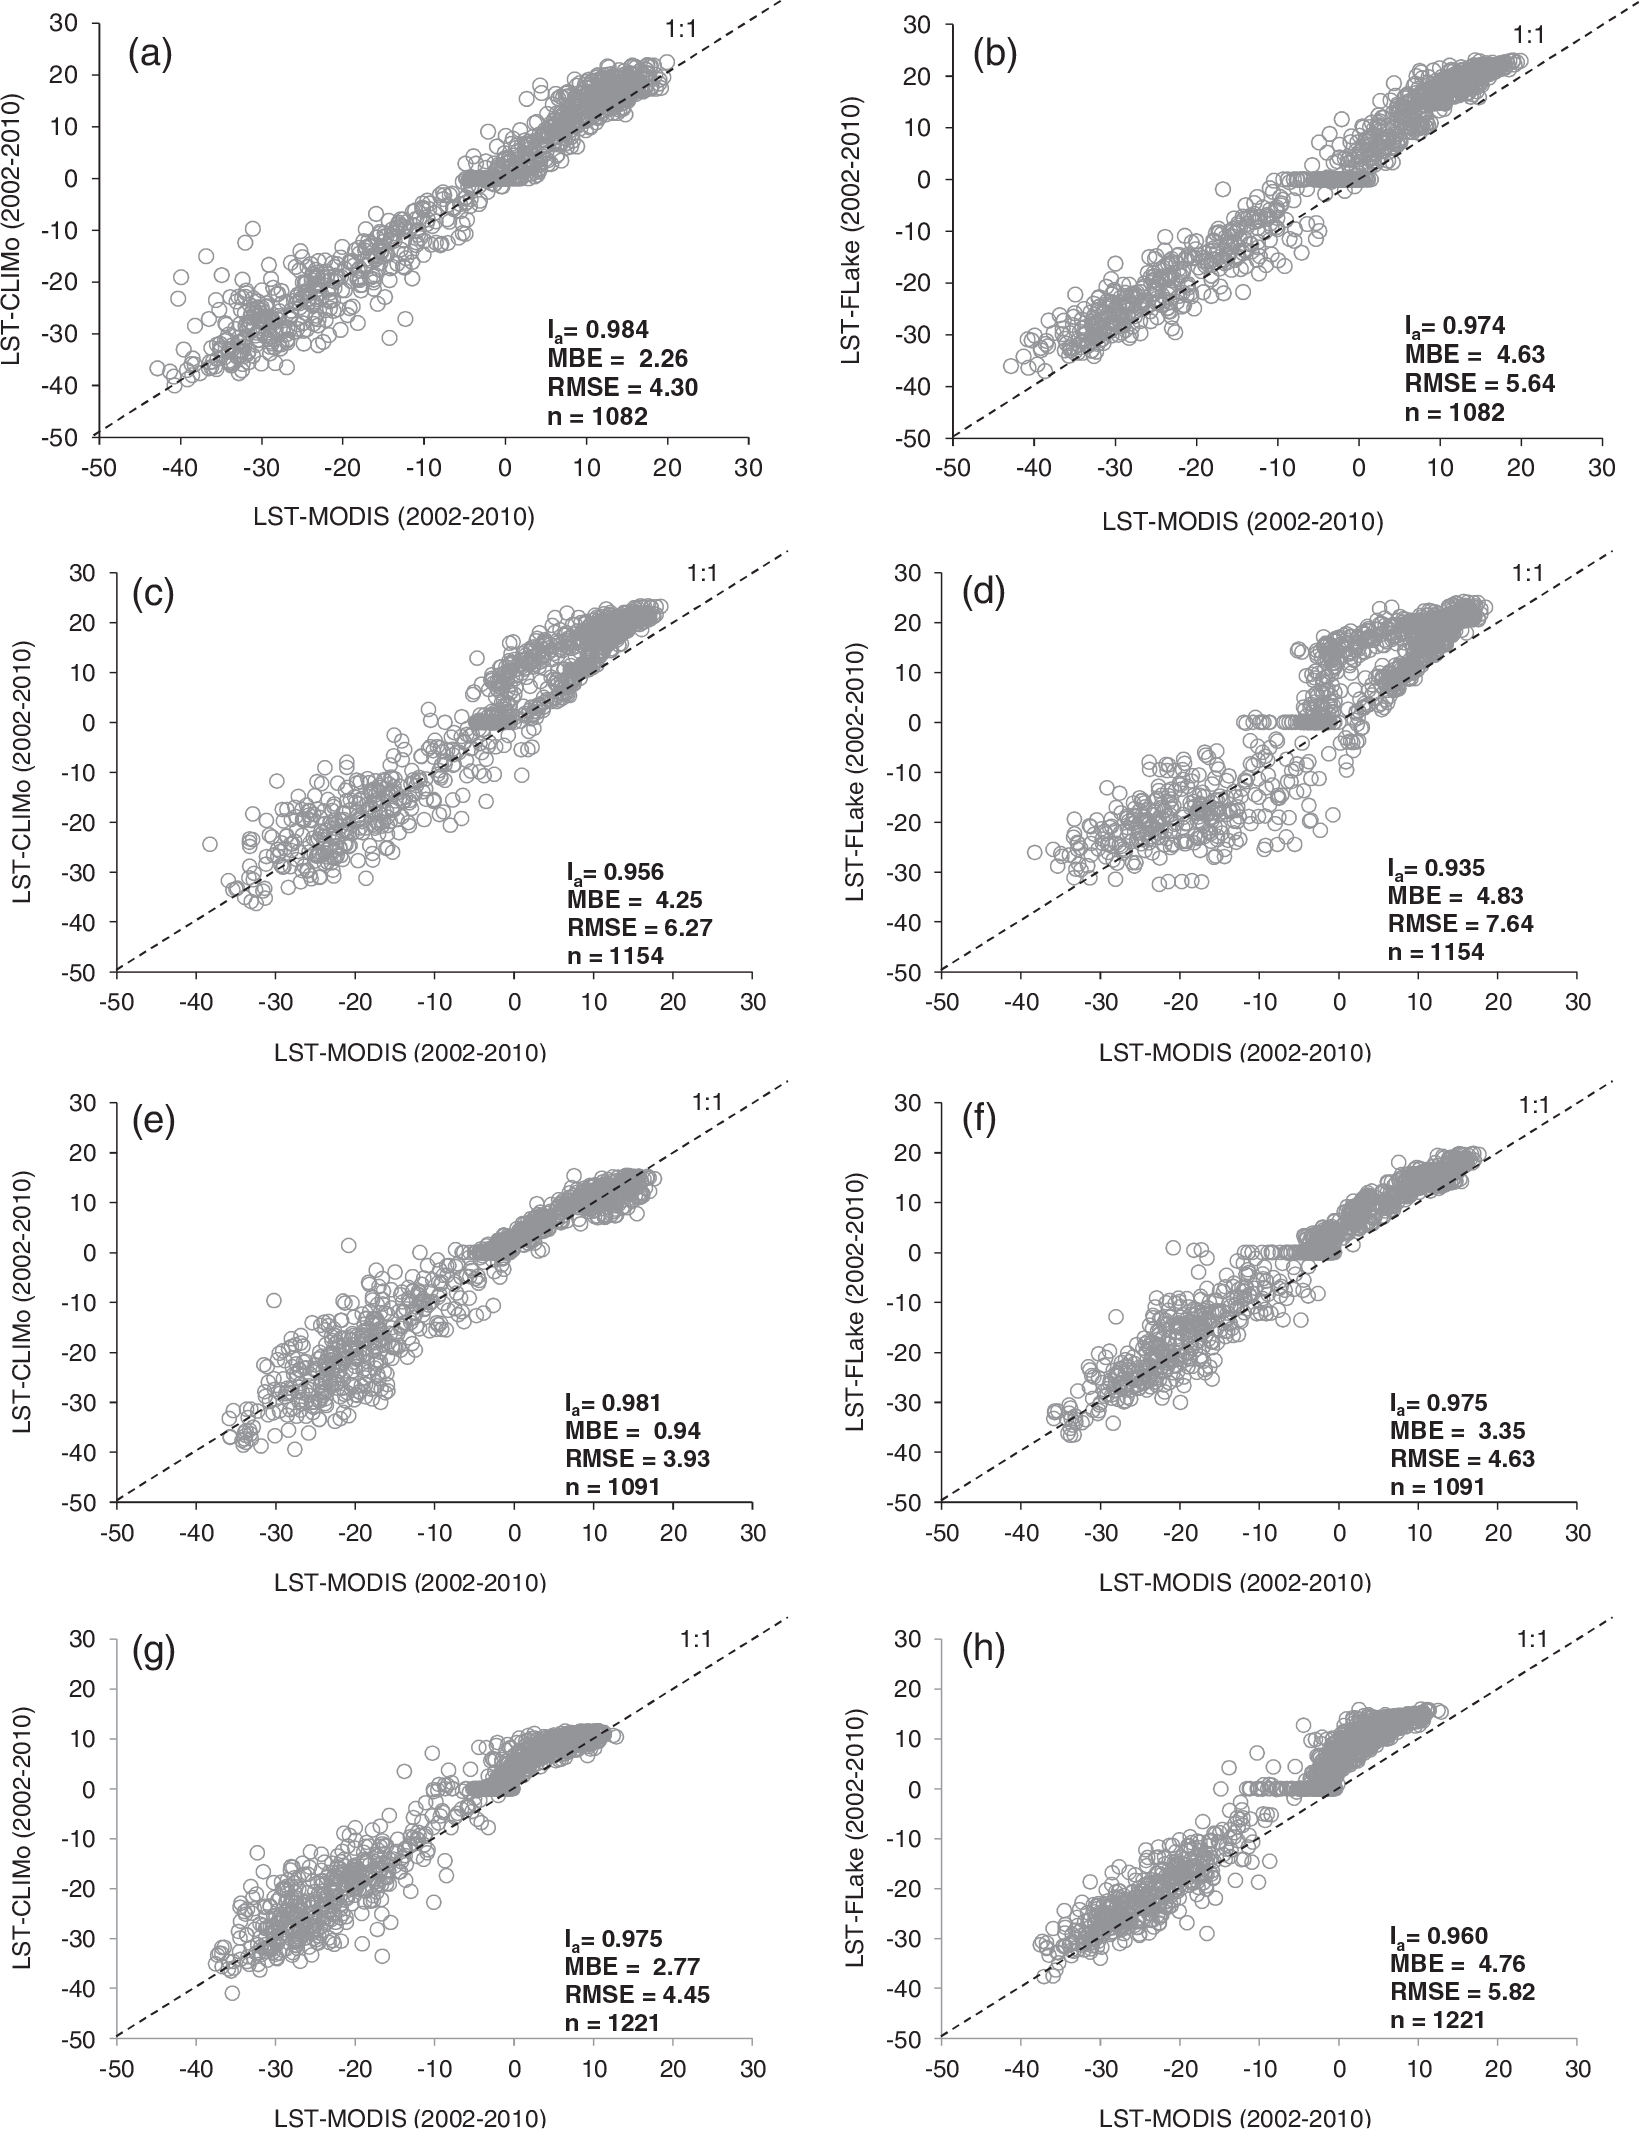
Fig. 4.
Comparison of modelled LSTs from CLIMo and FLake with MODIS-derived LSTs (°C) data during open water season for 2002–2010: (a, b) Back Bay (Yellowknife station), (c, d) Hay River, (e, f) GSL (Main Basin) and (g, h) Deline-GBL.
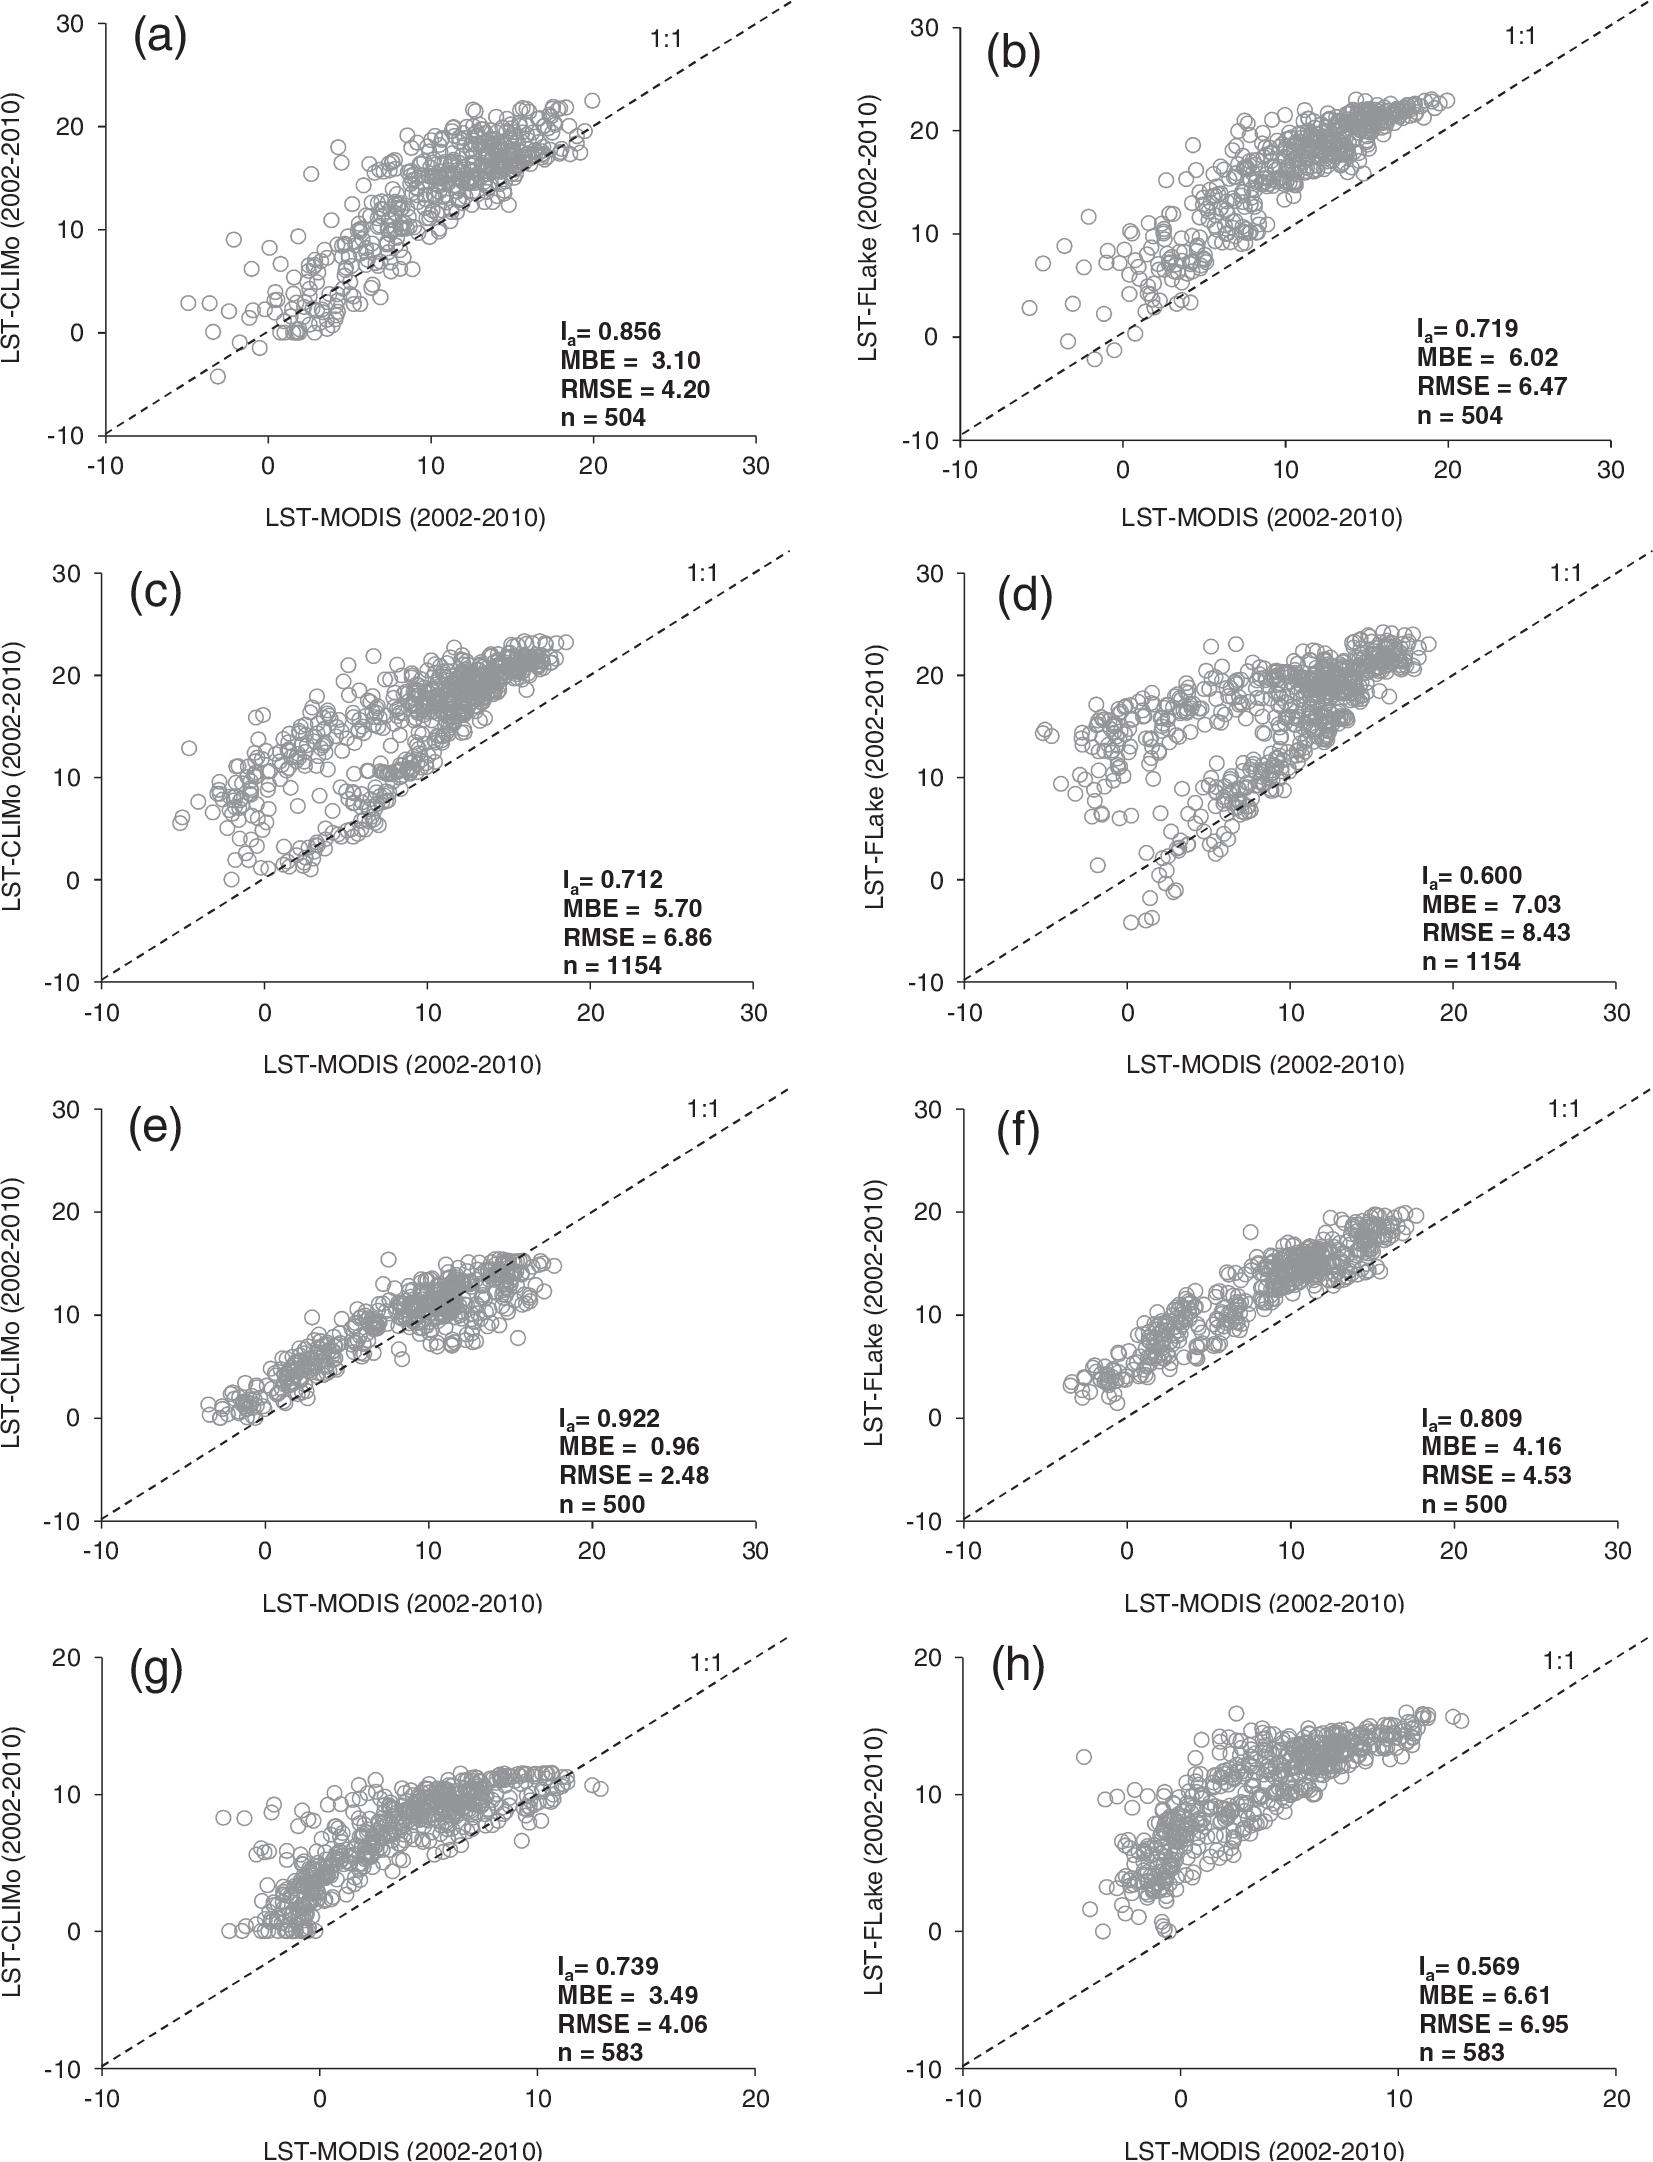
Table 2. Comparison of observed and simulated LST for Yellowknife (Back Bay), Hay River, GSL (Main Basin) and GBL (Deline) (2002–2010)
Fig. 5.
Simulated mixed layer depth by FLake for 2002–2010: (a) Back Bay (Yellowknife station), (b) Hay River, (c) GSL (Main Basin) and (d) Deline-GBL.
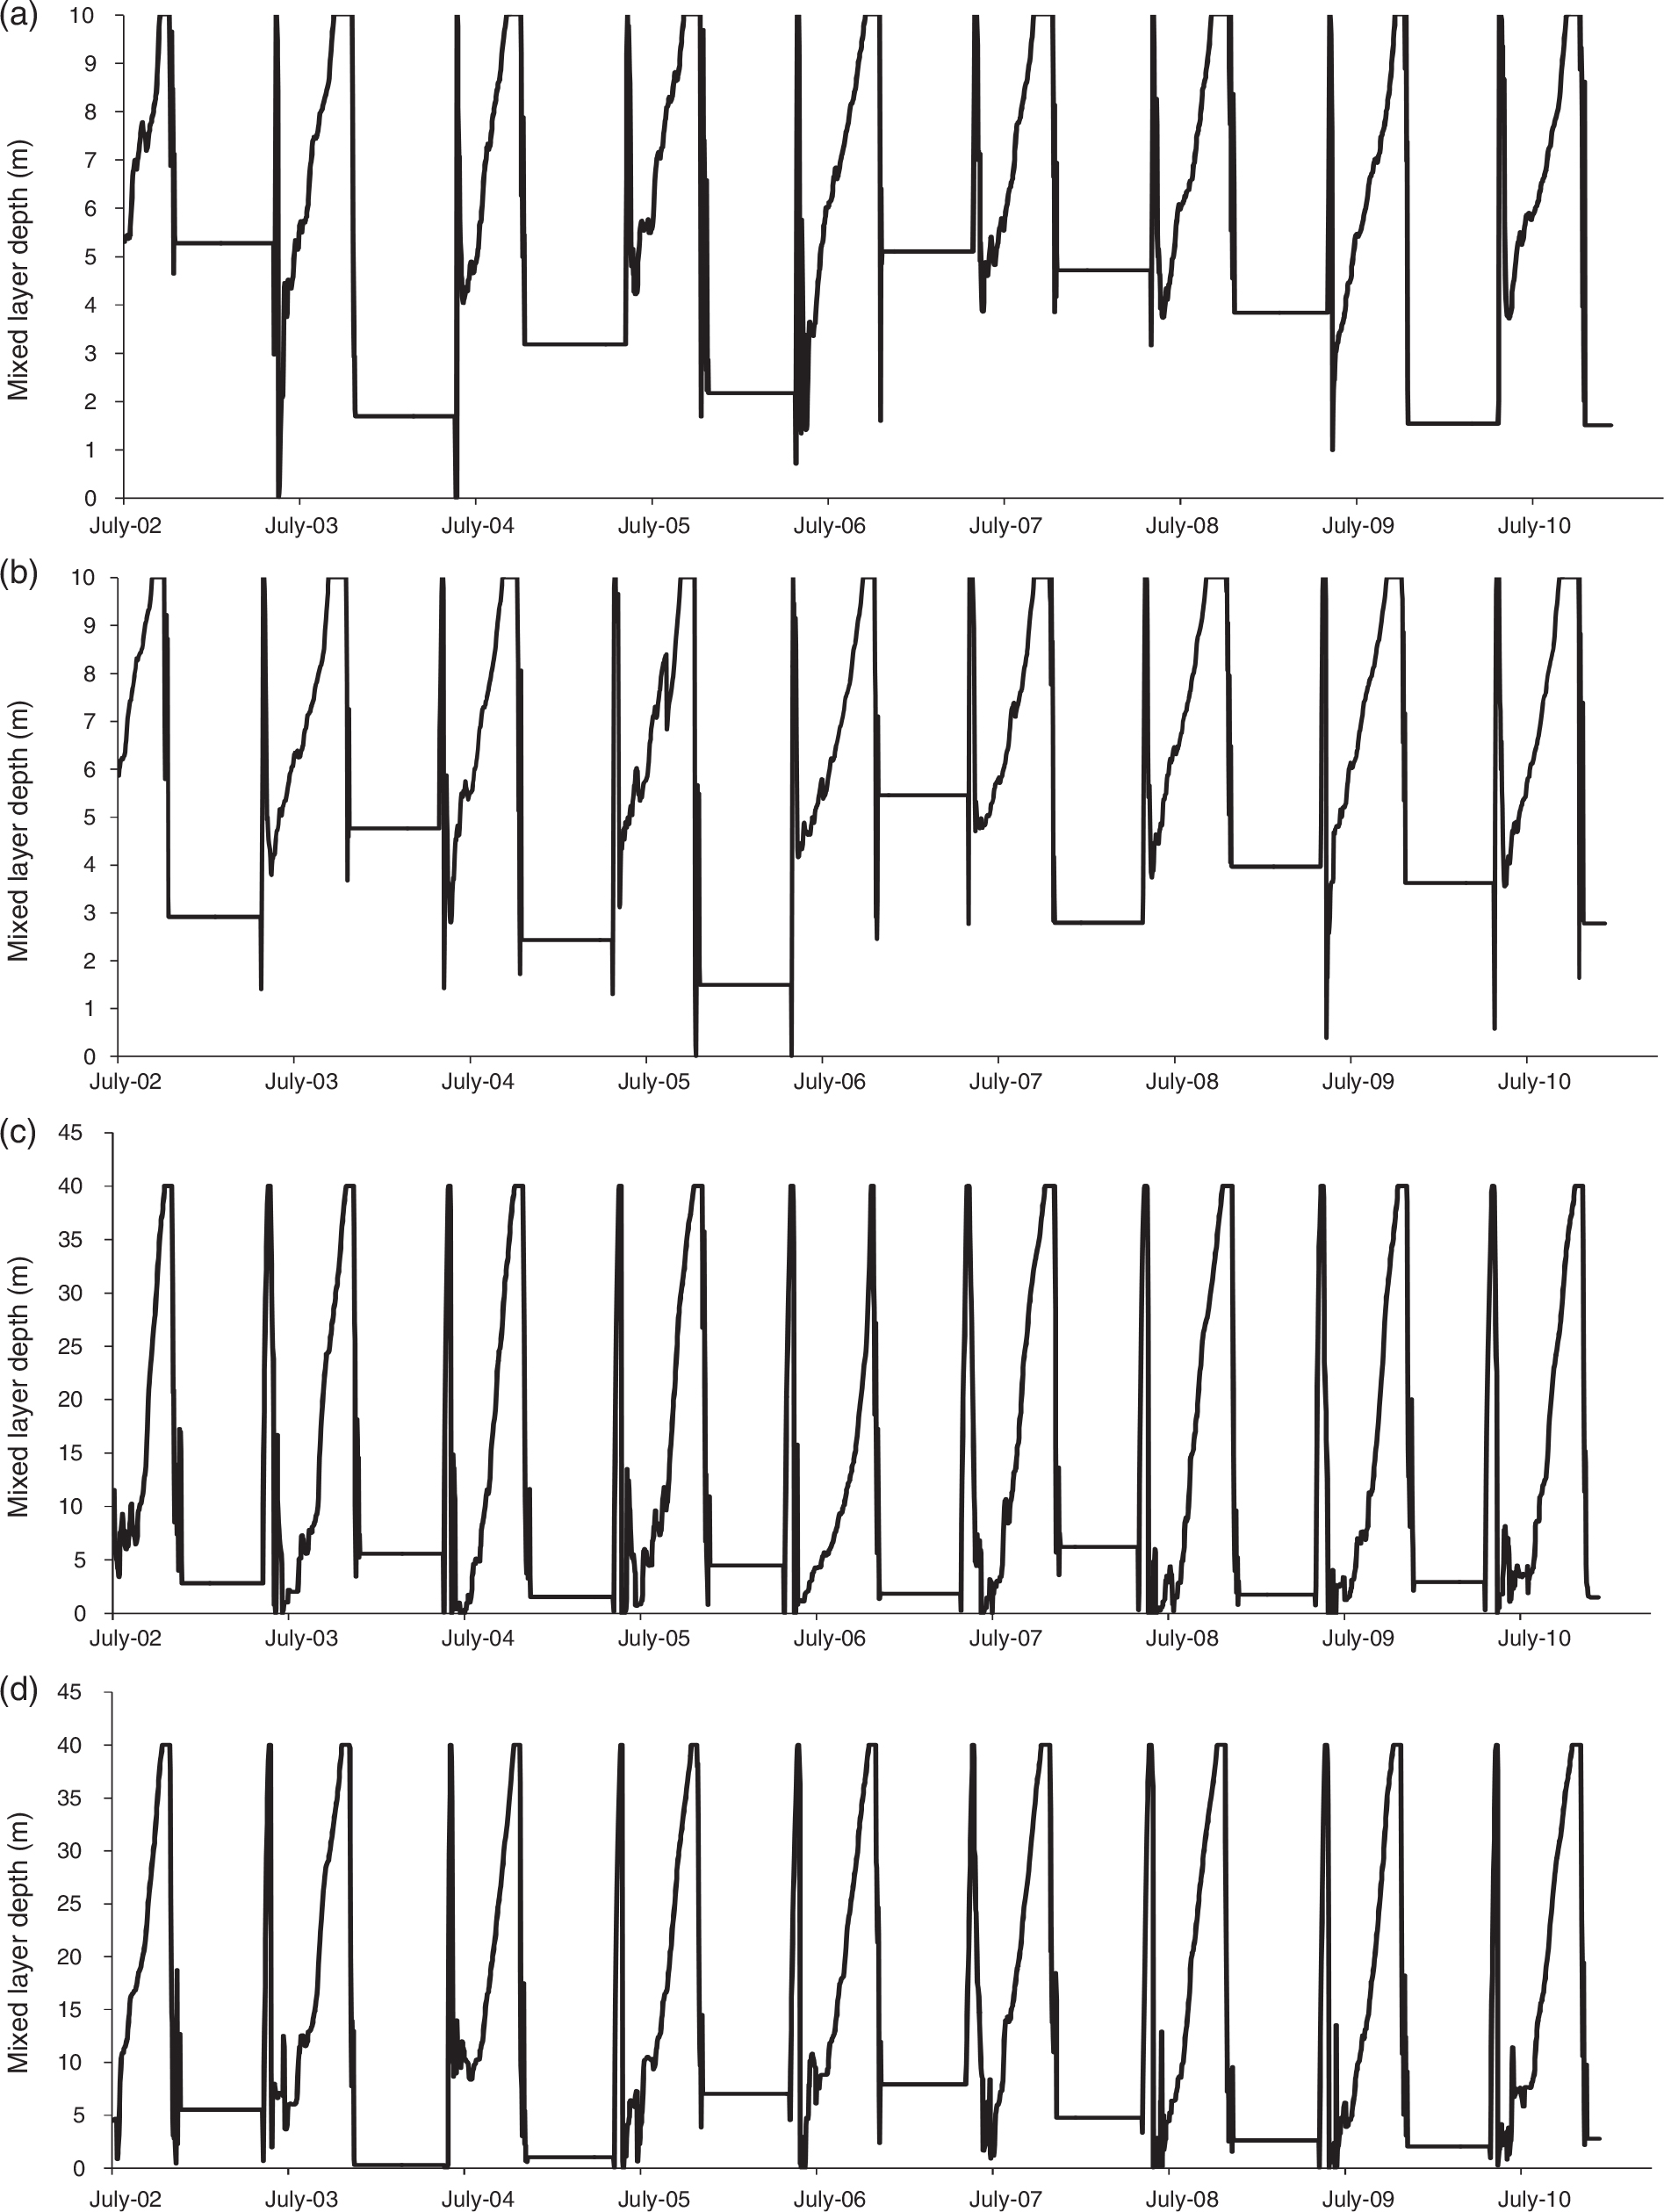
Fig. 6.
Comparison of modelled LSTs from CLIMo and FLake with MODIS-derived LSTs (°C) data during ice cover season for 2002–2010: (a, b) Back Bay (Yellowknife station), (c, d) Hay River, (e, f) GSL (Main Basin) and (g, h) Deline-GBL.
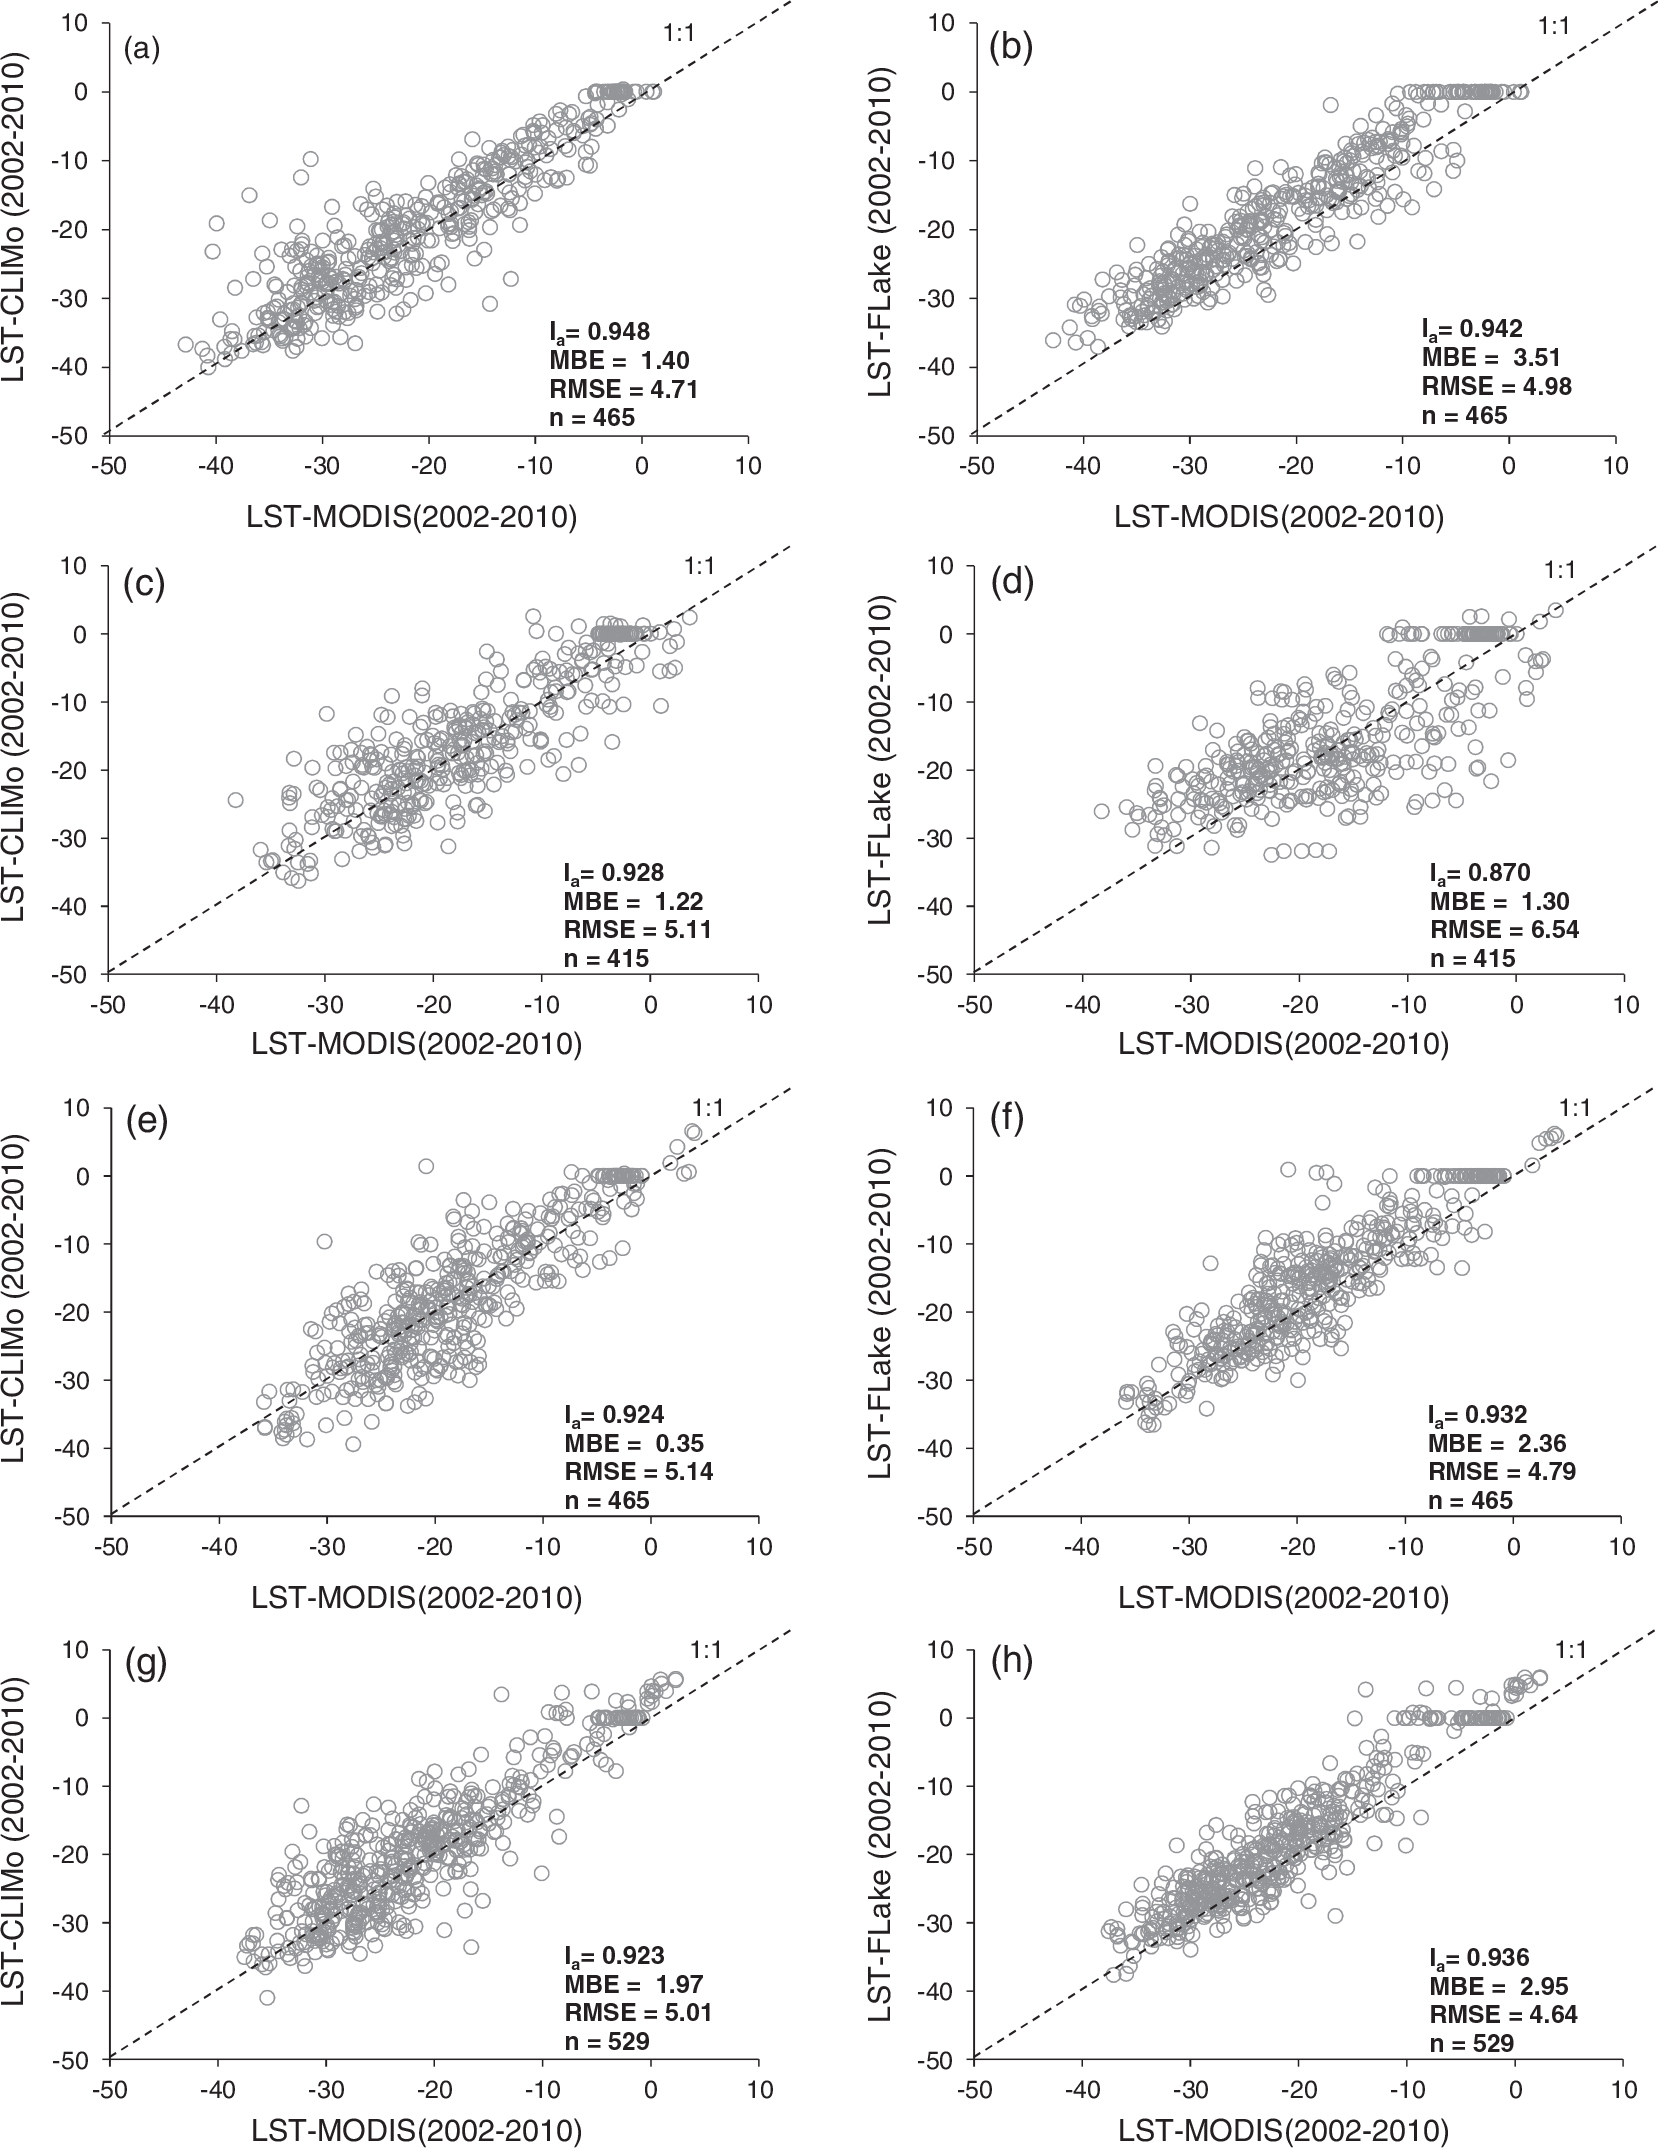
Fig. 7.
Comparison of observed (CID) and simulated (CLIMo and FLake) ice thickness (m) for Back Bay (1961–2008). Each dot in each year compares the in situ ice thickness values with the simulated one. There were about four in situ measurements available for each winter month.
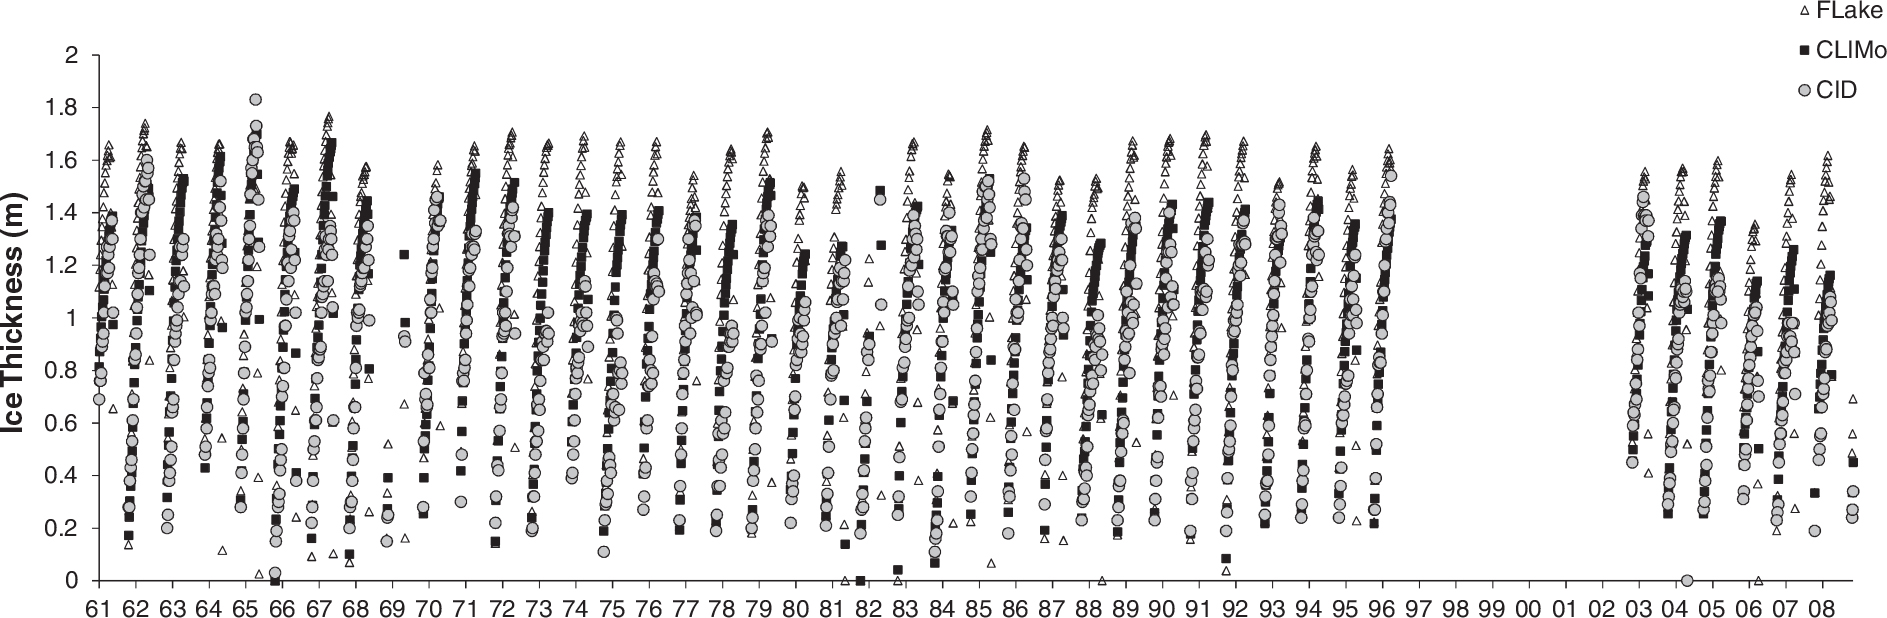
Fig. 8.
Comparison of observed (CID) and simulated ice thickness (m) for Back Bay: (a) CLIMo and (b) FLake (1961–2008).
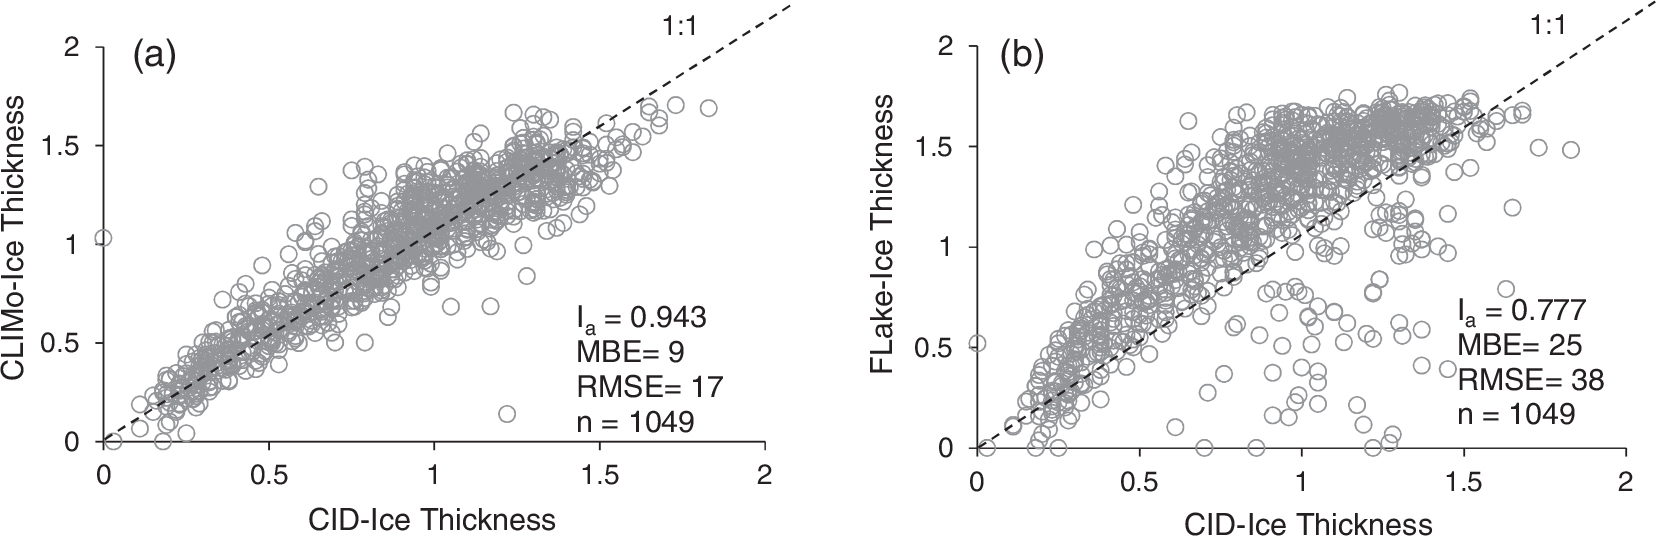
Fig. 9.
Comparison of observed (CID) and simulated (CLIMo and FLake) (a) break-up and (b) freeze-up dates for Back Bay (1961–1996), Julian days.
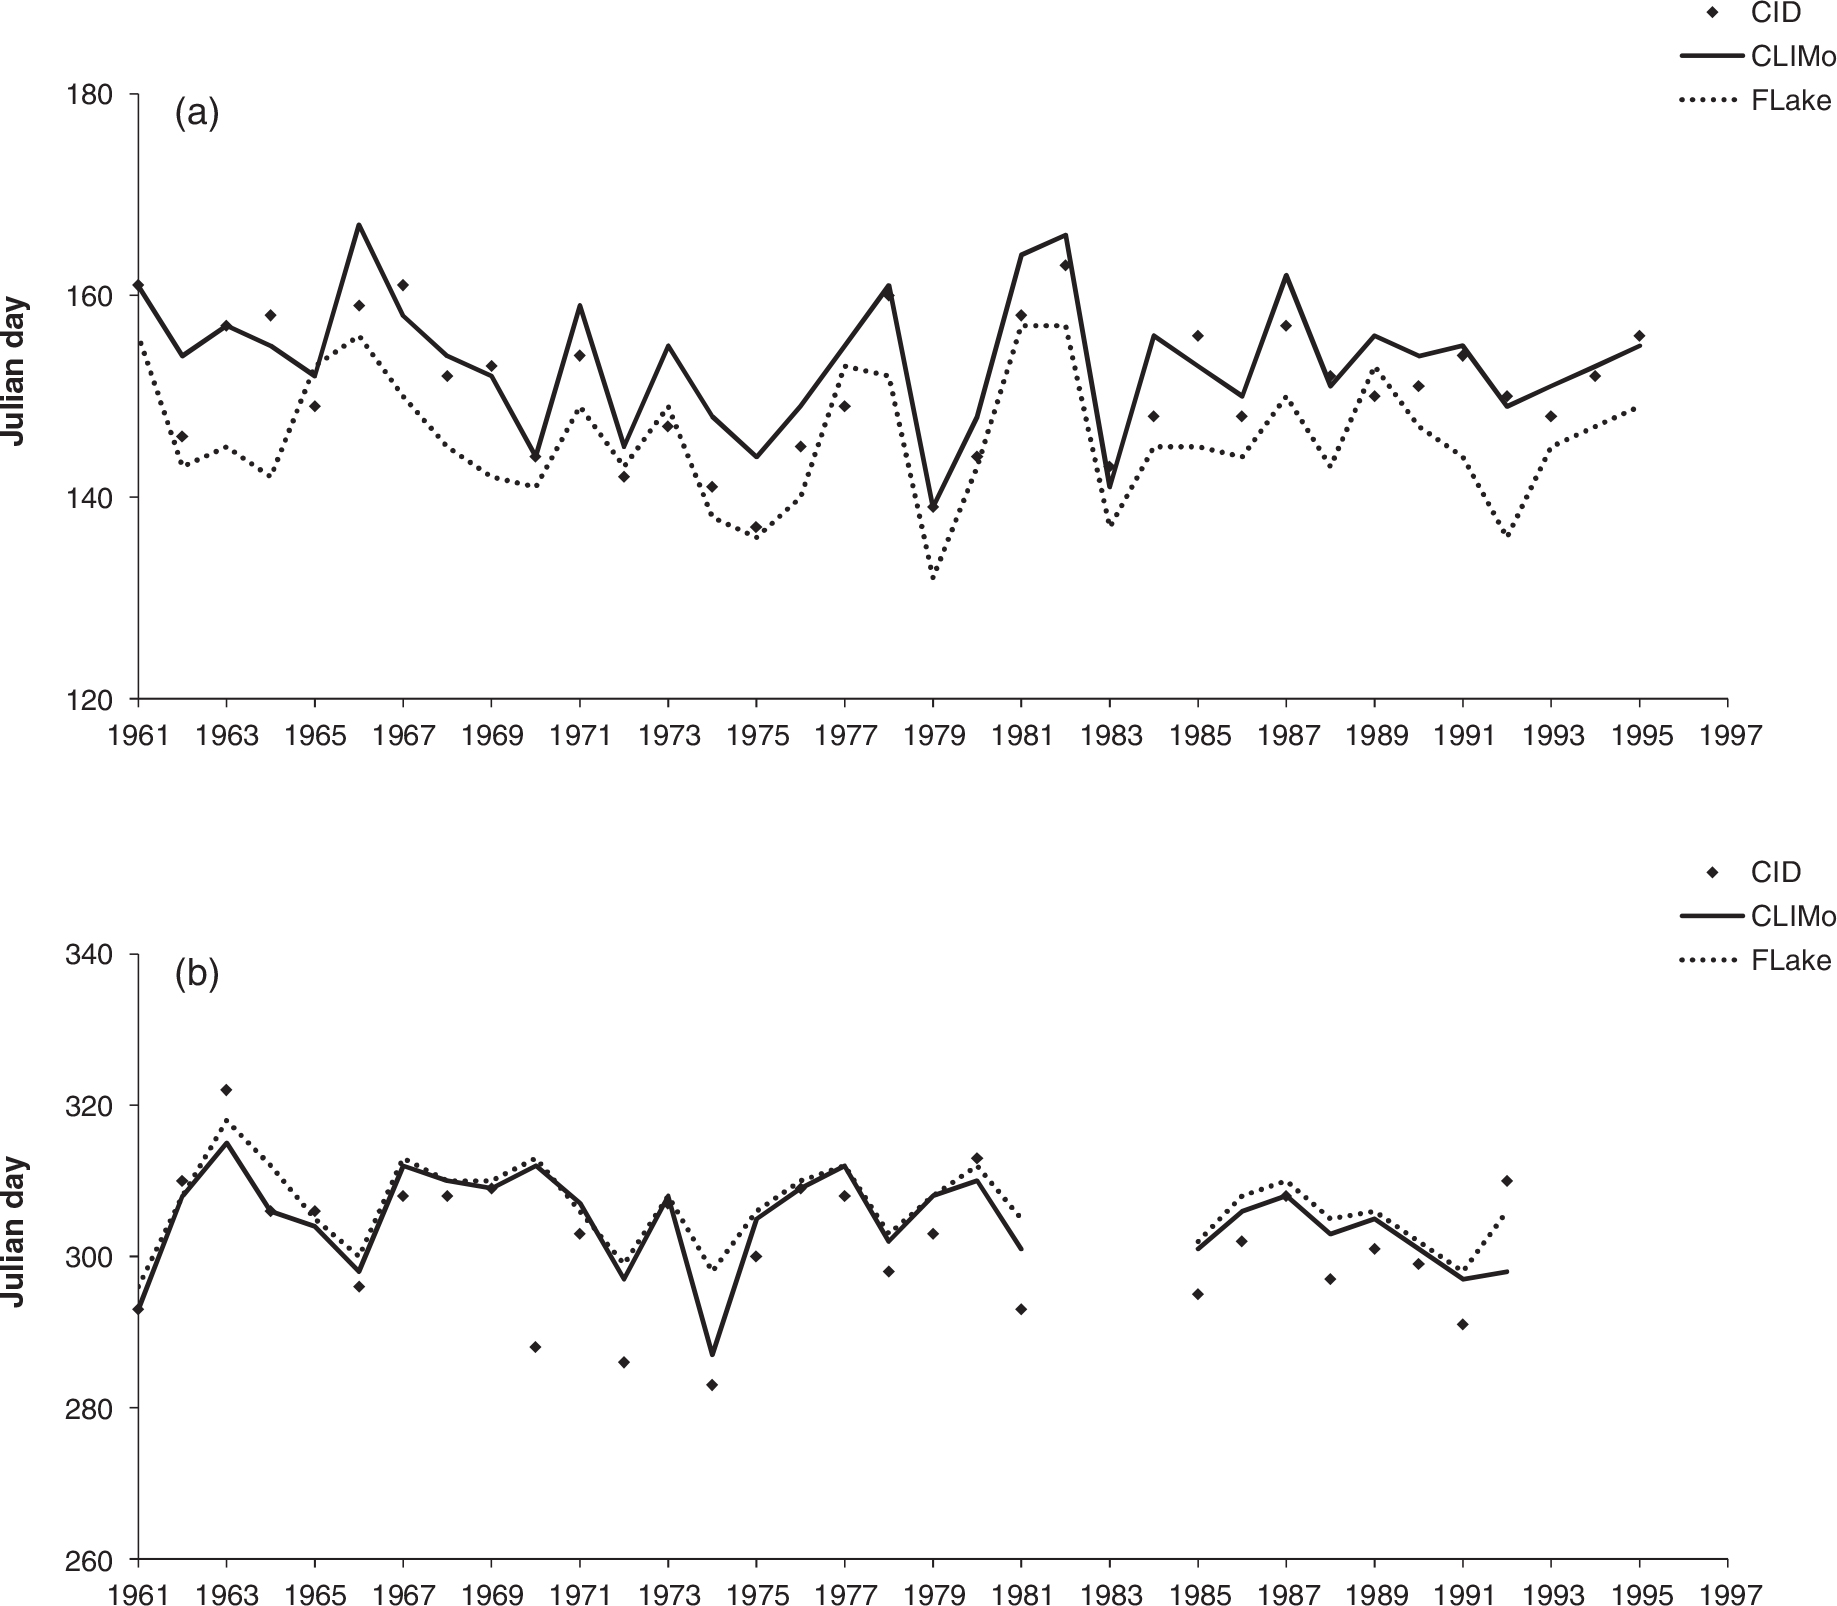
Fig. 10.
Comparison of observed (CID) and simulated (CLIMo and FLake) (a, b) break-up and (c, d) freeze-up dates for Back Bay (1961–1996), Julian days.
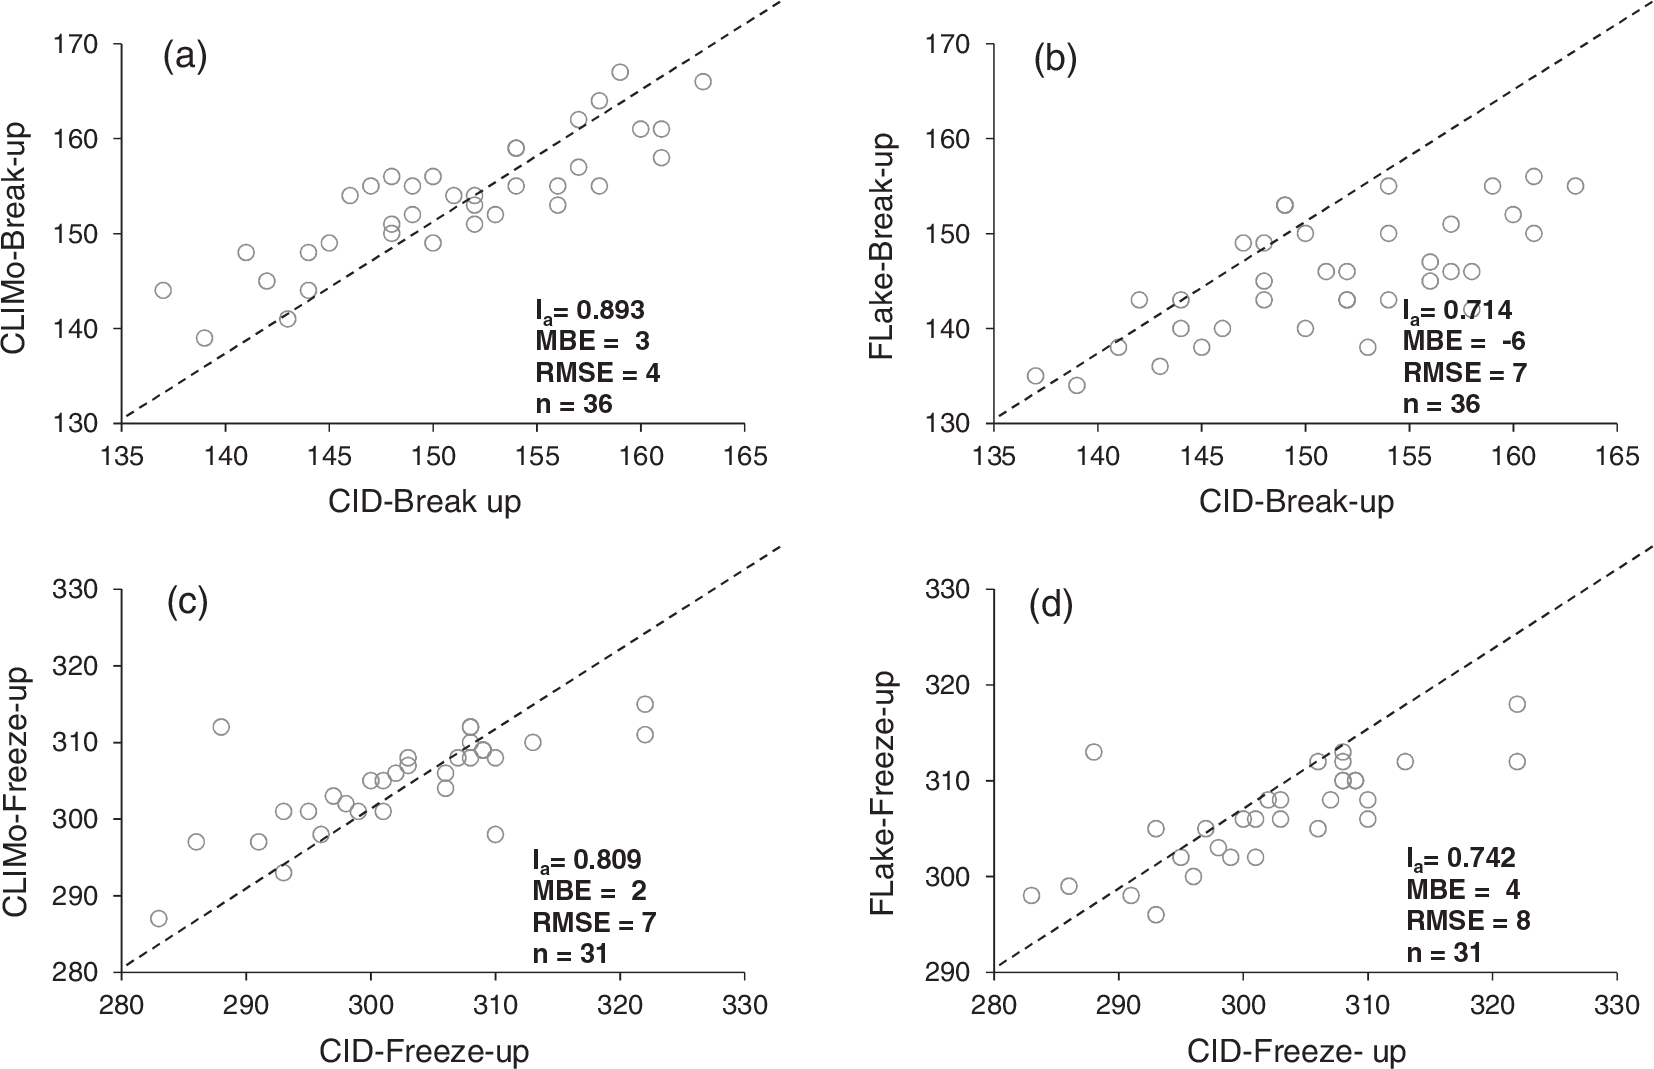
Table 3. Comparison of observed and simulated ice thickness and break-up/freeze-up dates for Yellowknife (Back Bay) site (1961–2008)
Fig. 11.
Comparison of simulated LST by FLake using daily and hourly averaged forcing (a) Hay River-GSL and (b) Deline-GBL (2002–2010).
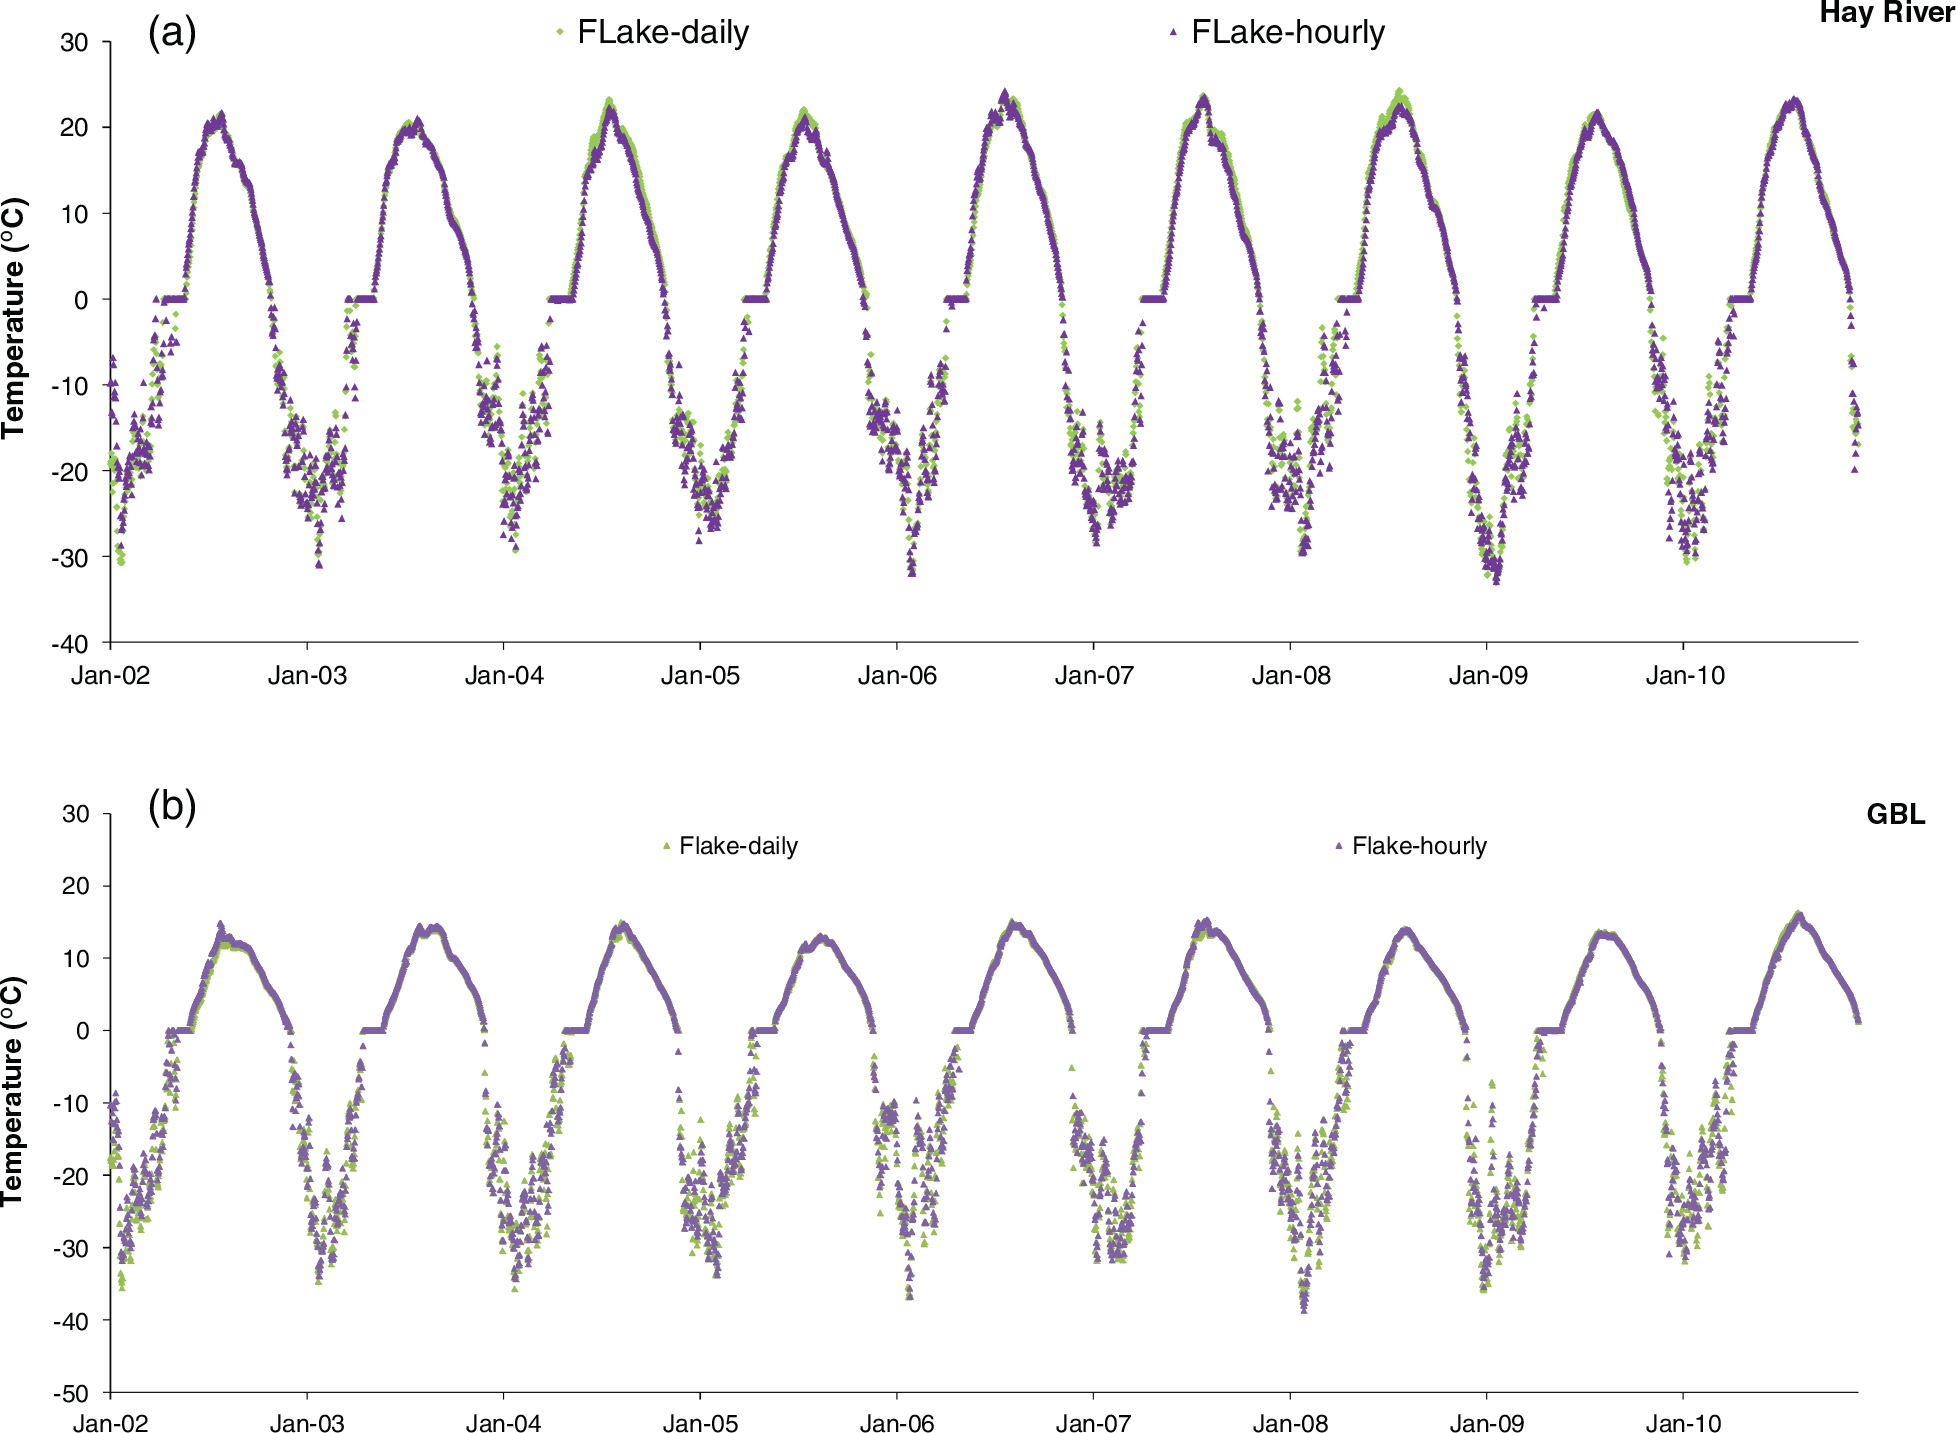
Fig. 12.
Comparison of simulated mixed layer depth by FLake using daily and hourly averaged forcing (a) Hay River-GSL and (b) Deline-GBL (2002–2010).
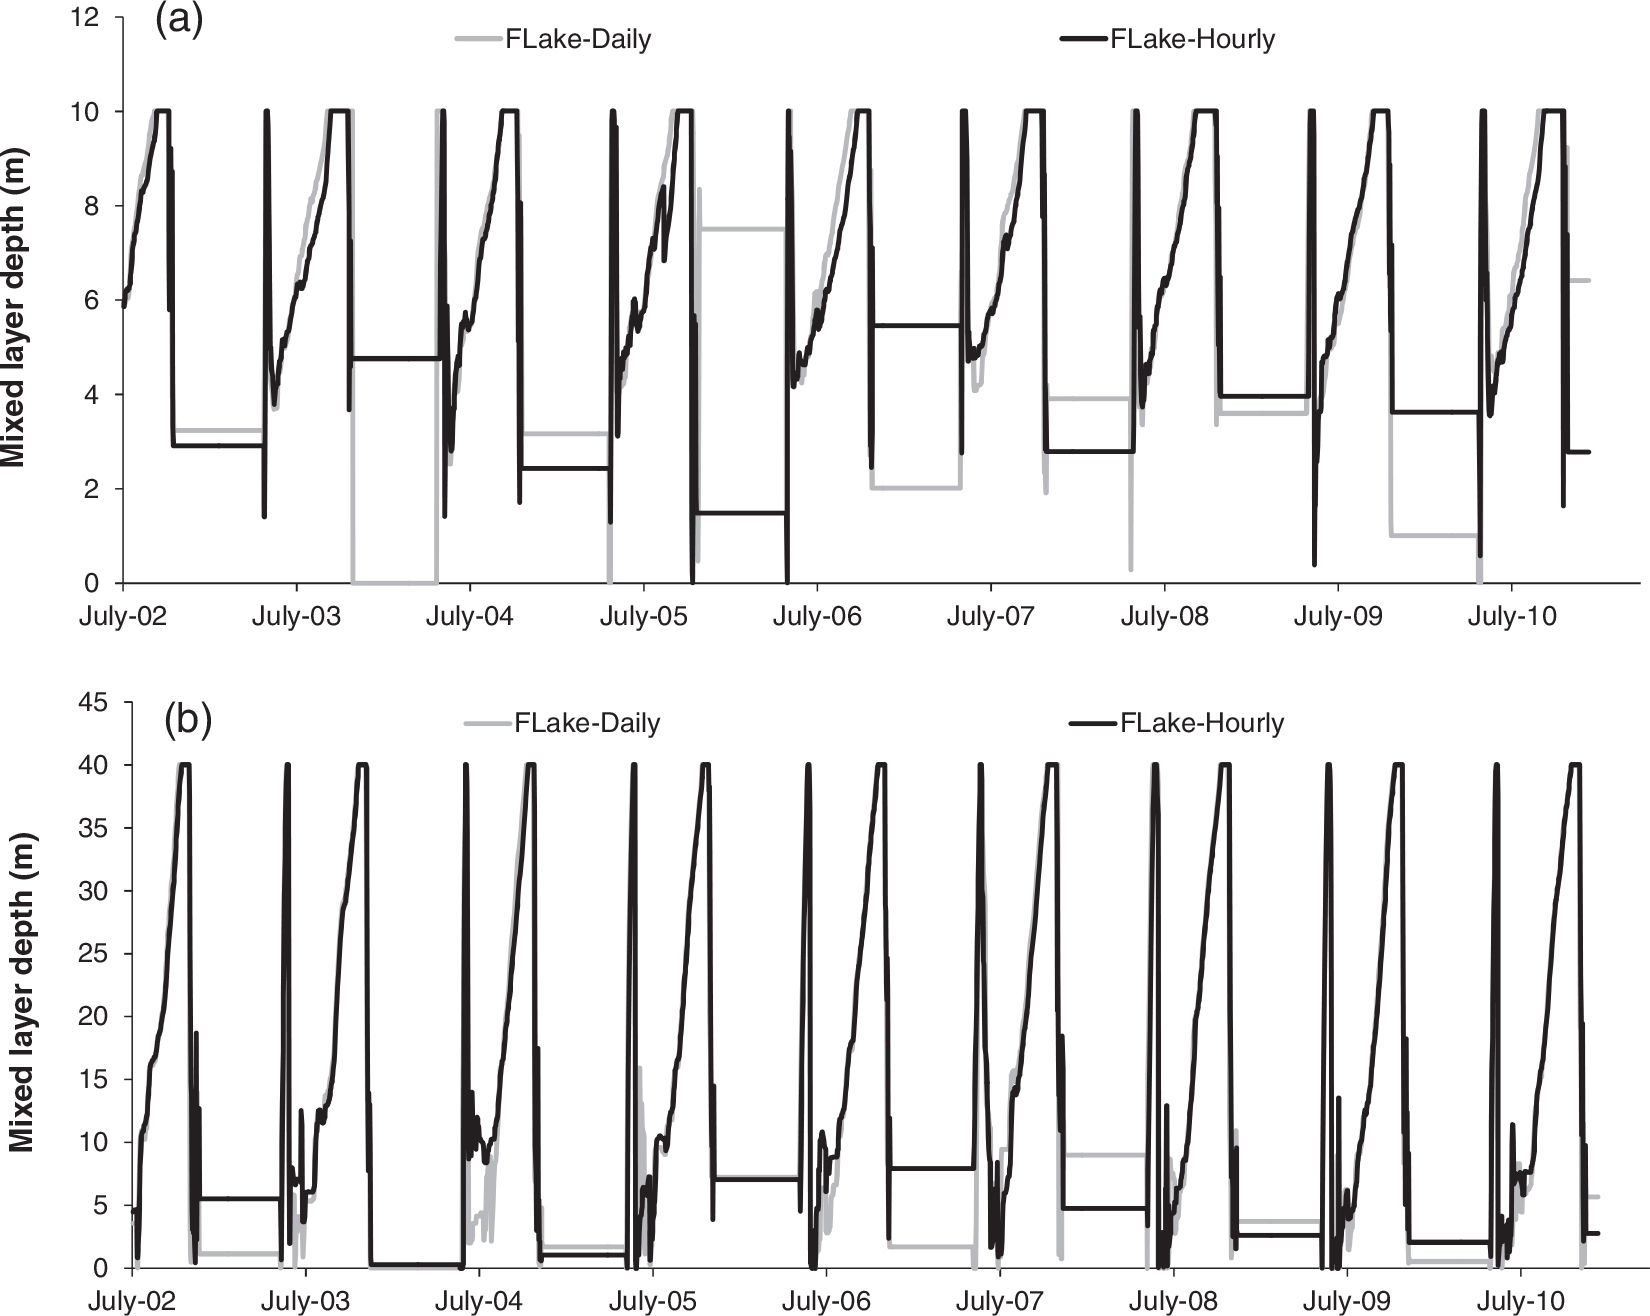
Table 4. Comparison of MODIS observed and simulated LST by FLake in Hay River, GSL and Deline, GBL (2002–2010) using daily forcing (FL_D) and hourly forcing (FL_A)