Fig. 1.
Location of 27 SYKE lake temperature measurement stations, shown with the grid box lake fraction in the operational setup of HIRLAM with a horizontal resolution of 16.5 km. The blue colour indicates that more than 5% of the grid square is covered by lakes. The letters denote the lakes mentioned in this study: I – Lake Inari, H – Lake Haukivesi, S – Lake Saimaa, O – Lake Onega, L – Lake Ladoga, P – Lake Peipsi.
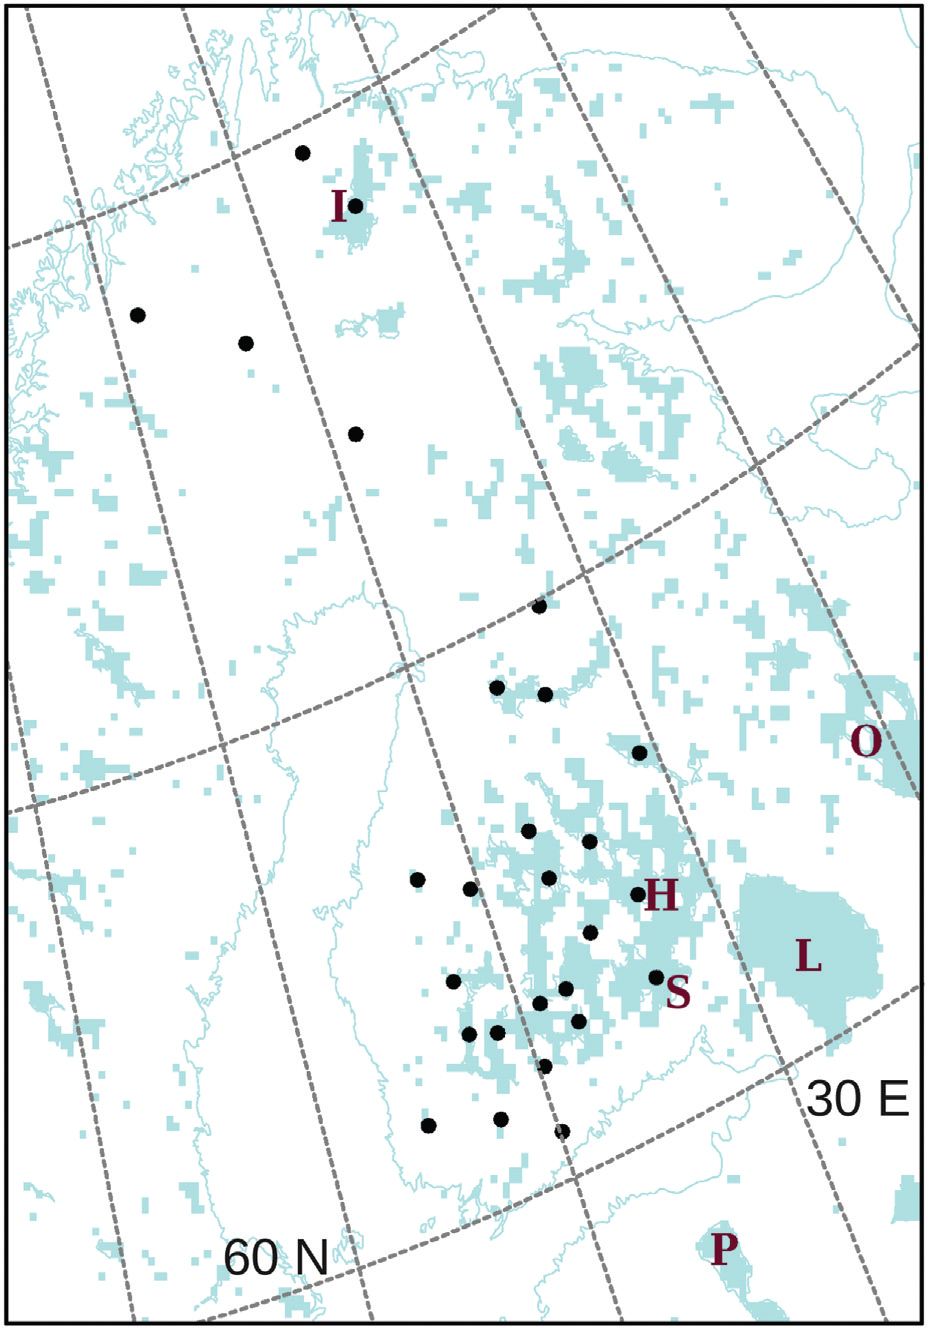
Fig. 2.
Schematic representation of the concept of peaceful coexistence between lake analysis and lake parameterisation by FLake.
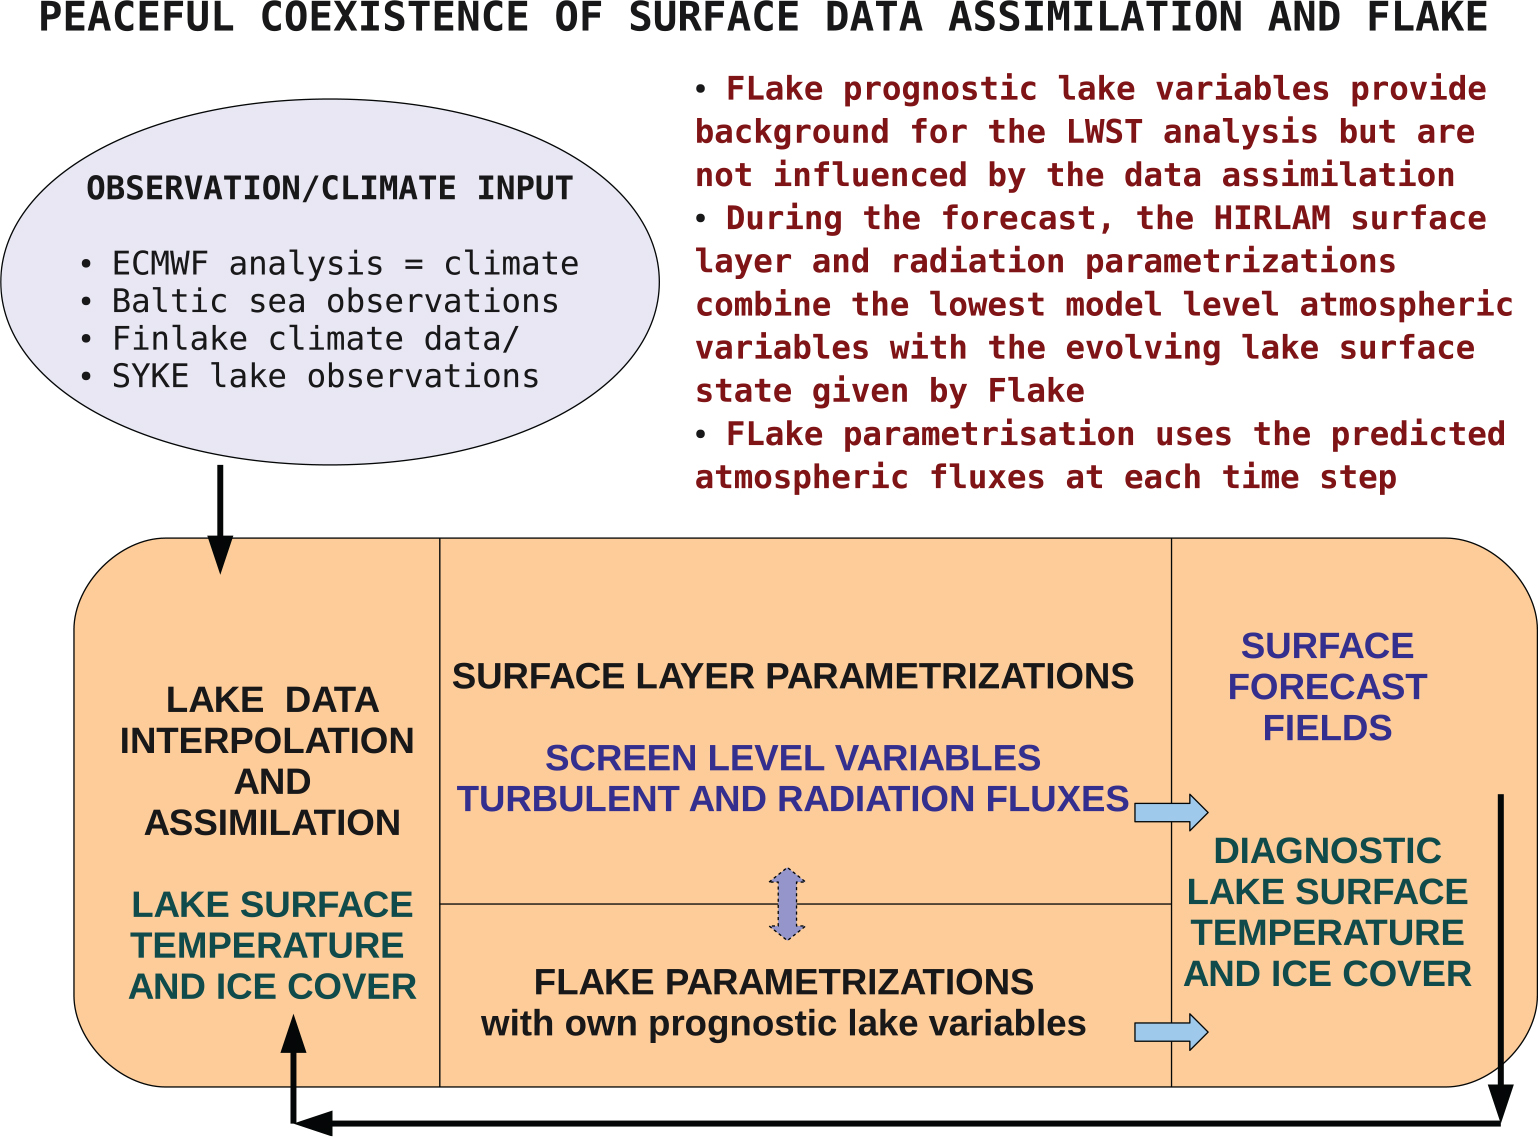
Table 1. Definition of the HIRLAM experiments
[i] aObserved LWST over 27 lakes in Finland.
[ii] bClimatological pseudo observations over the largest lakes.
[iii] cFor analysis.
[iv] dFor FLake.
Fig. 3.
MODIS Aqua view over Gulf of Finland (in the middle) and Lake Ladoga (on the right) in the afternoon on 15 December 2009. Note the mesoscale cyclone over Ladoga and convection lines over Gulf of Finland.
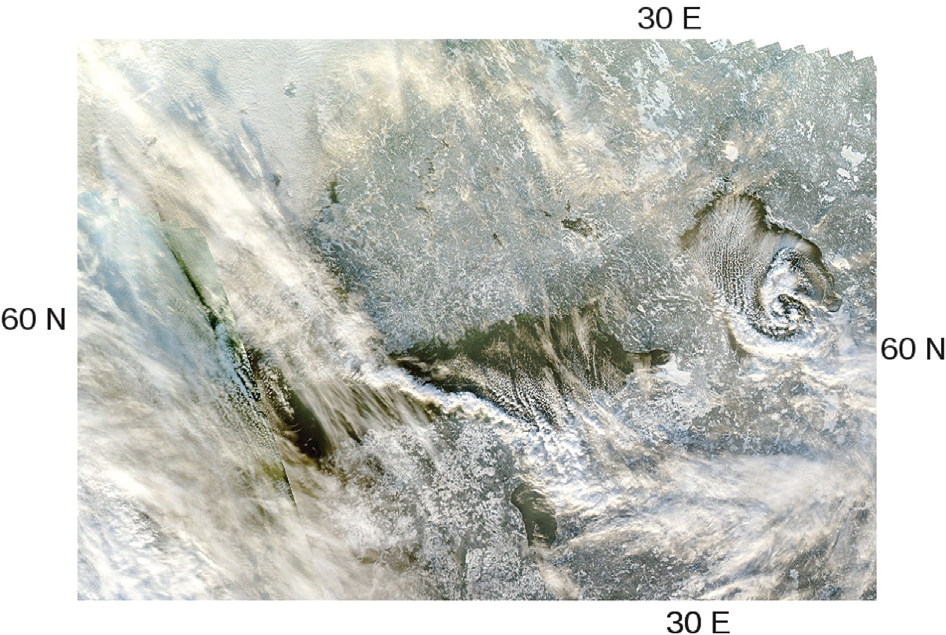
Fig. 4.
Fraction of lake ice in a grid square (0–1) at 06 UTC on 15 December, 2009, according to the analysis by the (a) CLI, (b) ANA and (c) FLK experiments. The grid squares where the lake fraction is greater than 25% are shown.
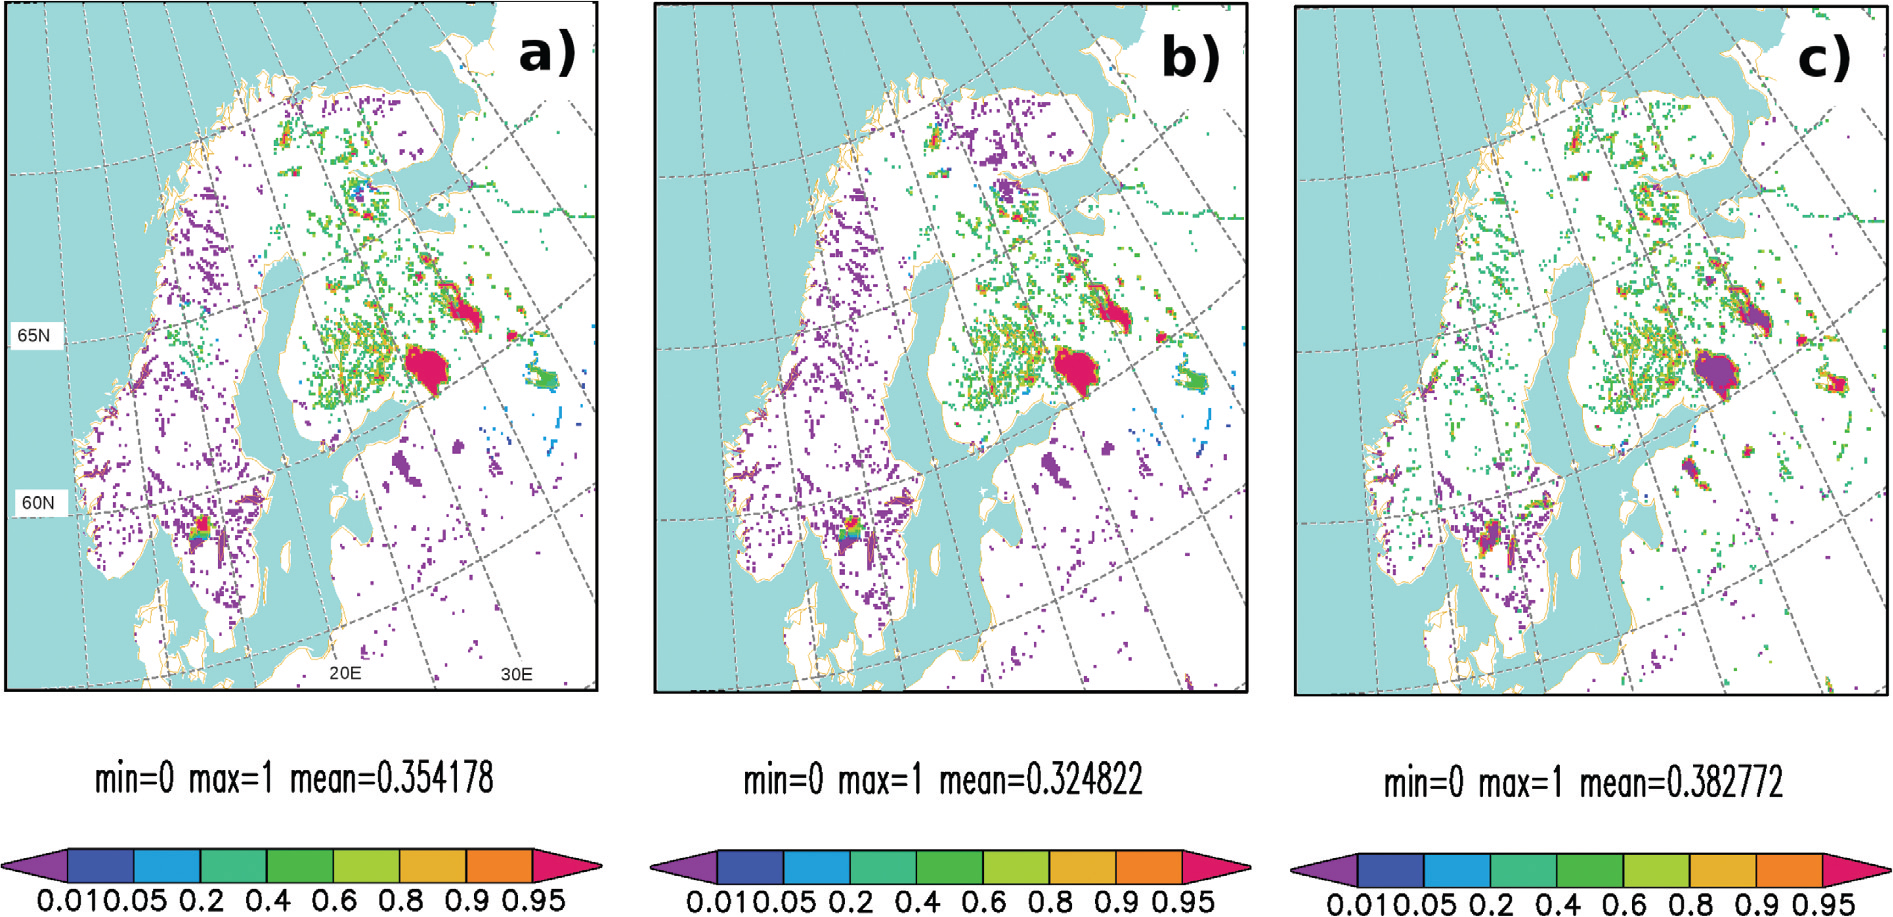
Table 2. Ice freezing and break-up dates of Lake Haukivesi in 2009–2010
[i] aSYKE statistical model.
Fig. 5.
Lake surface temperature (K) on 20 June, 2011, at 06 UTC according to the parameterisation by FLake in (a) SYK-w, (b) SYK-c and (c) their difference. Lakes are masked out as in Fig. 4.
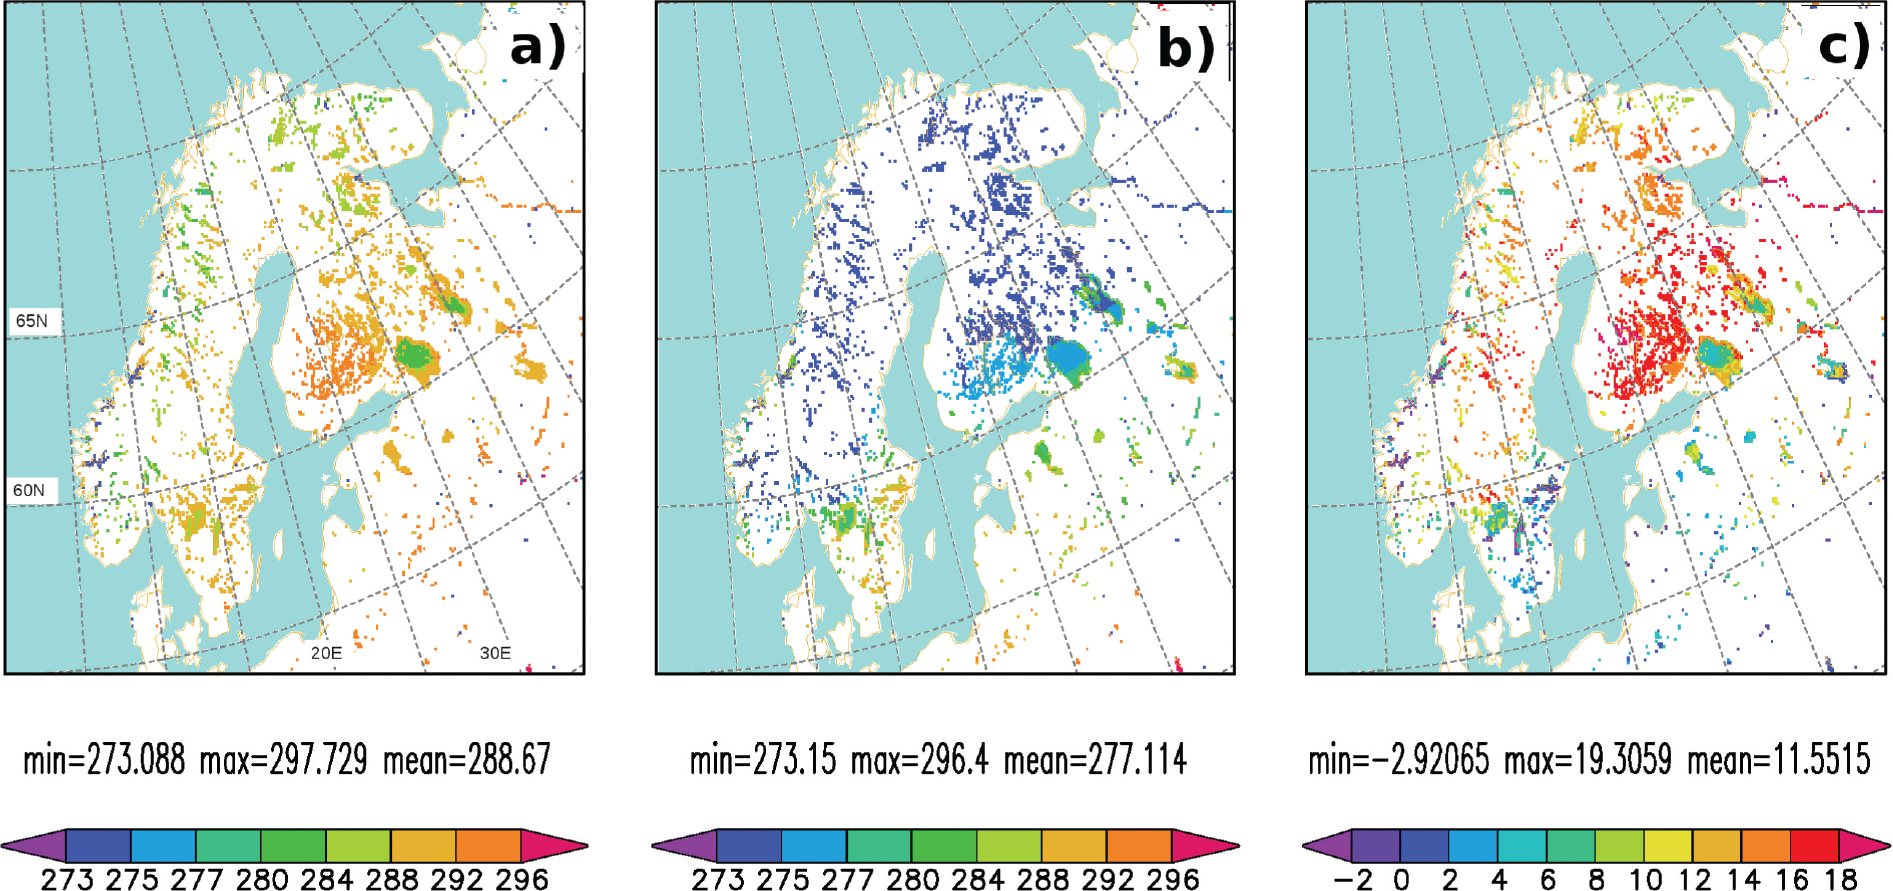
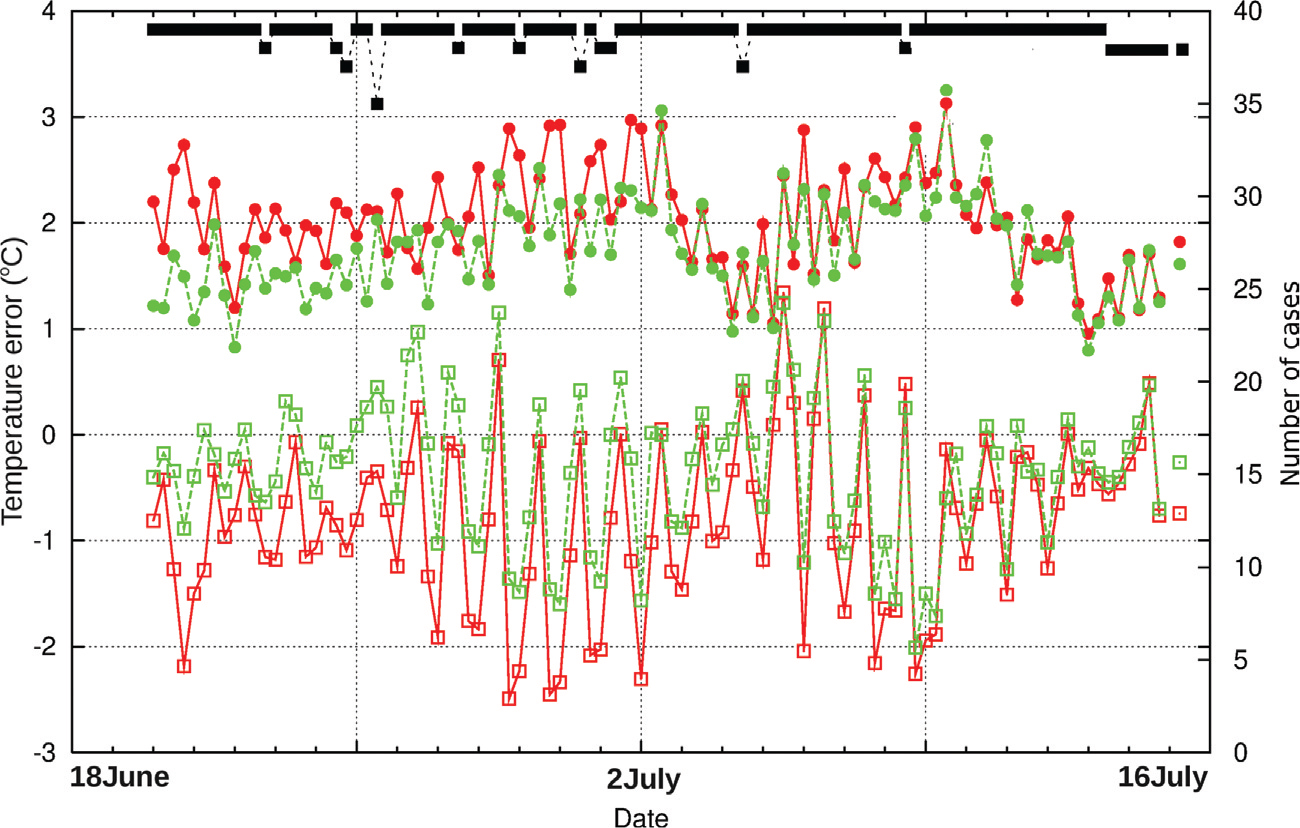
Fig. 6.
Time-series of bias (lower curves with squares) and RMSE (upper curves with circles) of the predicted grid-average screen-level temperature of SYK-c (red) and SYK-w (green) experiments against 39 SYNOP stations in Finland between 20 June and 15 July, 2011. The number of cases is depicted by the black line. Left y-axis: temperature in °C, right y-axis: number of cases, x-axis: date. Statistics are based on the initialised analyses and 6-h forecasts started at 00 and 12 UTC every day. Note that the initialised analysis contains values diagnosed from FLake, and not the analysed temperatures.