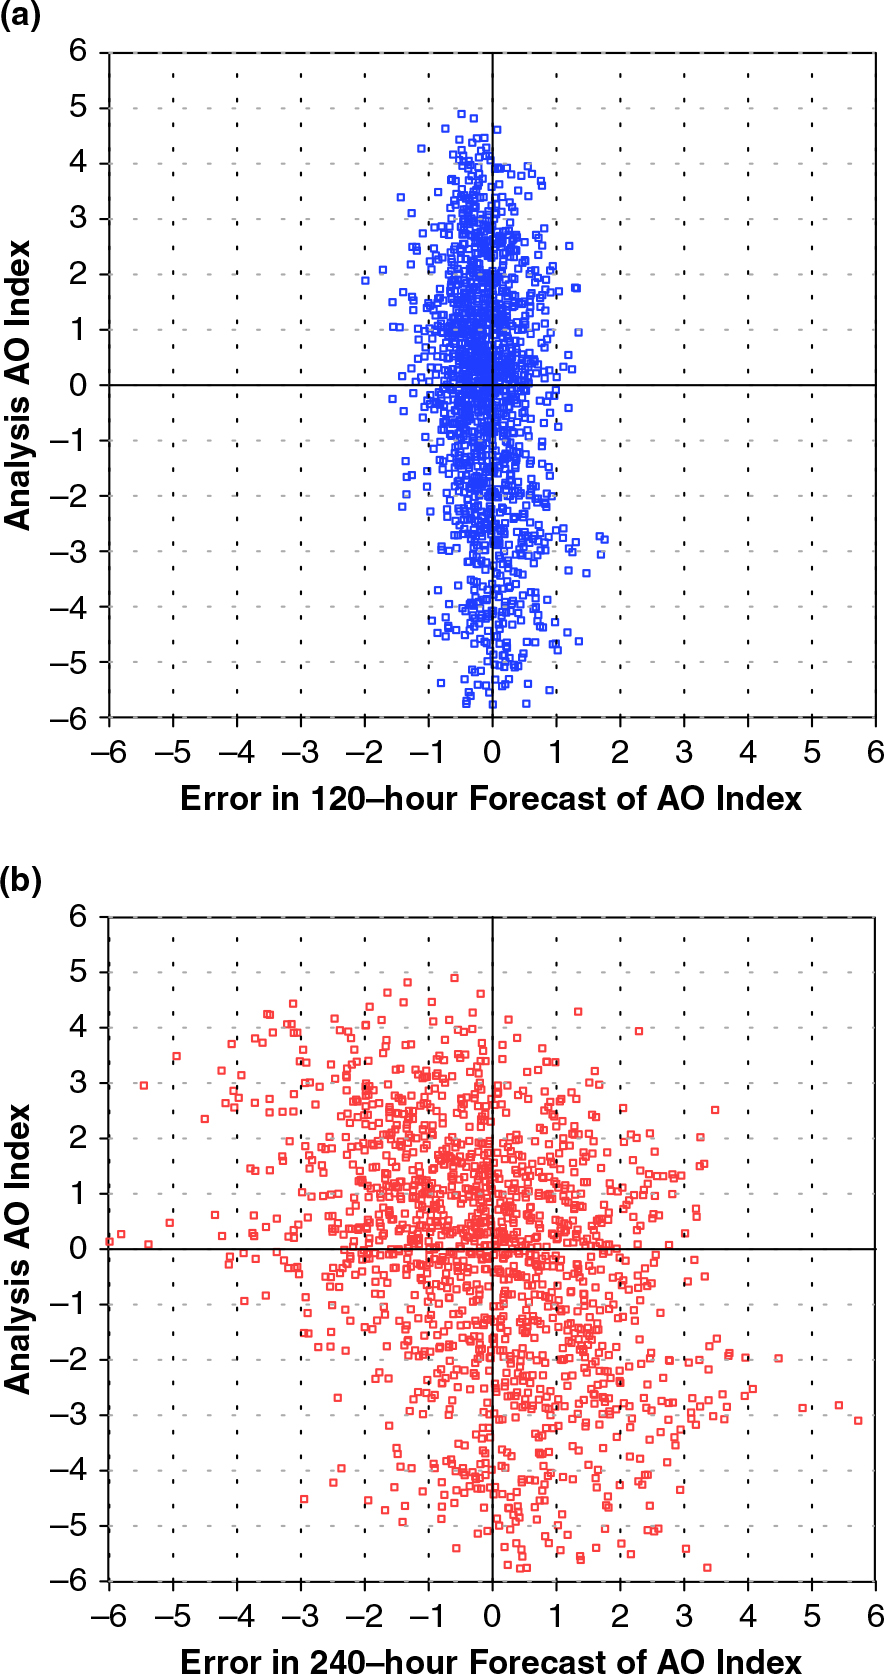
Fig. 1.
(a) Anomaly correlation coefficient (ACC) for 120-hr forecasts of 500 hPa geopotential height in the domain 20°–80°N for three global numerical weather prediction (NWP) models: European Centre for Medium-Range Weather Forecasts (ECMWF) (red), National Centers for Environmental Prediction (NCEP) Global Forecast System (GFS) (black), and U.S. Navy Operational Global Atmospheric Prediction System (NOGAPS) (blue), from October 2006 to September 2012. Time series are smoothed with a 30-d centred mean. (b) as in (a), except ACC shown as the subtraction of a 7-d centred mean from the 30-d centred mean for January 2009–September 2012. The x-axis indicates initial-time of forecasts from 00UTC and 12 UTC.
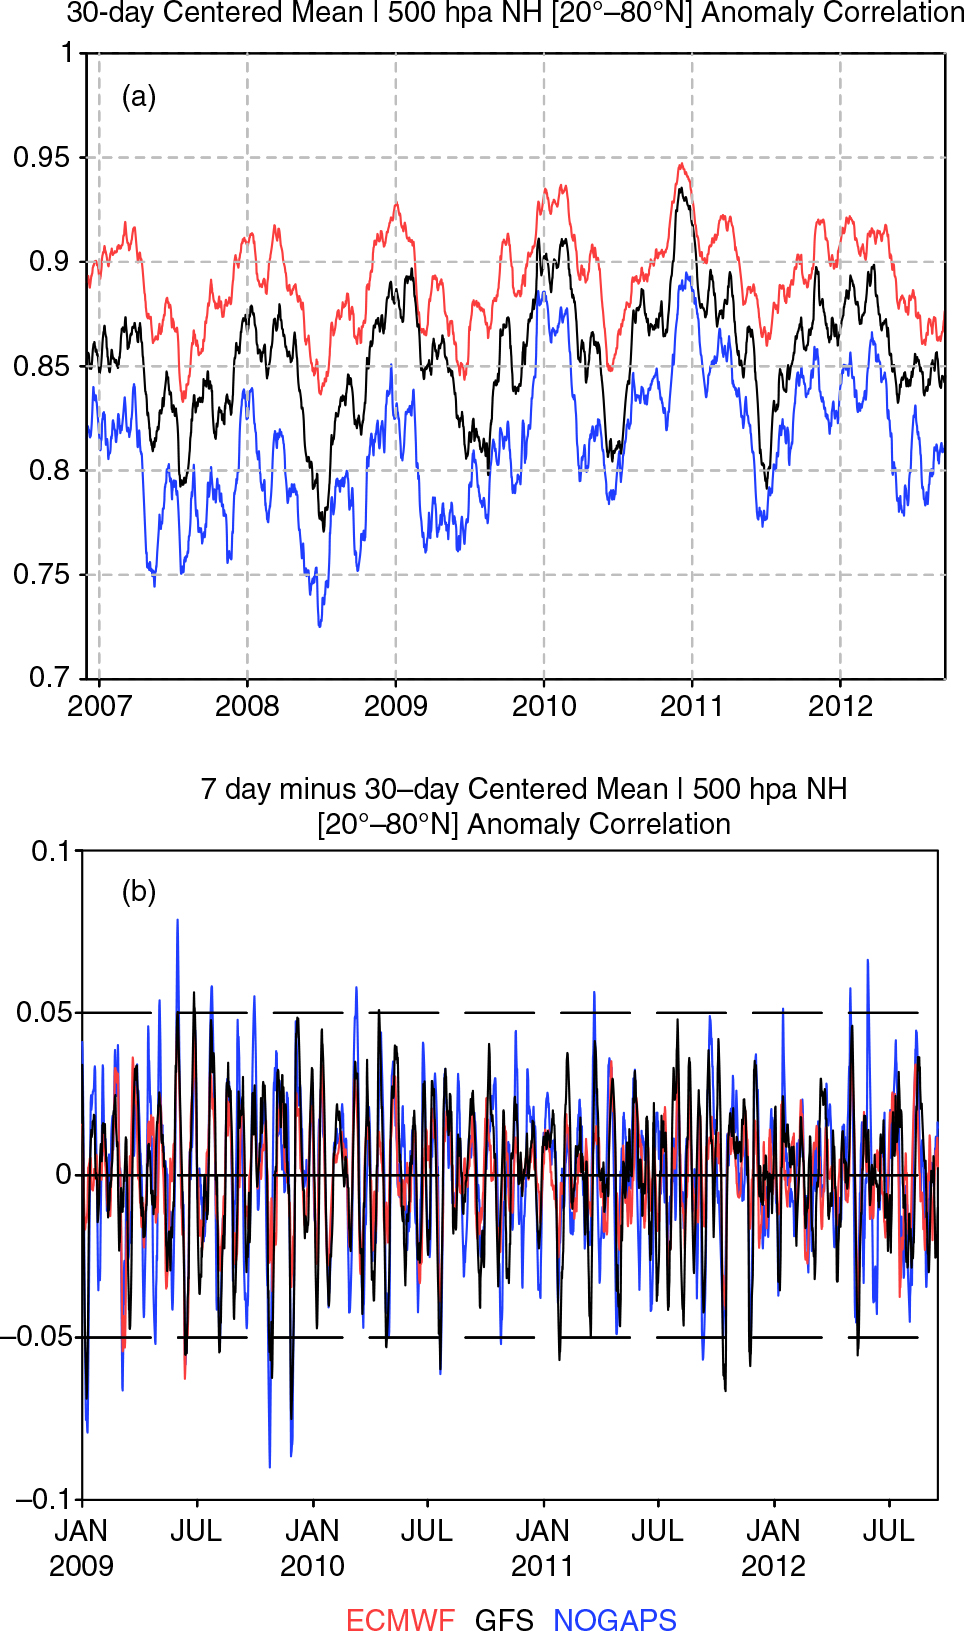
Fig. 2.
Scatter plot of the anomaly correlation coefficient (ACC) for 120-hr forecasts of 500 hPa geopotential height in the domain 20°–80°N for European Centre for Medium-Range Weather Forecasts (ECMWF) and National Centers for Environmental Prediction (NCEP) Global Forecast System (GFS). Includes all forecasts made from 00UTC and 12UTC during October 2006 to September 2012. Red square markers indicate ACC values of 0.70 or less.
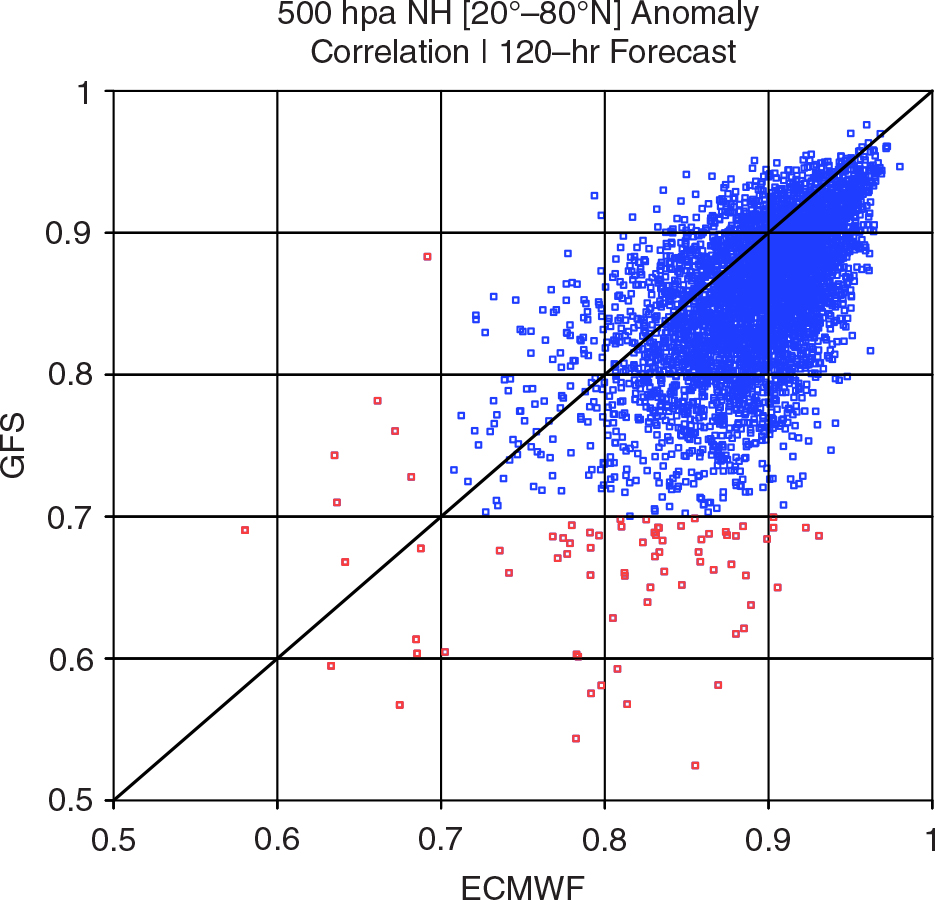
Fig. 3.
Anomaly correlation coefficient (ACC) for 120-hr forecasts of 500 hPa geopotential height in the domain 20°–80°N for: a) European Centre for Medium-Range Weather Forecasts (ECMWF) and b) National Centers for Environmental Prediction (NCEP) Global Forecast System (GFS), from January 2007 to September 2012. Individual forecasts (from 00UTC and 12UTC) are shown as blue circles, the 30-d centred mean as a black solid line, and the 90-d centred mean as a solid red line. The x-axis indicates initial-time of the forecasts.
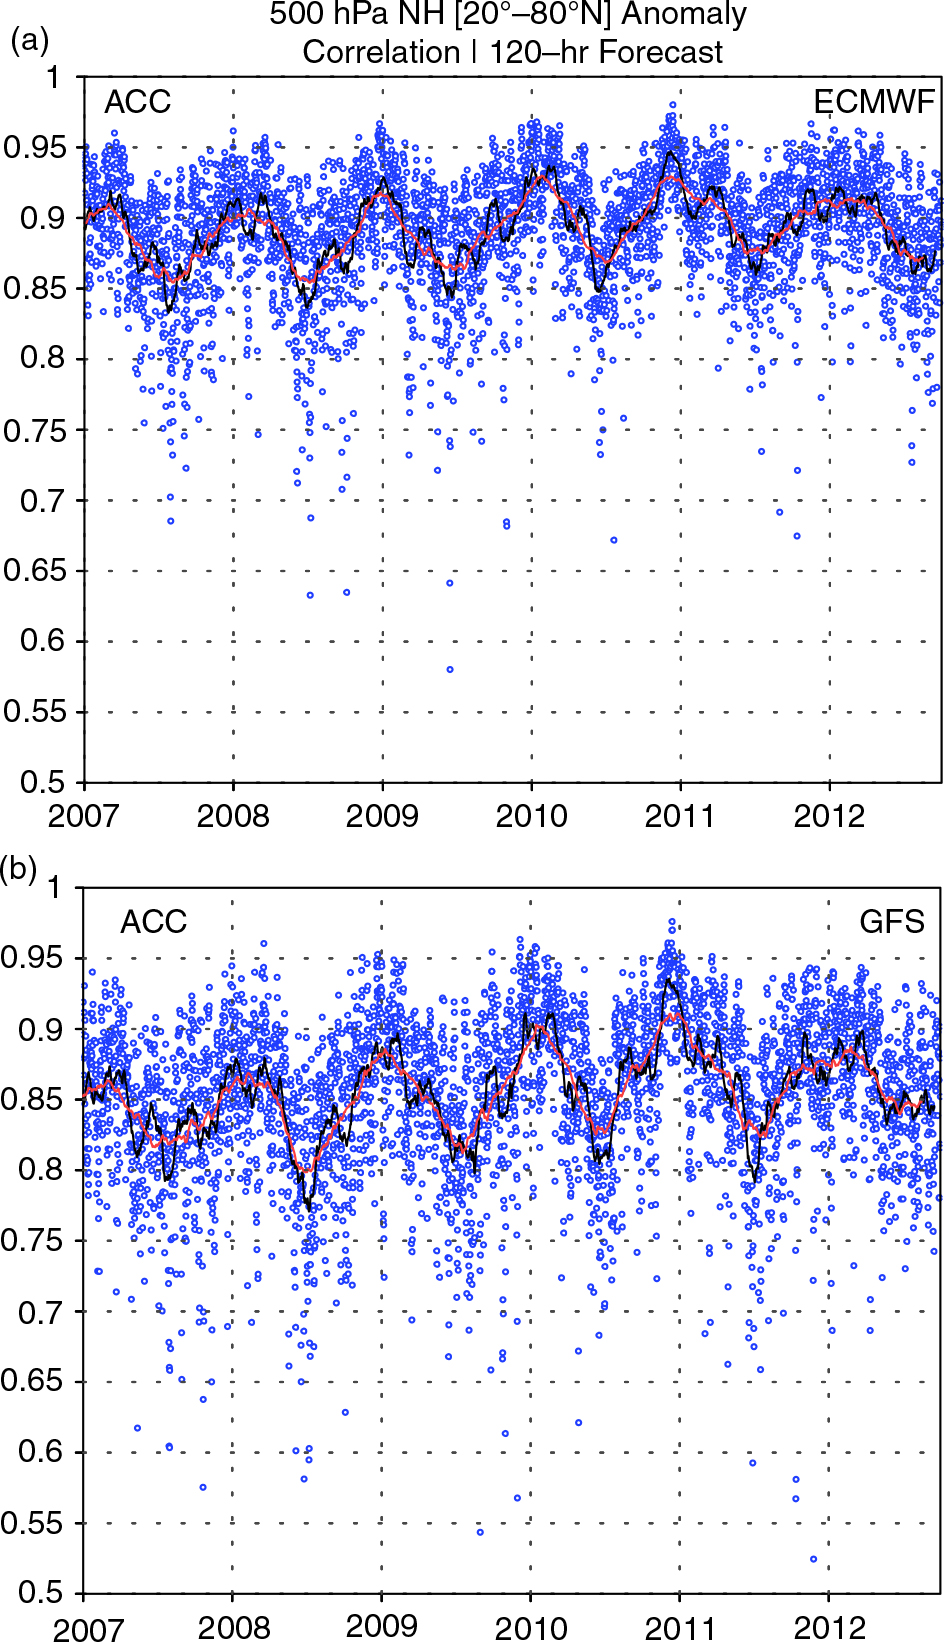
Fig. 4.
Time series of the Arctic Oscillation (AO) index (shown as a solid black line and scaled on the left y-axis). Panels a) and c) show the anomaly correlation coefficient (ACC) for 120-hr forecasts of 500 hPa geopotential height in the domain 20°–80°N for, respectively, European Centre for Medium-Range Weather Forecasts (ECMWF) and National Centers for Environmental Prediction (NCEP) Global Forecast System (GFS), plotted as a blue line and scaled on the right y-axis. Panels b) and d) show the root mean square error (RMSE) for 120-hr forecasts of 500 hPa geopotential height in the domain 20°–80°N for, respectively, ECMWF and GFS, plotted as a blue line and scaled on the right y-axis. The x-axis indicates initial time of forecasts made from 00UTC and 12UTC, during the period 1 November 2009 to 30 April 2010.
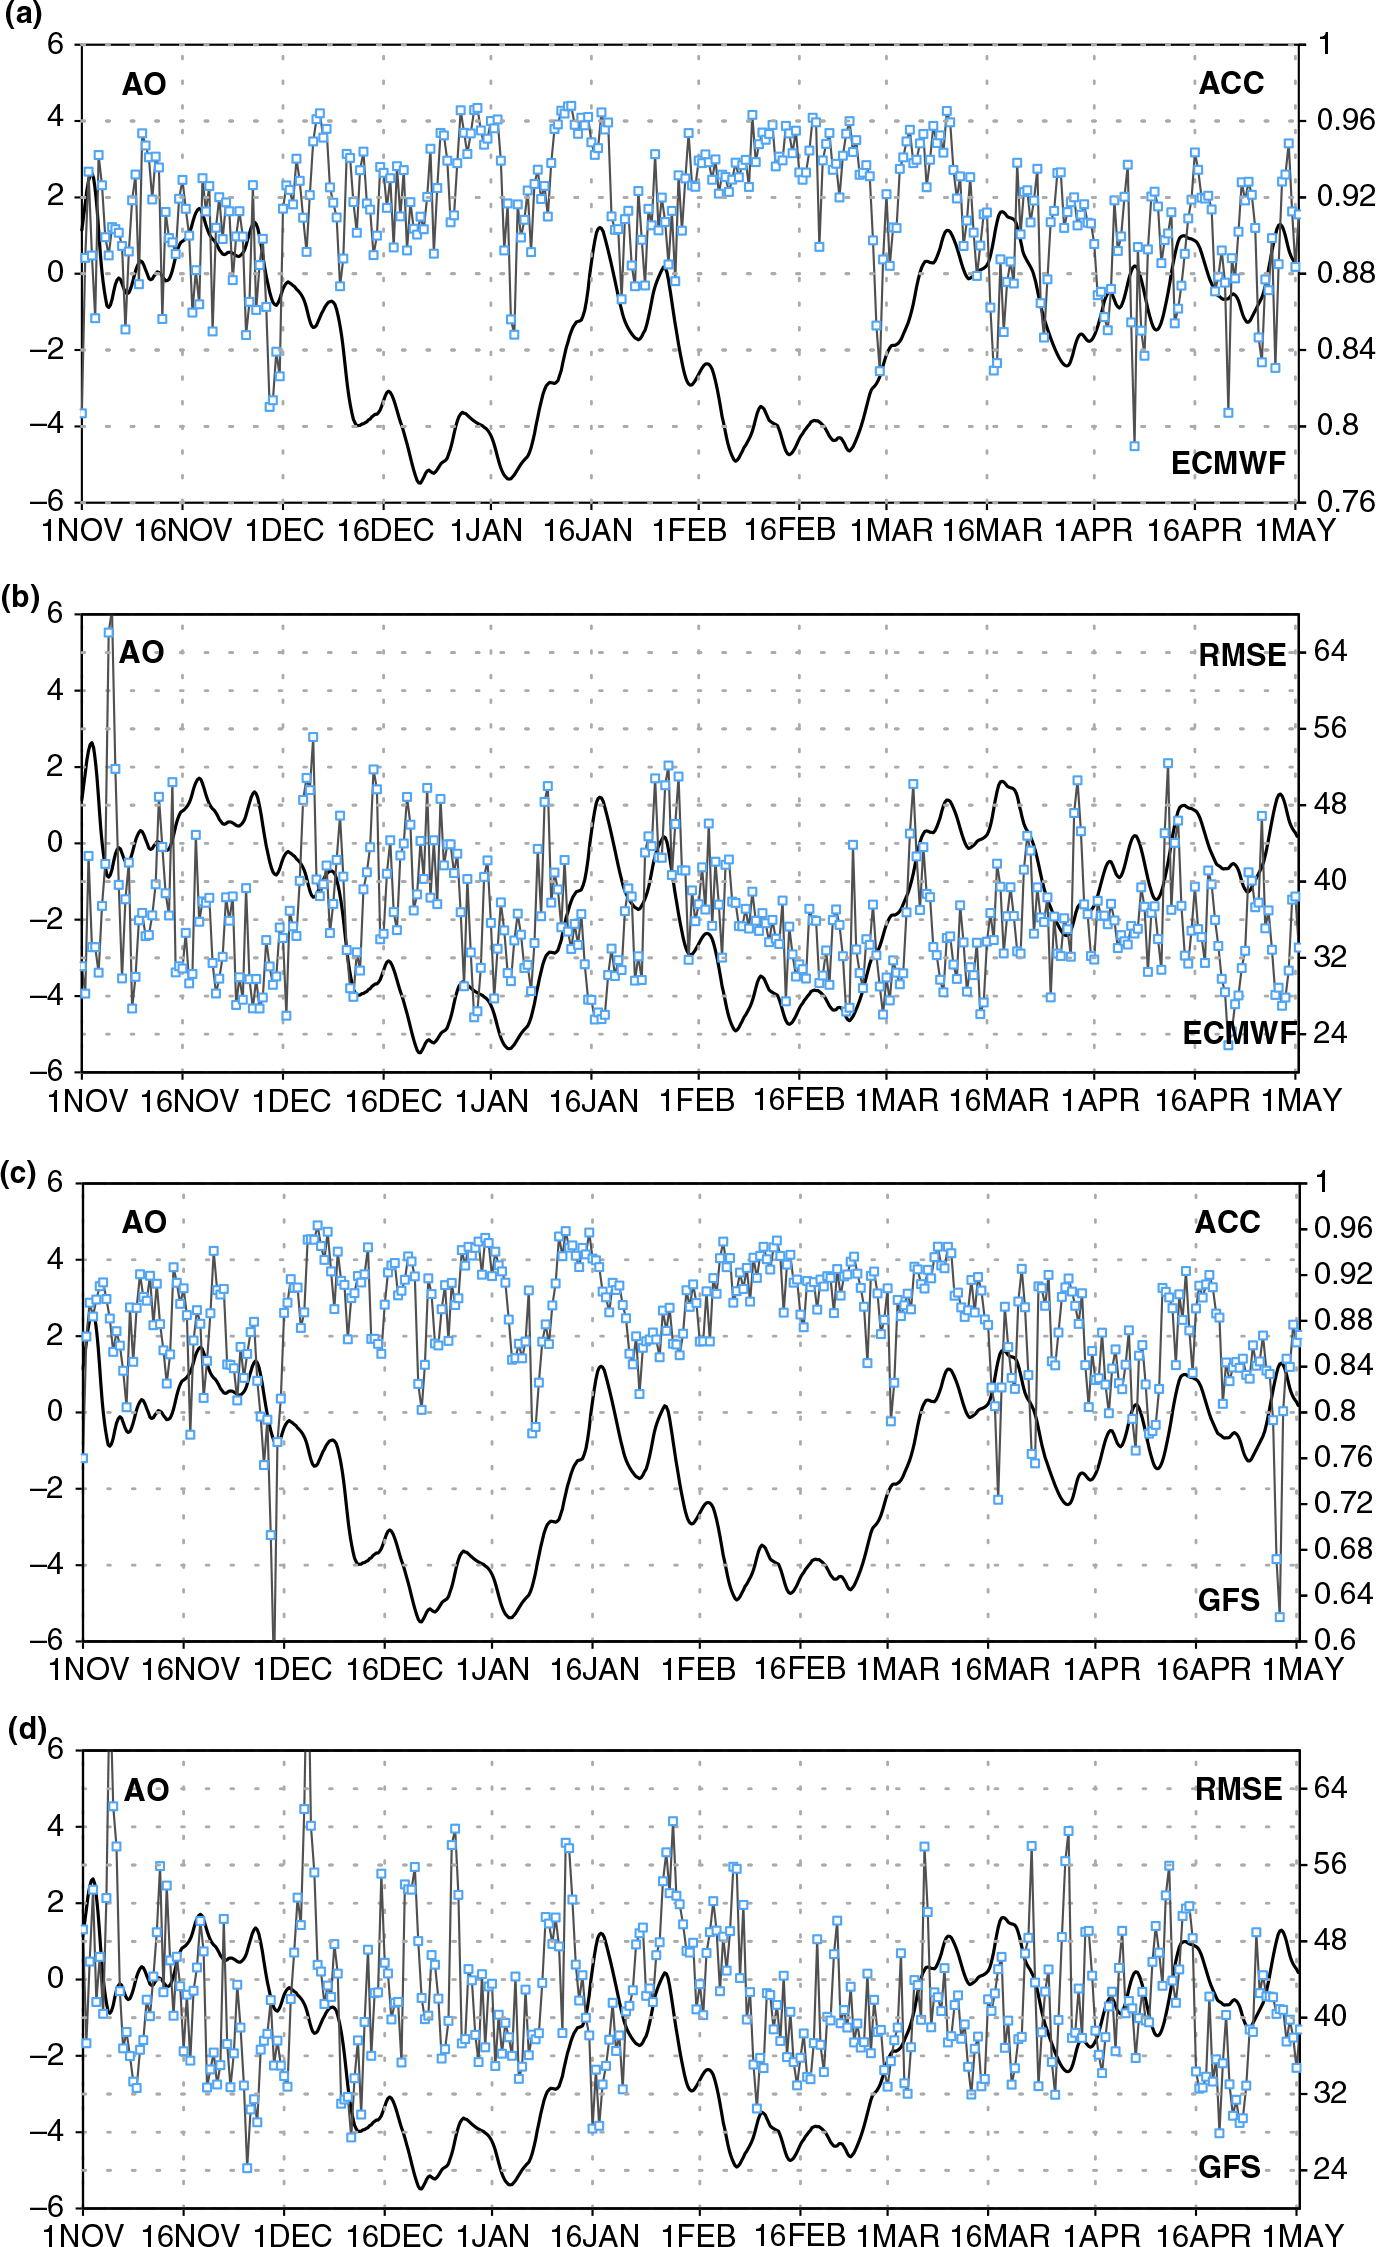
Fig. 5.
As in Fig. 4, but for the time period 1 November 2010 to 30 April 2011.
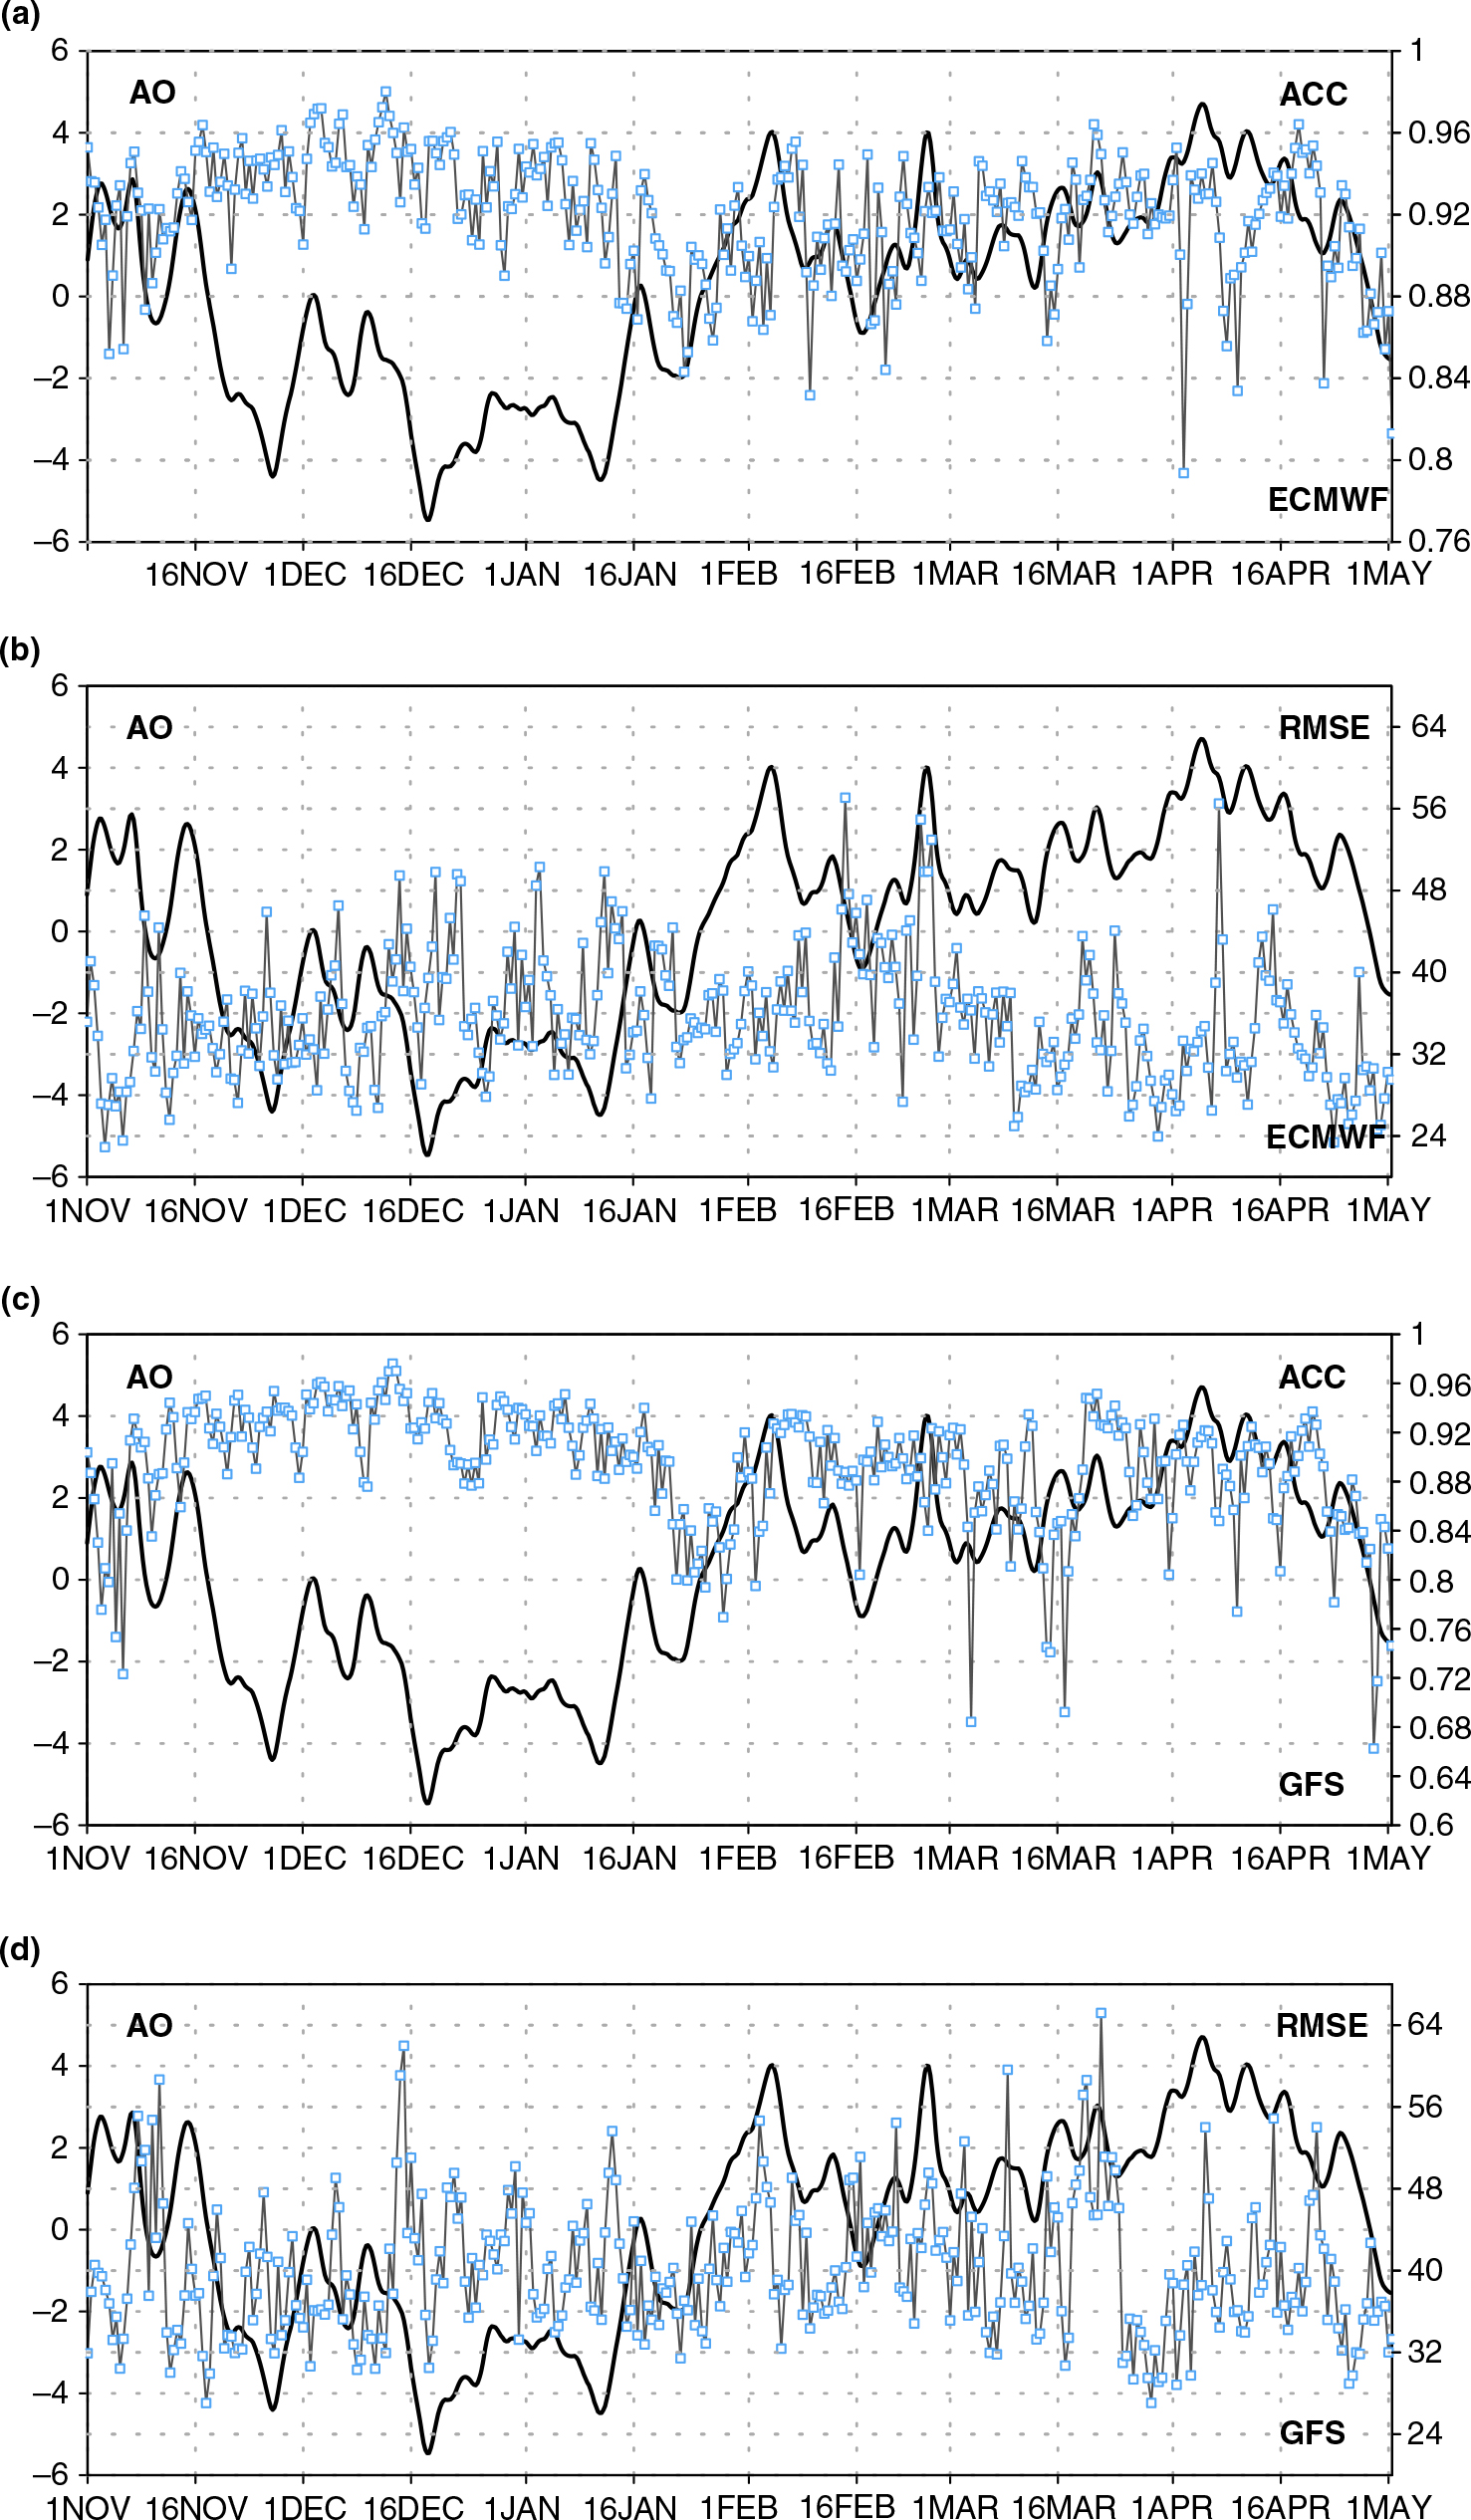
Fig. 6.
(a) European Centre for Medium-Range Weather Forecasts (ECMWF) deterministic forecasts (shown at 6-hr intervals) of the Arctic Oscillation (AO) index. 120-hr forecasts of AO index are shown as blue circles, and 240-hr forecasts as red circles. Forecasts are made from 00UTC and 12UTC. The actual AO index (derived from ECMWF analyses at 00UTC and 12UTC) appears as a solid black line at forecast verification time. Panel (b) shows the anomaly correlation coefficient (ACC) for ECMWF 240-hr forecasts of 500 hPa geopotential height in the domain 20°–80°N. The x-axis indicates verification time, from 1 November 2010 to 30 April 2011.
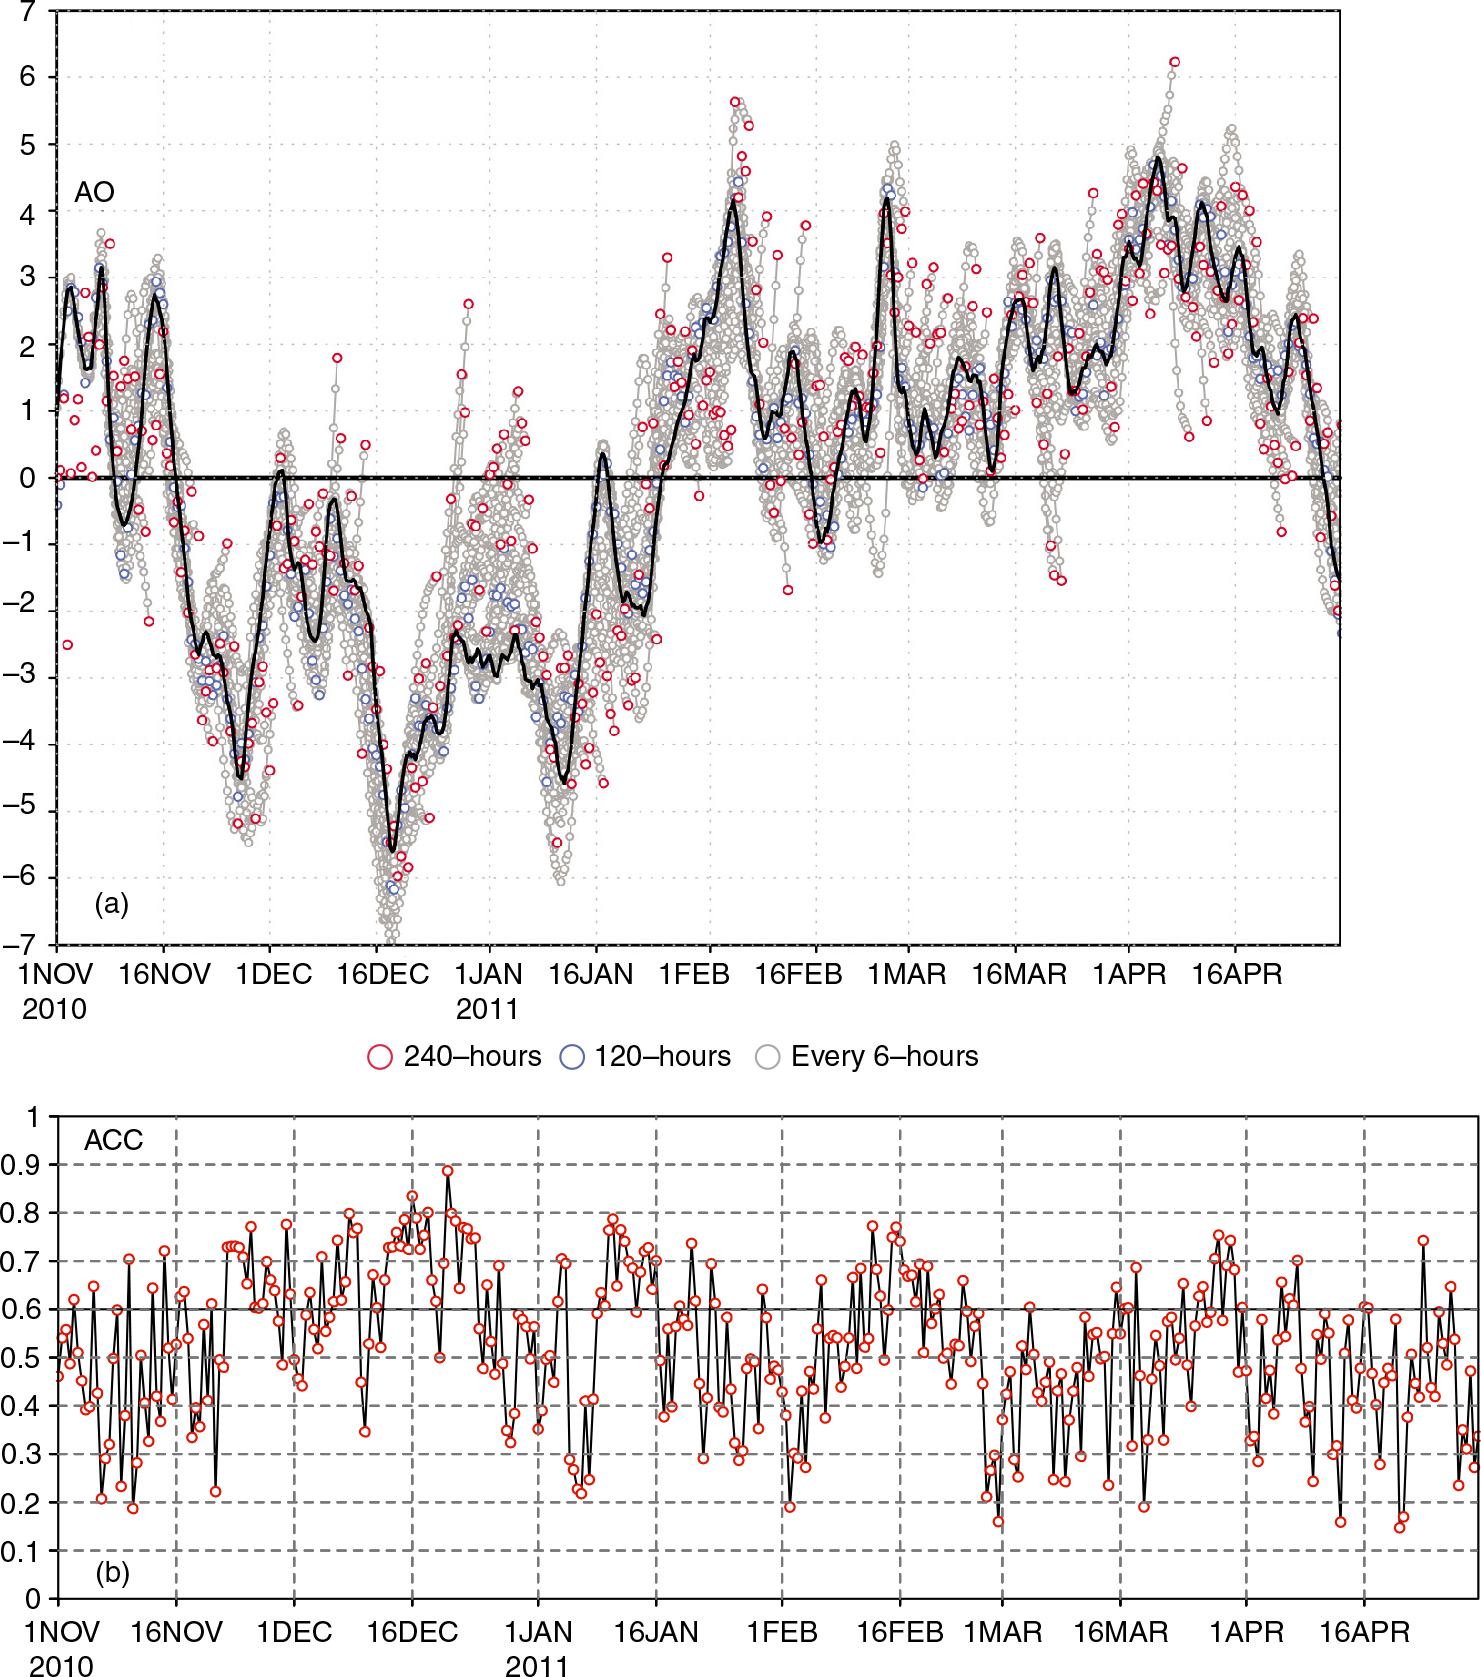
Fig. 7.
Scatter plot of European Centre for Medium-Range Weather Forecasts (ECMWF) deterministic forecasts of the Arctic Oscillation (AO) index for: (a) 120-hr forecasts and (b) 240-hr forecasts, started from 00UTC and 12UTC. The x-axis indicates error (forecast AO minus analysed AO) in forecasts of the AO index. The y-axis is the analysed AO index at forecast verification time. The figure includes Northern Hemisphere (NHEM) cold season forecasts (1 October to 1 March), 2008 to 2012.