Have a personal or library account? Click to login
Wind gust estimation for Mid-European winter storms: towards a probabilistic view Cover

Wind gust estimation for Mid-European winter storms: towards a probabilistic view

Open Access
|Dec 2012

Figures & Tables

Fig. 1. 

(a) Year and month of simulated storms from 1972 to 2008, in a total of 158 storms and (b) COSMO-CLM model region, including orography, colour scale in m.
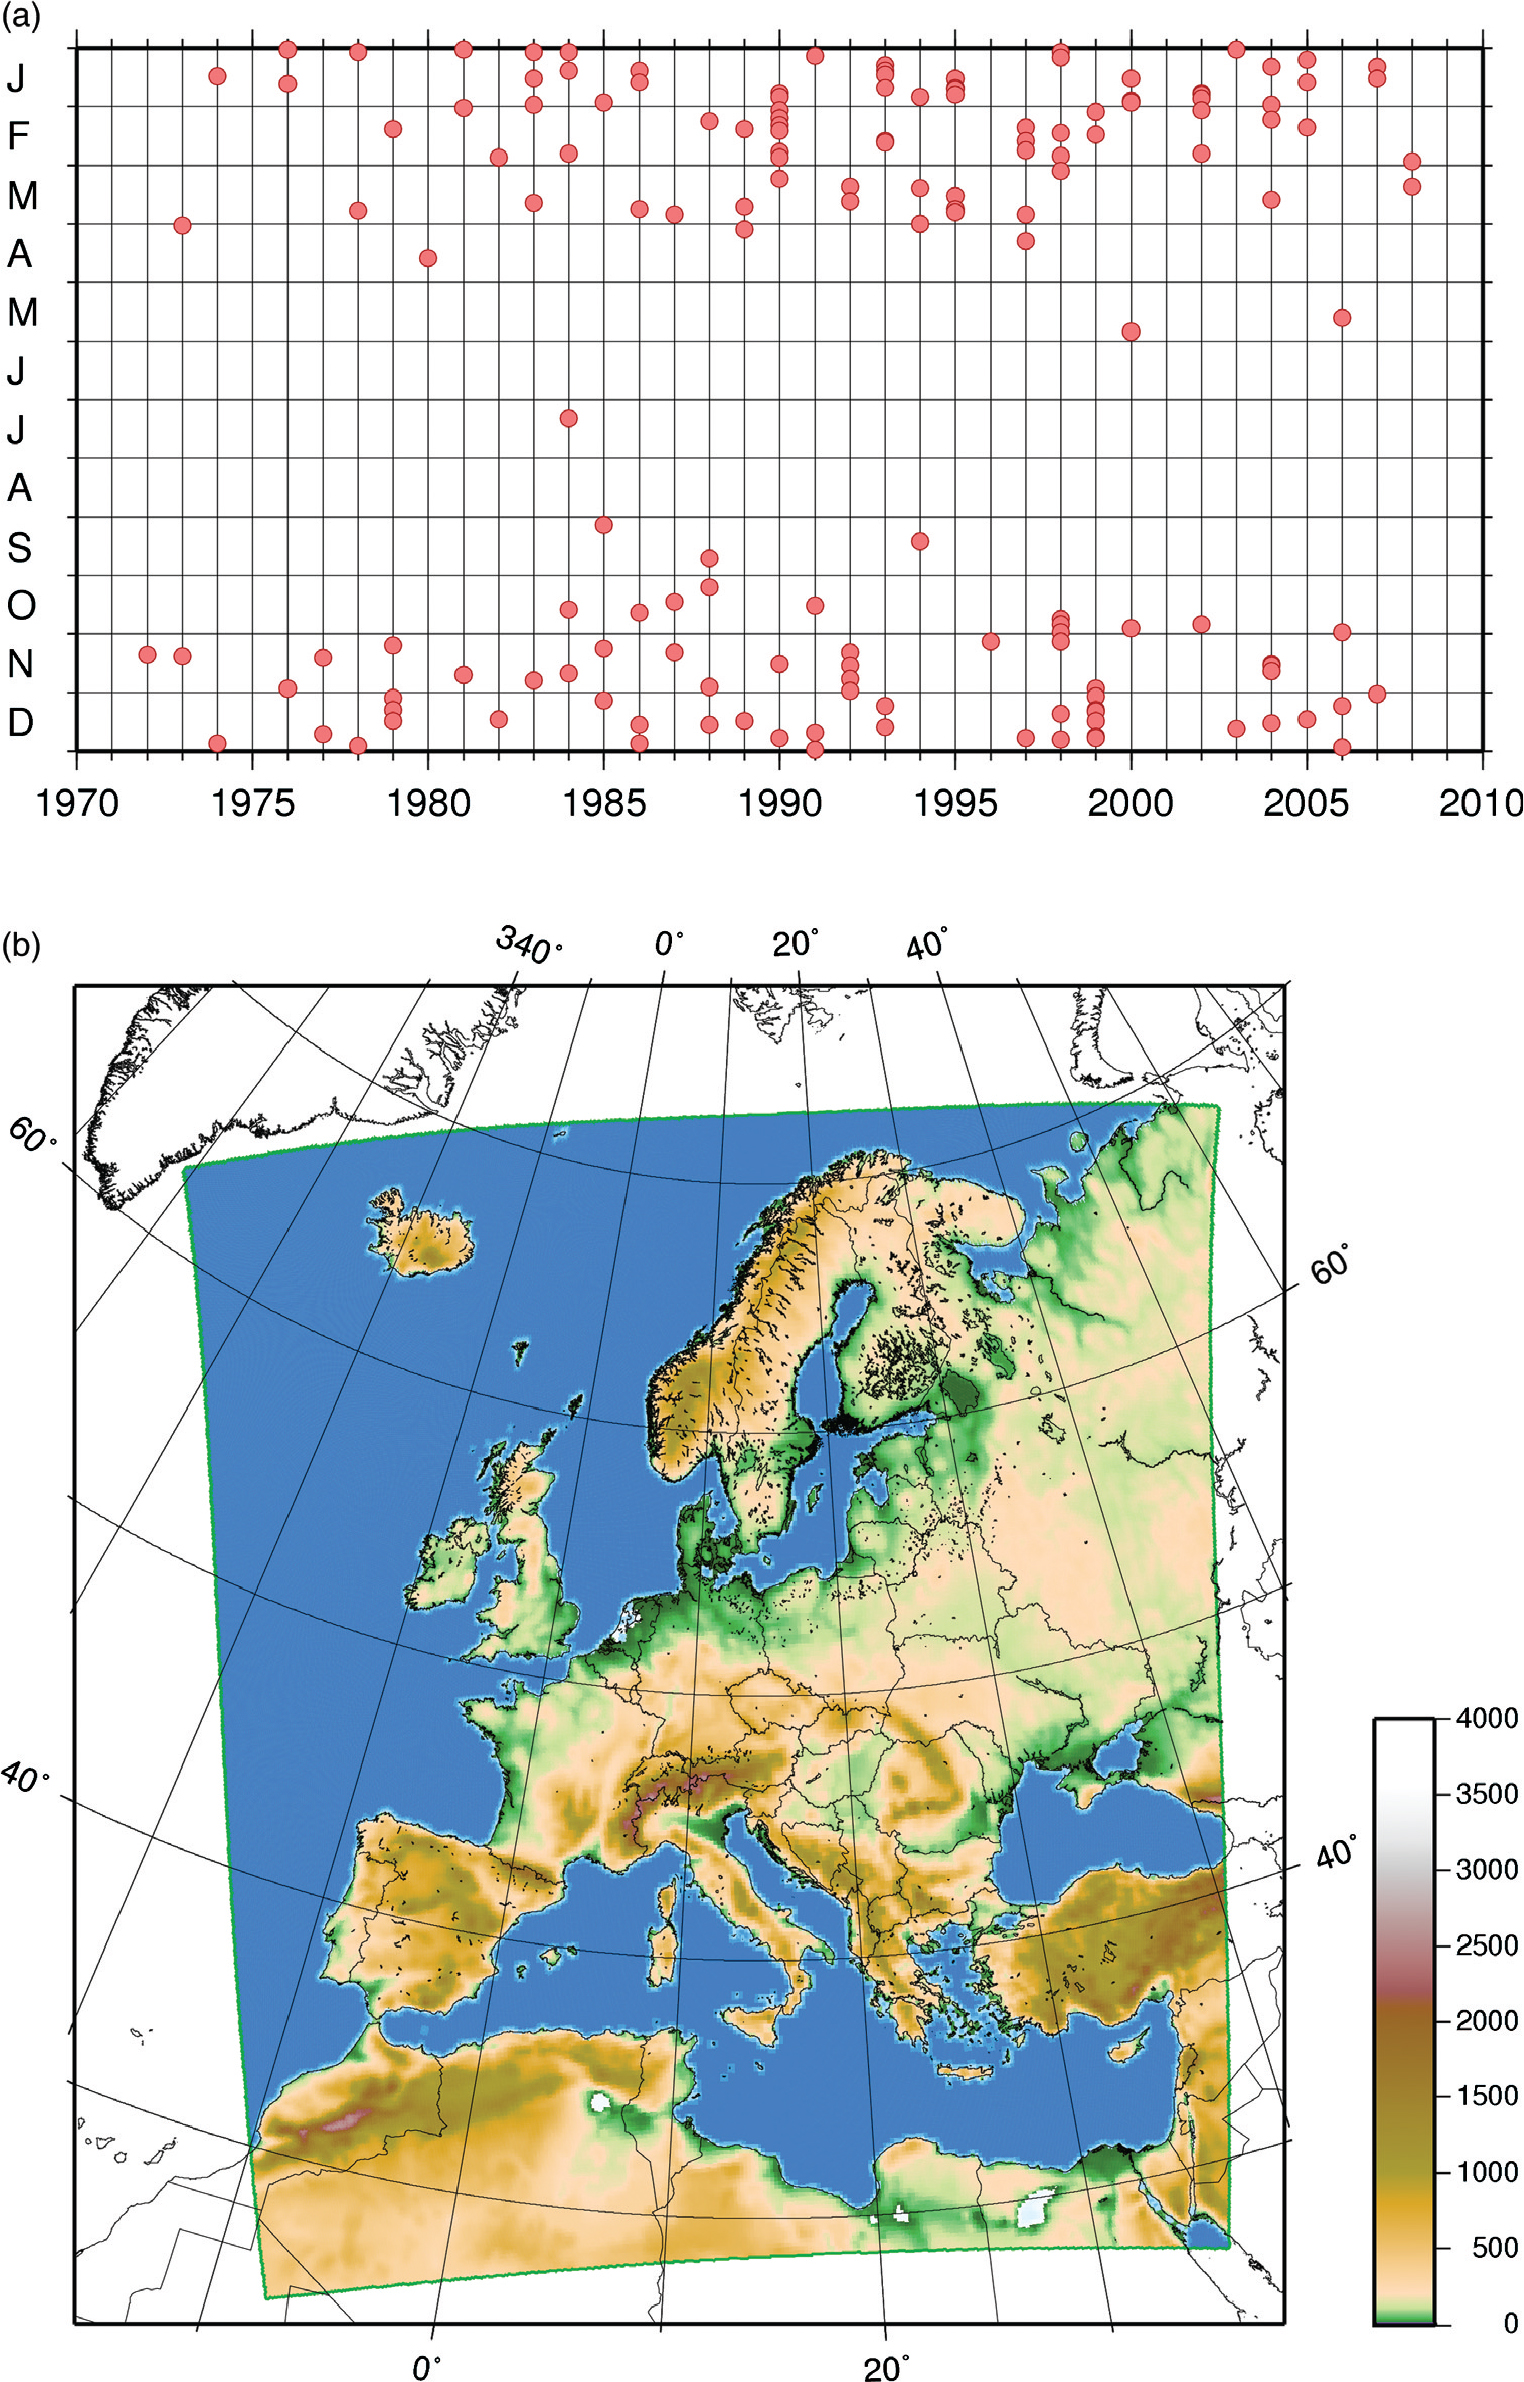
Table 1. Information on the 37 observational sites, including WMO number, station name, geographical location and height above seal level

WMO no. Name Lat (°N) Lon (°E) Elevation (m a.s.l.) Daily hourly data available from Until Hourly values Gusts (%) 10020 SYLT 55.01 8.25 26 1 January 1976 1 January 1979 31 December 2005 226933 20.51 10113 NORDERNEY 53.43 7.09 11 1 January 1976 1 January 1979 31 December 2005 202600 15.44 10129 BREMERHAVEN 53.32 8.35 7 1 January 1976 1 January 1979 31 December 2005 231334 8.77 10147 HAMBURG-FUHLS. 53.38 9.59 11 1 January 1976 1 January 1981 31 December 2005 204360 6.33 10161 BOLTENHAGEN 54.00 11.12 15 1 January 1976 29 August 1977 31 December 2005 230103 11.10 10162 SCHWERIN 53.39 11.23 59 1 January 1976 29 August 1977 31 December 2005 226453 6.27 10170 ROSTOCK-WARNEM. 54.11 12.05 4 1 January 1976 29 August 1977 31 December 2005 229428 9.93 10224 BREMEN 53.03 8.48 5 1 January 1976 1 January 1981 31 December 2005 211507 6.55 10270 NEURUPPIN 52.54 12.49 38 1 July 1975 29 August 1977 31 December 2000 171210 3.73 10291 ANGERMUENDE 53.02 14.00 54 1 July 1975 29 August 1977 31 December 2000 170598 5.27 10317 OSNABRUECK 52.15 8.03 95 1 January 1976 1 January 1979 31 December 2005 177067 6.20 10338 HANNOVER-LANG. 52.28 9.41 59 1 January 1976 1 January 1976 31 December 2005 238068 4.97 10368 WIESENBURG 52.07 12.28 187 11 June 1990 11 June 1990 31 December 2000 88271 10.95 10382 BERLIN-TEGEL 52.34 13.19 36 2 January 1961 2 January 1961 31 December 2000 190182 2.66 10384 BERLIN-TEMP. 52.28 13.24 49 1 January 1950 1 January 1950 31 December 2000 368920 2.11 10385 BERLIN-SCHOEN. 52.23 13.32 45 1 July 1975 29 August 1977 31 December 2000 186349 3.61 10393 LINDENBERG 52.13 14.07 98 1 July 1975 29 August 1977 31 December 2000 182616 3.86 10396 MANSCHNOW 52.33 14.33 12 11 June 1990 11 June 1990 31 December 2000 85474 9.00 10438 KASSEL 51.18 9.27 231 1 January 1976 1 January 1979 31 December 2005 205664 3.03 10453 BROCKEN 51.48 10.37 1142 1 January 1976 29 August 1977 31 December 2005 235536 30.96 10469 LEIPZIG 51.26 12.14 131 1 January 1976 29 August 1977 31 December 2005 229602 5.02 10488 DRESDEN 51.08 13.45 227 1 January 1976 29 August 1977 31 December 2005 223602 5.27 10499 GOERLITZ 51.10 14.57 238 1 January 1976 29 August 1977 31 December 2005 218607 7.75 10513 KOELN-WAHN 50.52 7.10 92 1 January 1976 1 January 1981 31 December 2005 205973 3.16 10609 TRIER-PETRISBERG 49.45 6.40 265 1 January 1976 1 January 1979 31 December 2005 211573 5.71 10637 FRANKFURT/M. 50.03 8.36 112 1 January 1976 1 January 1981 31 December 2005 202463 4.47 10685 HOF-HOHENSAAS 50.19 11.53 567 1 January 1976 1 January 1979 31 December 2005 220504 7.23 10727 KARLSRUHE 49.02 8.22 112 1 January 1976 1 January 1979 31 December 2005 182201 5.87 10729 MANN HElM 49.31 8.33 96 1 January 1976 1 January 1979 31 December 2005 197812 2.55 10738 STUTTGART-ECH. 48.41 9.14 371 1 January 1976 1 January 1981 31 December 2005 181479 3.23 10763 NUERNBERG-KRA. 49.30 11.03 314 1 January 1976 1 January 1981 31 December 2005 194281 2.74 10803 FREIBURGI.BR. 48.00 7.51 269 1 January 1976 1 January 1979 31 December 2005 211339 5.19 10838 ULM 48.23 9.57 571 1 January 1976 1 January 1979 31 December 2005 172506 2.60 10852 AUGSBURG-MUEHLH. 48.26 10.57 462 1 January 1976 1 January 1979 31 December 2005 198728 3.68 10908 FELDBERG/SCHW. 47.53 8.00 1486 1 January 1976 1 January 1979 31 December 2005 211775 24.58 10961 ZUGSPITZE 47.25 10.59 2960 1 January 1976 1 January 1979 31 December 2005 209701 26.26 10980 WENDELSTEIN 47.42 12.01 1832 1 January 1976 1 January 1979 31 December 2005 193686 23.55

[i] In addition, the start/end dates, since/until daily and hourly observations are available. Last two columns mention the amount of available hourly values and the fraction of gusts therein, respectively.

Fig. 2. 

Density plots of gust versus 10 m wind speed (upper row) and gust factors versus 10 m wind speed (lower row) for three exemplary climate observation sites, representative for an exposed mid-range mountain (Brocken, 10453), a maritime/coastal region (List/Sylt, 10020) and a low-range hilly region far from the coast (Trier, 10609). Colour shades represent normalised density of observations, lines represent a quantile regression of the gust factors for the 5, 25, 50, 75 and 95% quantiles. For more details on each station, see Table 1.
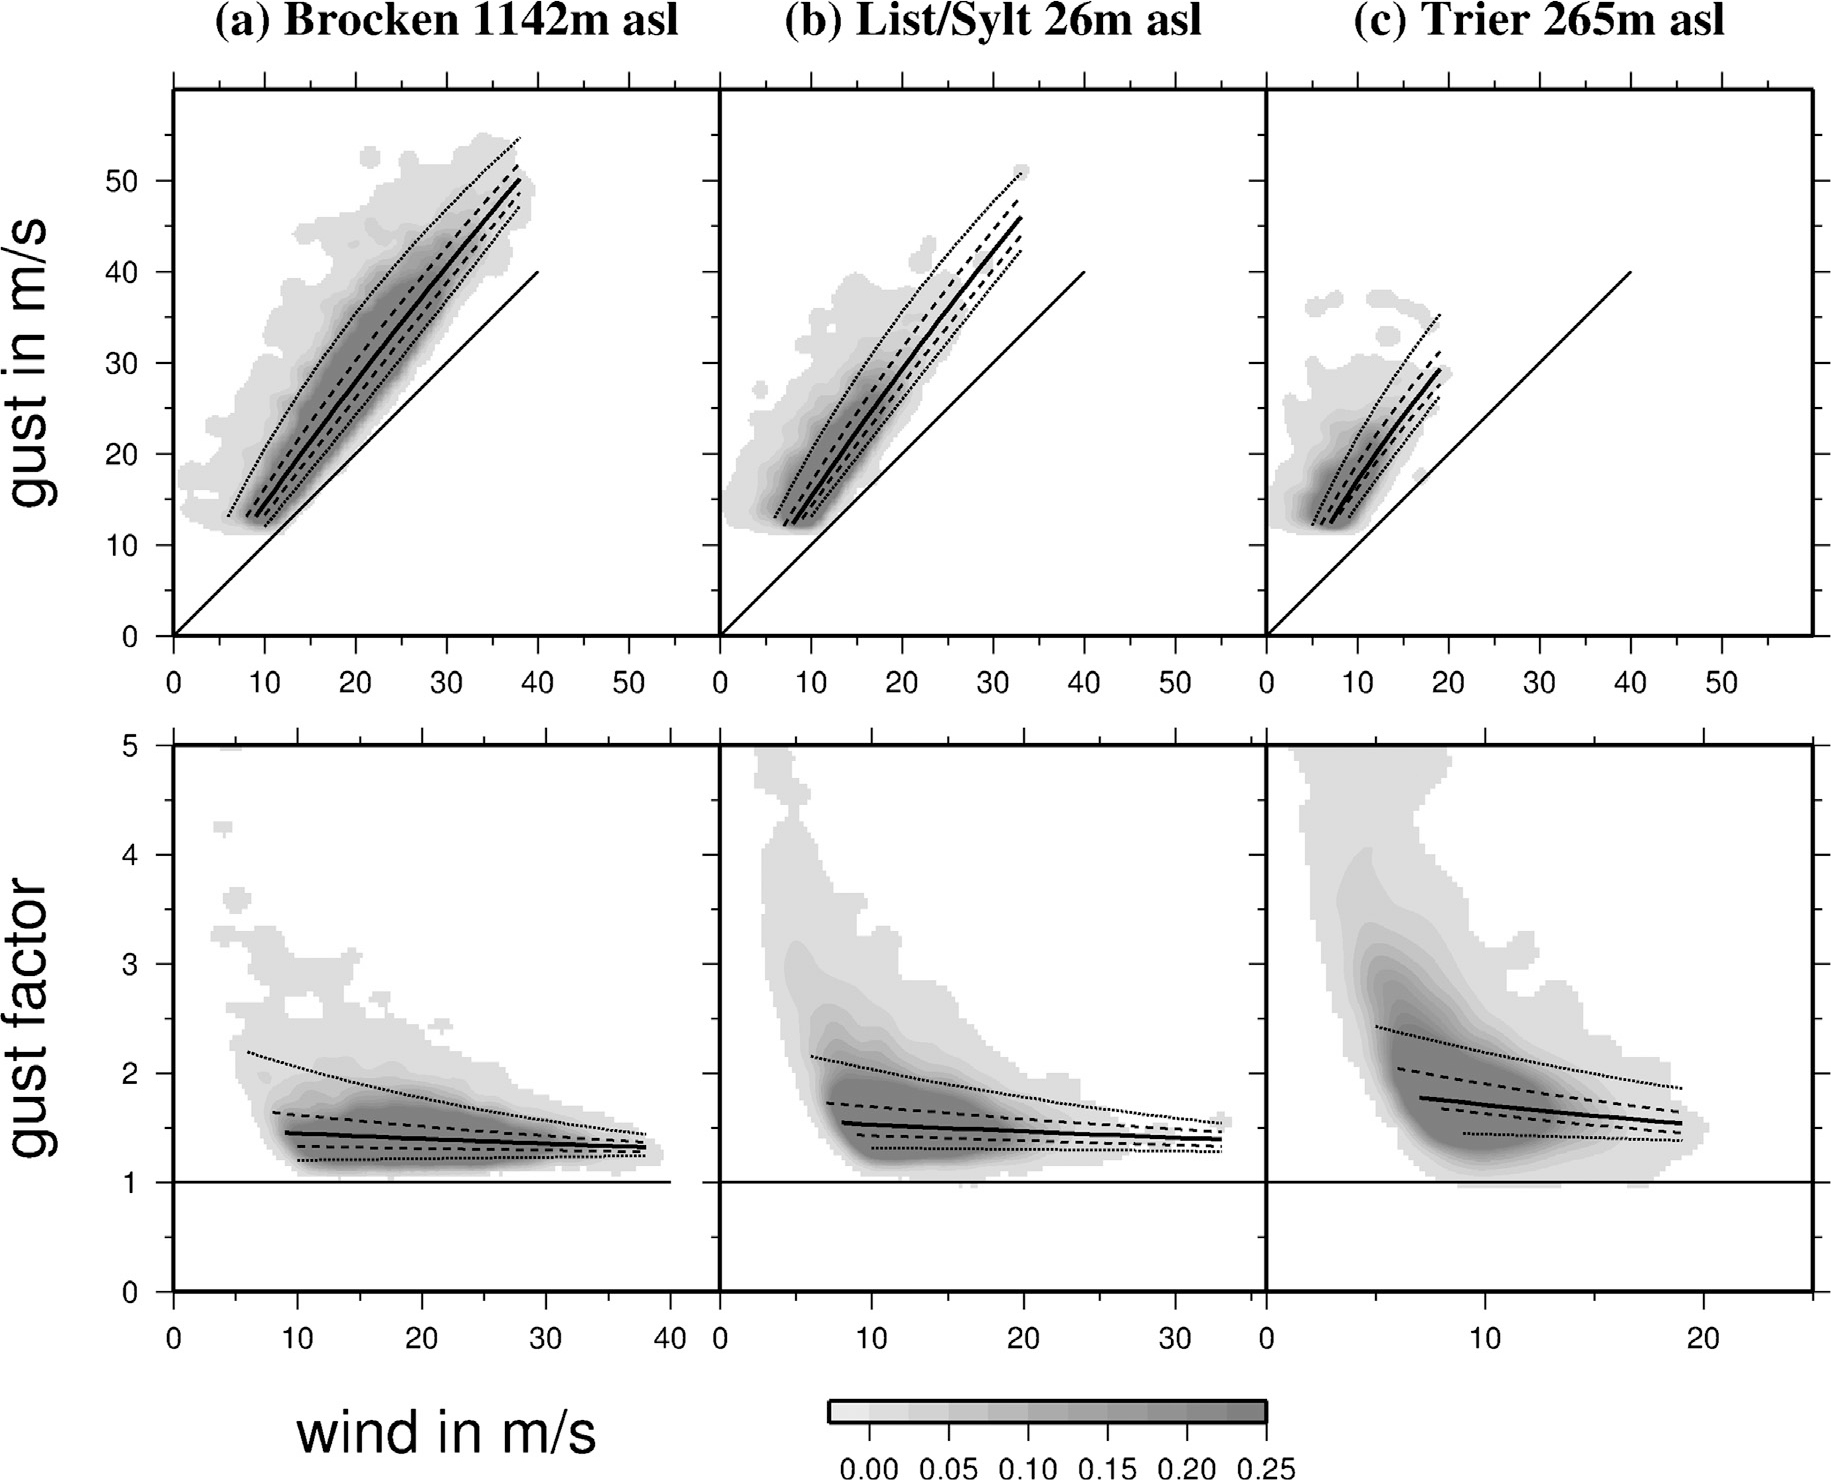
Fig. 3. 

(a) Mean gust factors at observational sites (x-axis) against latitude. (b) Mean gust factors against heights of observational sites. The box and whiskers show mean values for the 5, 25, 50, 75 and 95% quantile, respectively. (c) Mean 50% quantiles of the gust factors are depicted as colour dots on their geographical location. Ten stations with very low numbers of observations have been excluded from this plot. For more details on each station, see Table 1.
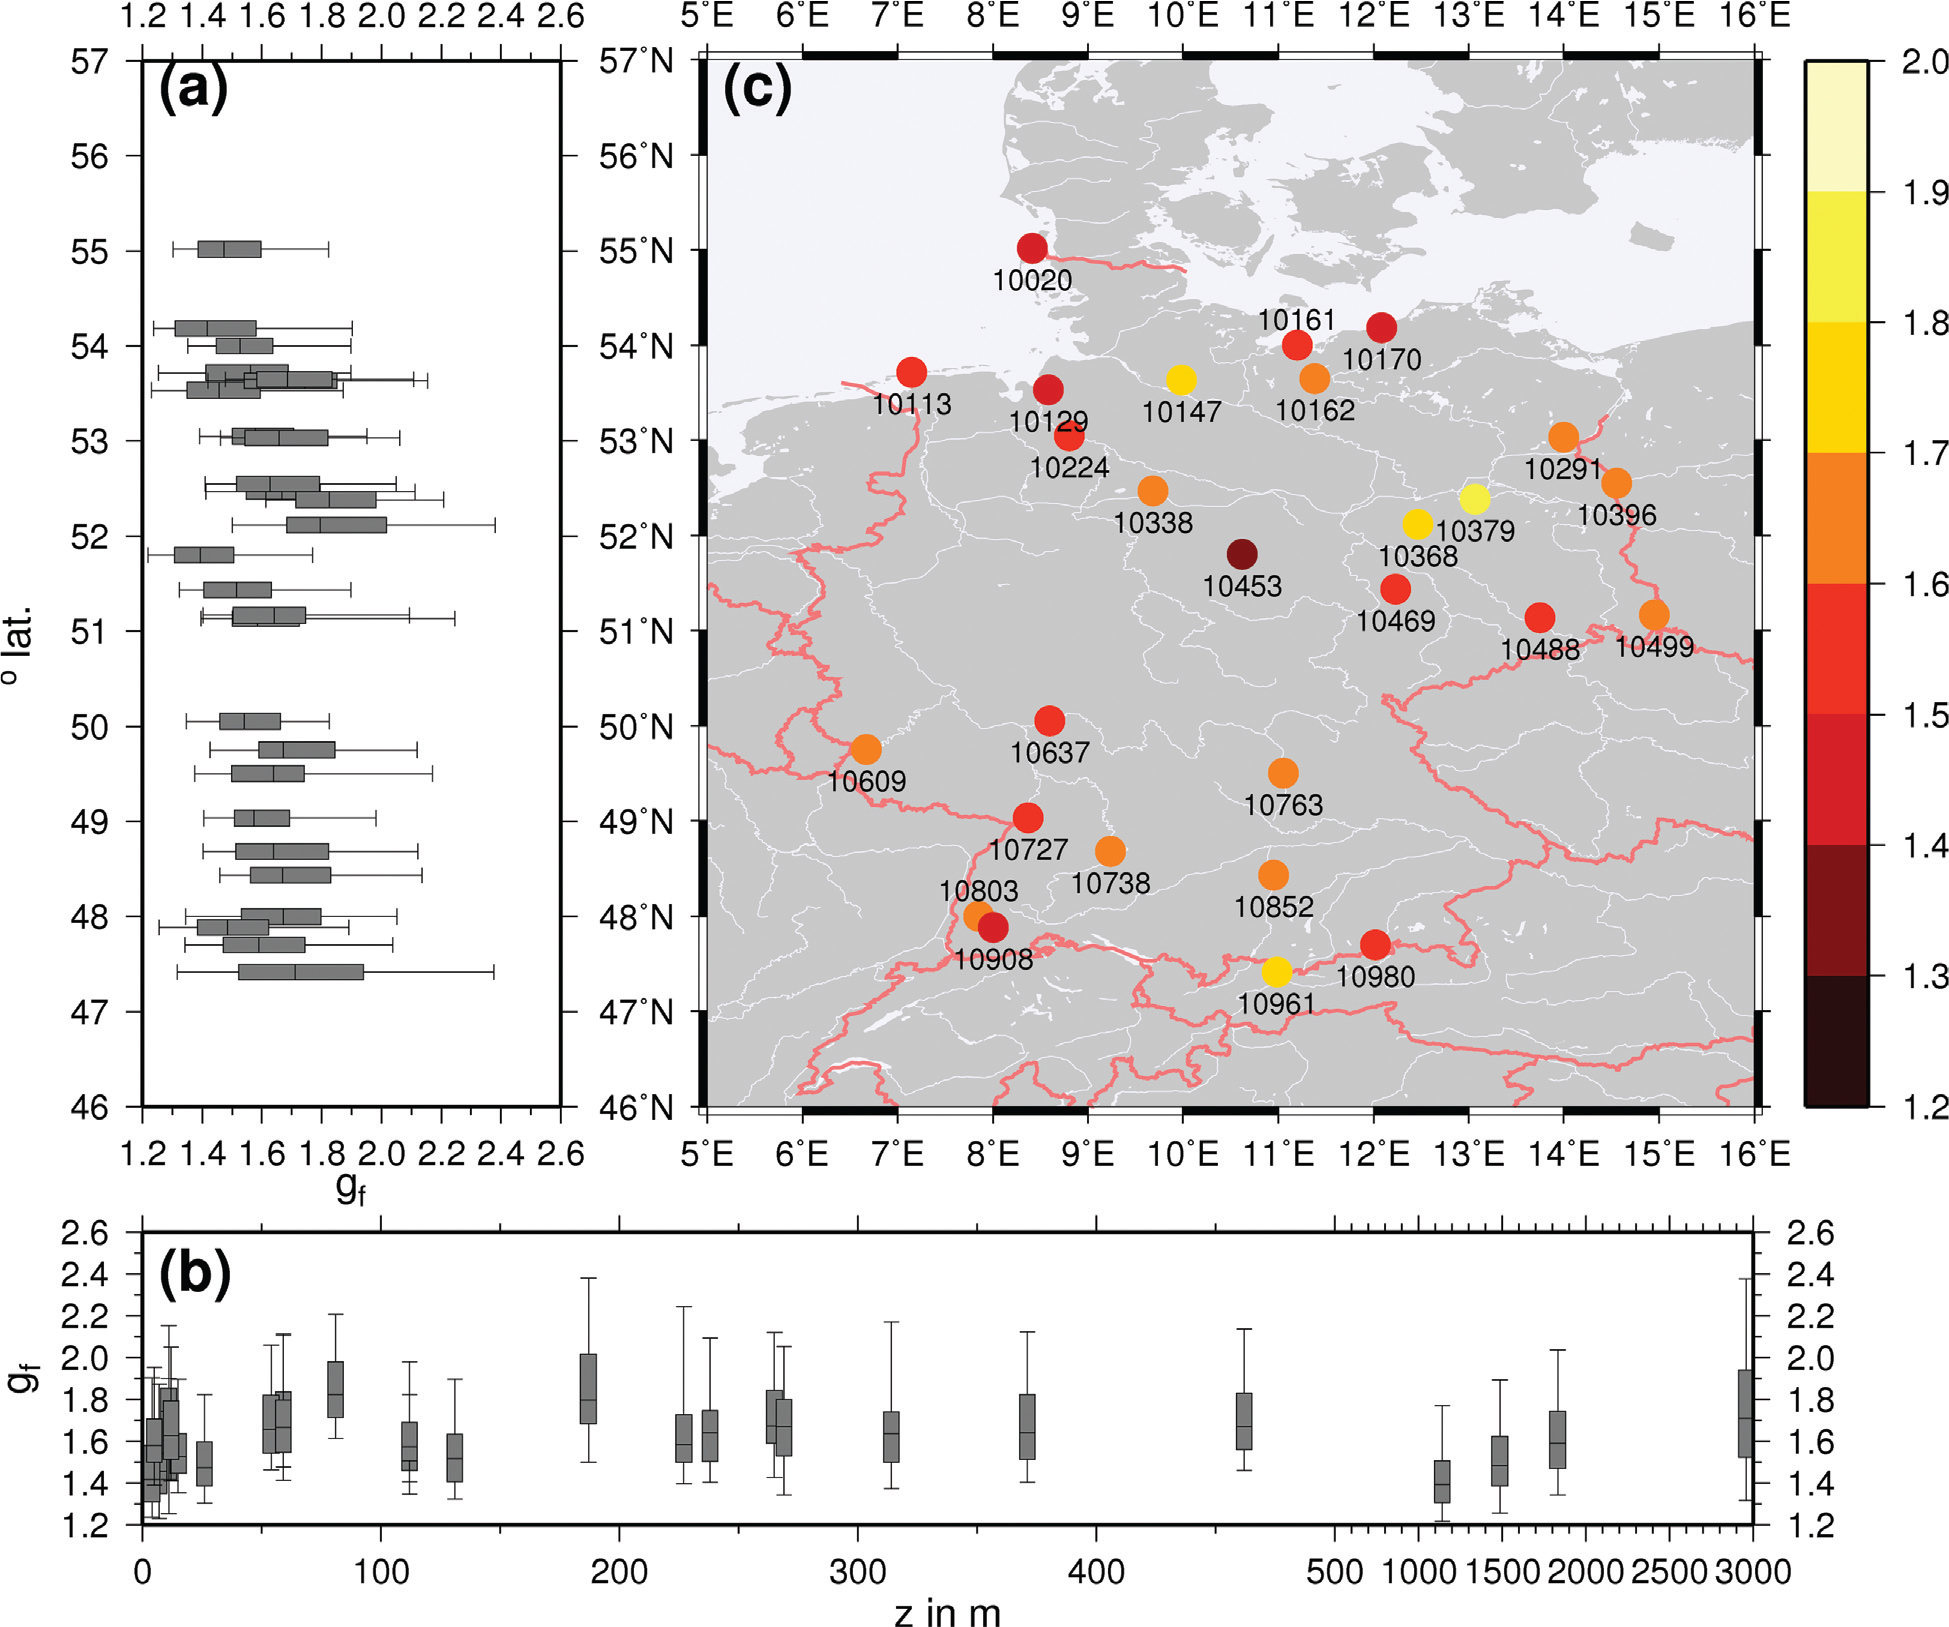
Fig. 4. 

Evaluation of the MLR model for the width of local gust factor distributions. Predictors are distance from the German Bight (dist), height of the site (height), roughness length at the site (z0) and orographic variance within a circle of 10 km diameter (oro_var). (a) Adjusted coefficient of determination (COFD, left axis) for different combinations of predictors, ranked by their performance in terms of the COFD: the predictors used for each one model (rows) are marked with grey boxes. The best model with the highest COFD uses all predictors except roughness length (topmost row). (b) Scatter plot of the estimated and observed values by the optimum model. Crosses mark estimates of the full calibration; blue dots mark a cross-validation by leaving out data of the site. The station ‘Zugspitze’ is marked with the station number 10961.
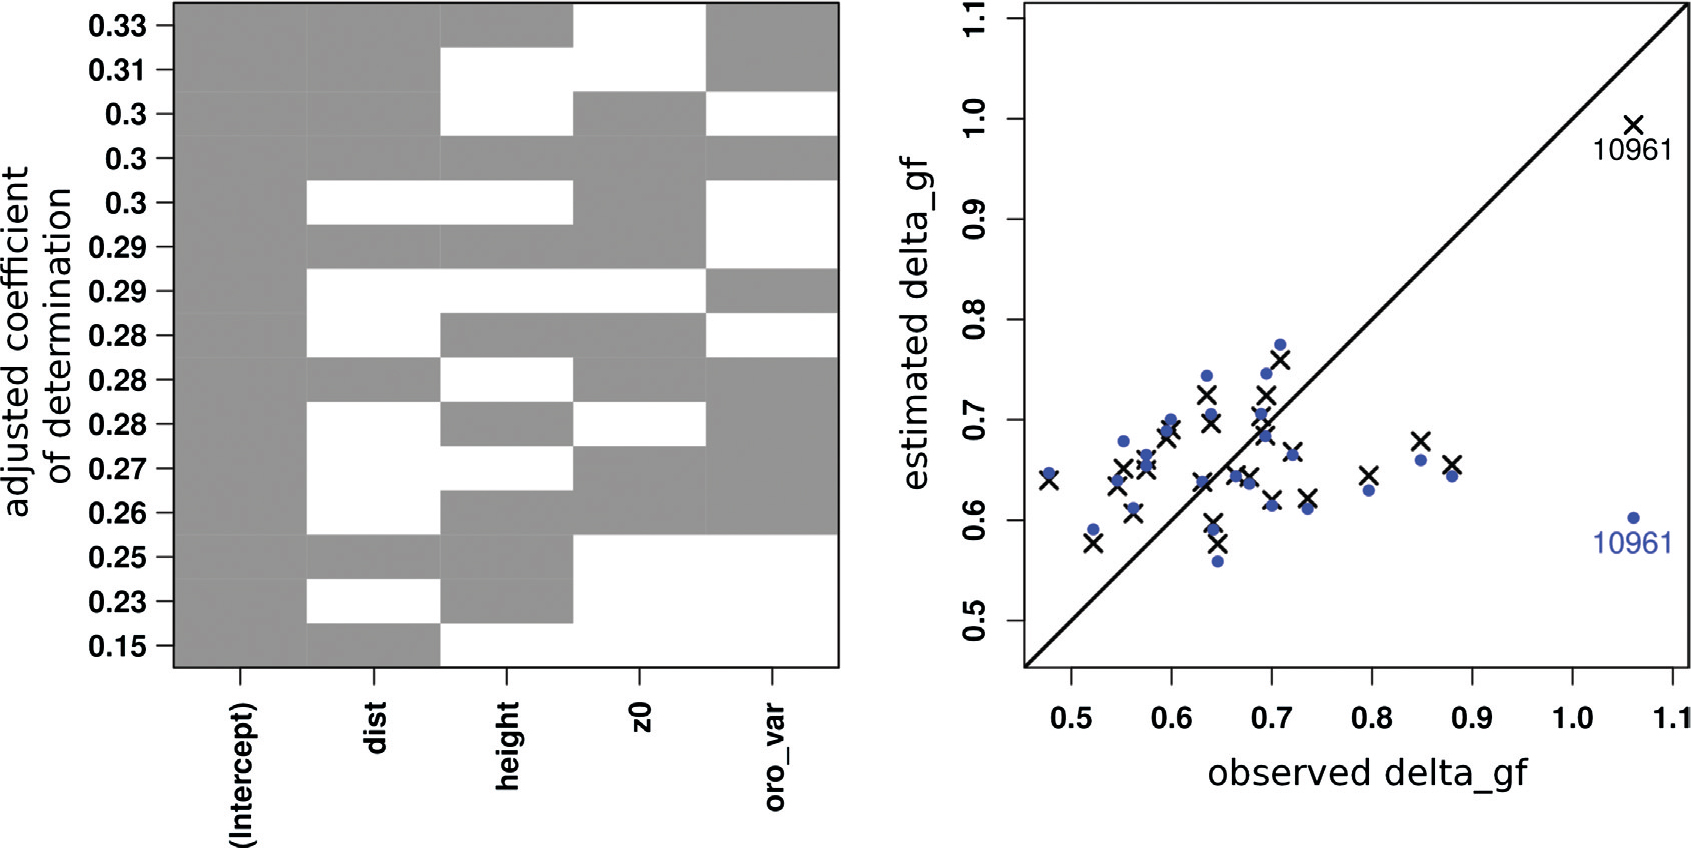
Fig. 5. 

Storm tracks, storm footprints (maximum wind gust speed during the event) and series of minimum pressure for four of the strongest storm events simulated with the COSMO-CLM (green tracks, colour-shaded gust speed in m s−1), in comparison to ERA-Interim Reanalysis (black tracks). The lower panels show time series of sea level pressure in hPa, x-axis is longitude. The dots mark six-hourly steps, which is the resolution of ERA-Interim, but COSMO-CLM tracks have been drawn hourly. All tracks were limited to the parts that lie entirely inside the COSMO-CLM domain. (a) Daria, 25 January 1990, (b) Verena, 14 January 1993, (c) Lothar, 26 December 1999 and (d) Kyrill, 18 January 2007.
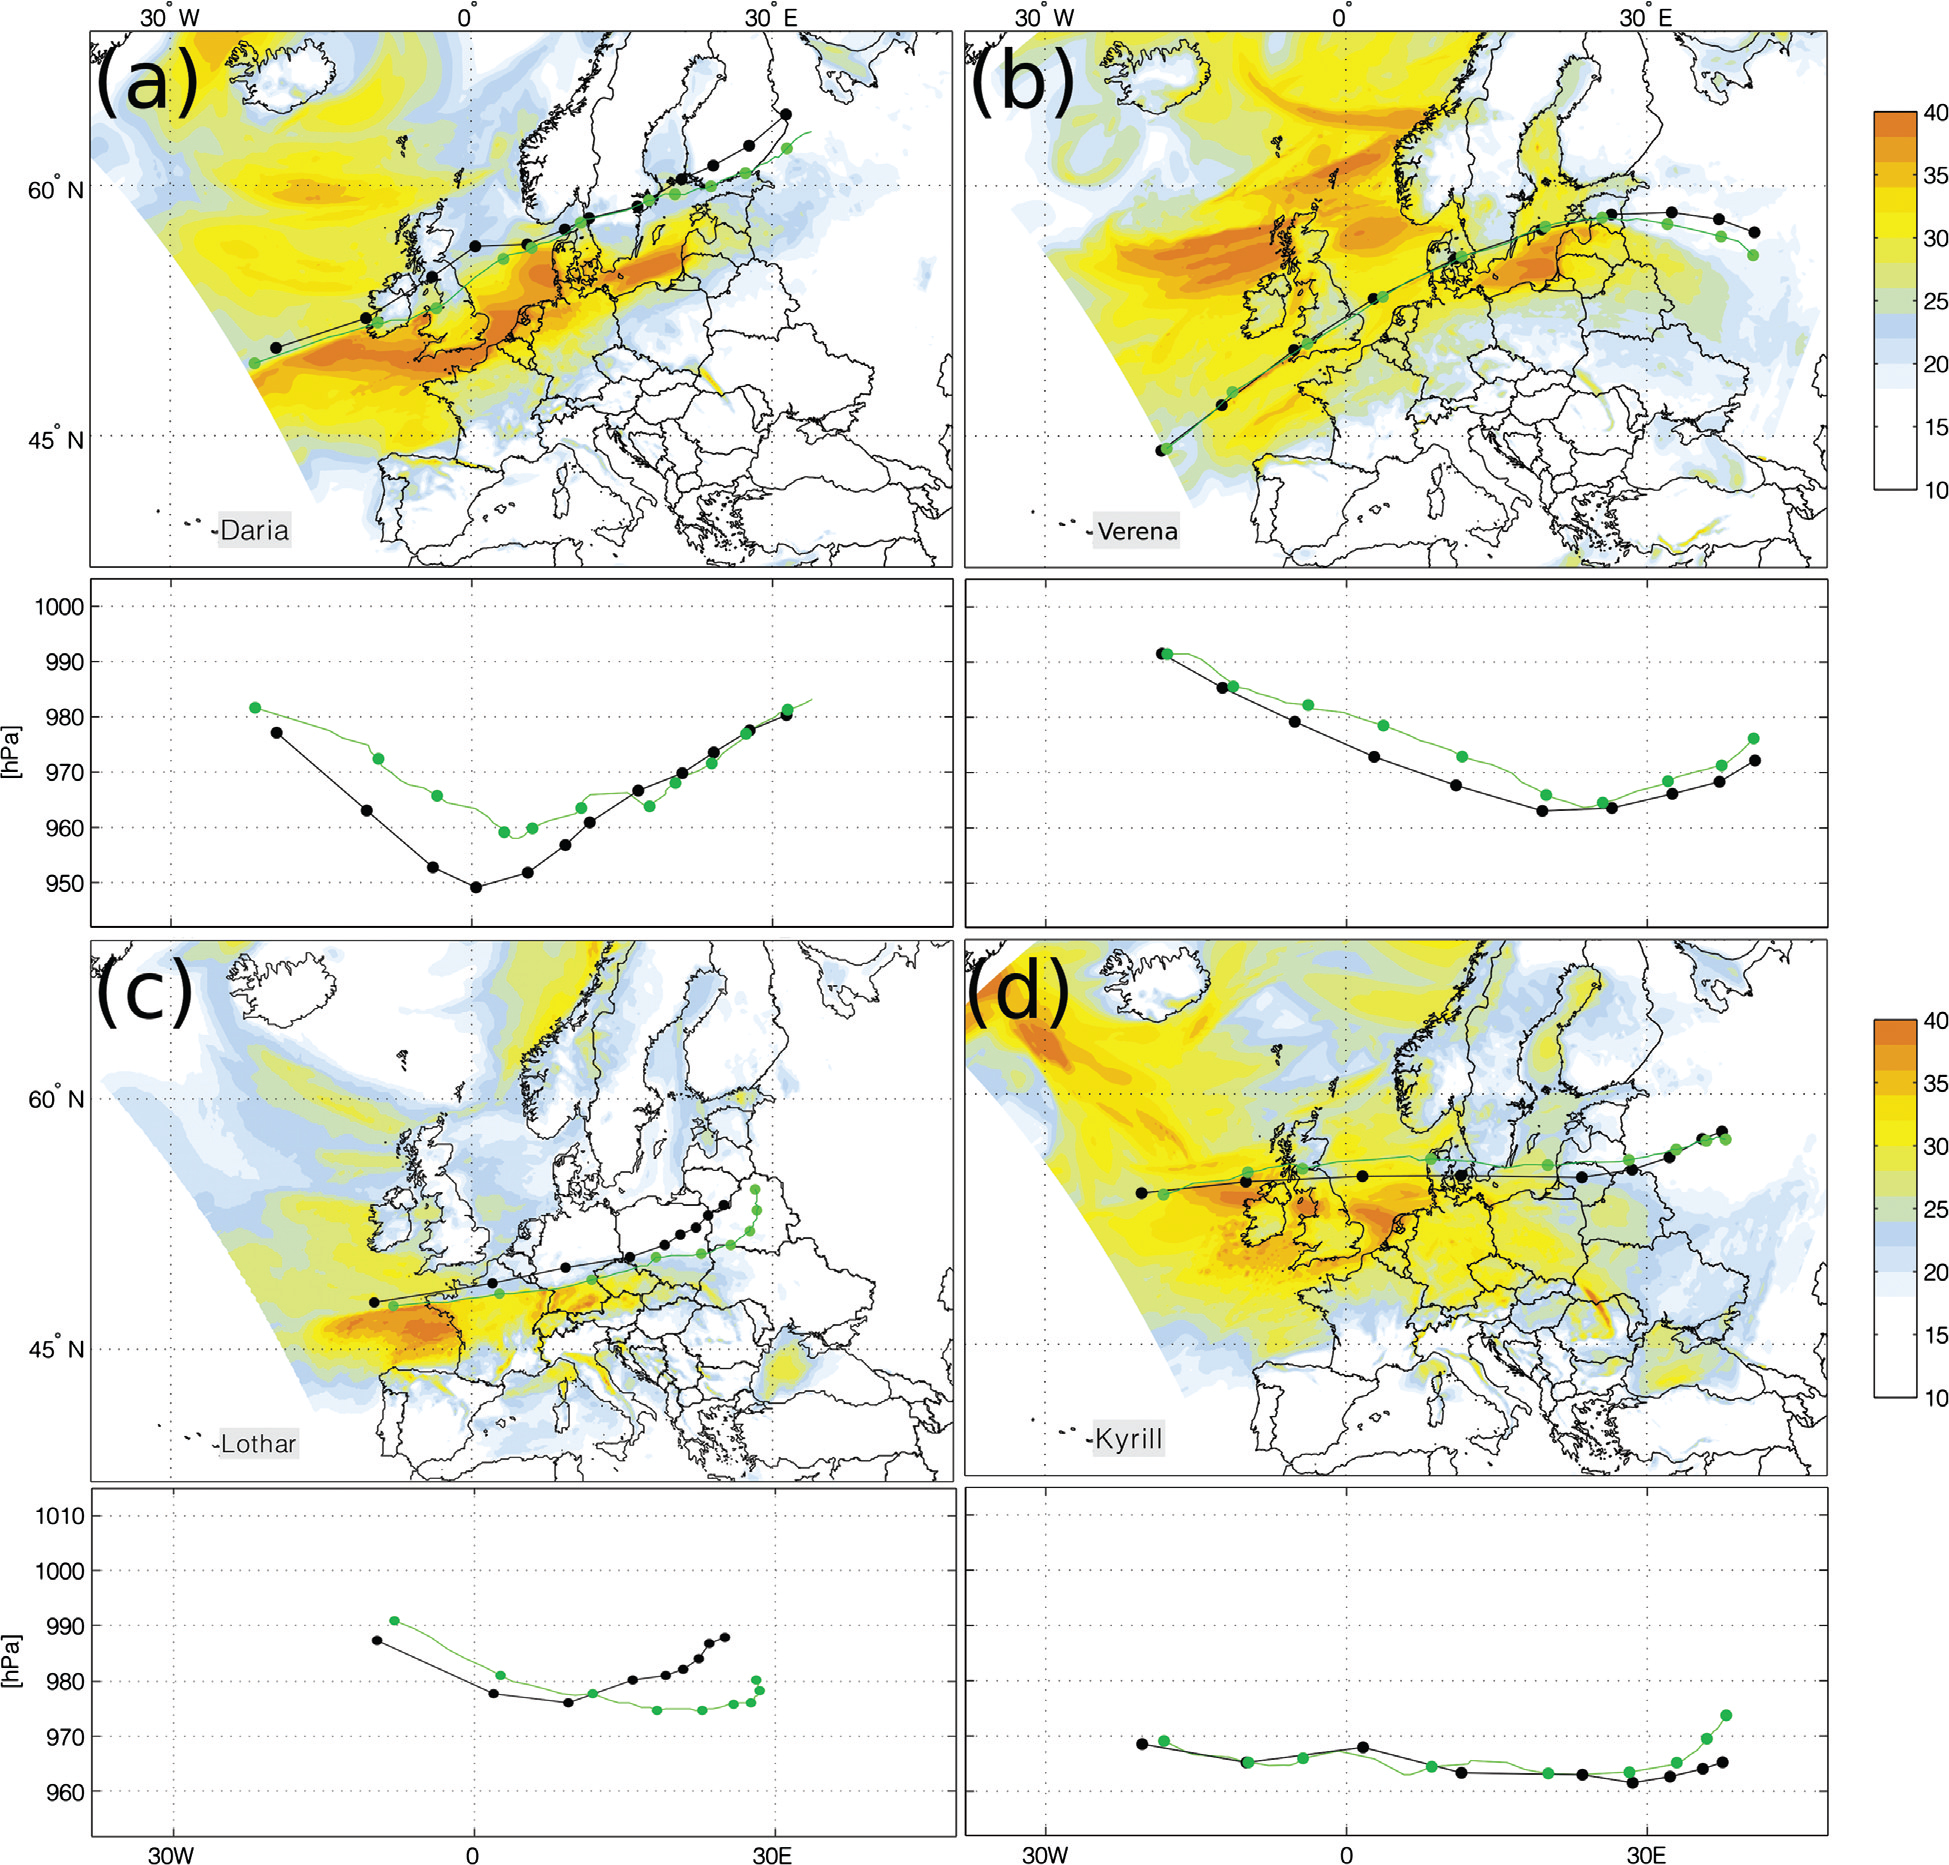
Table 2. Key features of the tracks of the strongest 10 storms (see text) simulated with CCLM

Storm CCLM ERA-Interim Date Lat (°N) Lon (°E) Pmin (hPa) Date Lat (°N) Lon (°E) Pmin (hPa) Daria 25 January 1990 21UTC 56.43°N 4.63°E 958.02 25 January 1990 18UTC 56.82°N 0.42°E 949.13 Vivian 27 February 1990 12UTC 61.72°N 19.09°E 938.86 27 February 1990 12UTC 60.67°N 21.14°E 941.04 Wiebke 1 March 1990 03UTC 52.46°N 11.28°E 976.01 1 March 1990 06UTC 52.26°N 18.95°E 971.8 Verena 14 January 1993 10UTC 58.31°N 23.67°E 973.68 14 January 1993 06UTC 57.76°N 19.53°E 973.07 Barbara 24 January 1993 05UTC 59.97°N 3.00°E 965.43 24 January 1993 00UTC 59.17°N 3.74°W 966.8 Anatol 4 December 1999 00UTC 57.43°N 18.06°E 958.15 3 December 1999 18UTC 56.96°N 9.67°E 956.42 Lothar 27 December 1999 00UTC 51.39°N 22.82°E 974.75 26 December 1999 12UTC 50.46°N 9.37°E 976.09 Jeanett 27 October 2002 14UTC 56.32°N 7.06°E 977.86 27 October 2002 12UTC 56.44°N 4.05°E 975.32 Kyrill 19 January 2007 02UTC 56.47°N 24.01°E 962.97 19 January 2007 06UTC 56.00°N 28.54°E 961.51 Emma 29 February 2008 21UTC 62.72°N 1.14°W 956.45 29 February 2008 18UTC 62.34°N 4.66°W 959.97

[i] Shown is the date and time, at which the minimum sea level pressure P min occurred, the geographical position and the minimum pressure value. The storms are in chronological order.

Fig. 6. 

Patterns of WGE for storm Anatol (a) WGE Brasseur, (b) WGE DWD and (c) WGE TKE. For further details, see text.
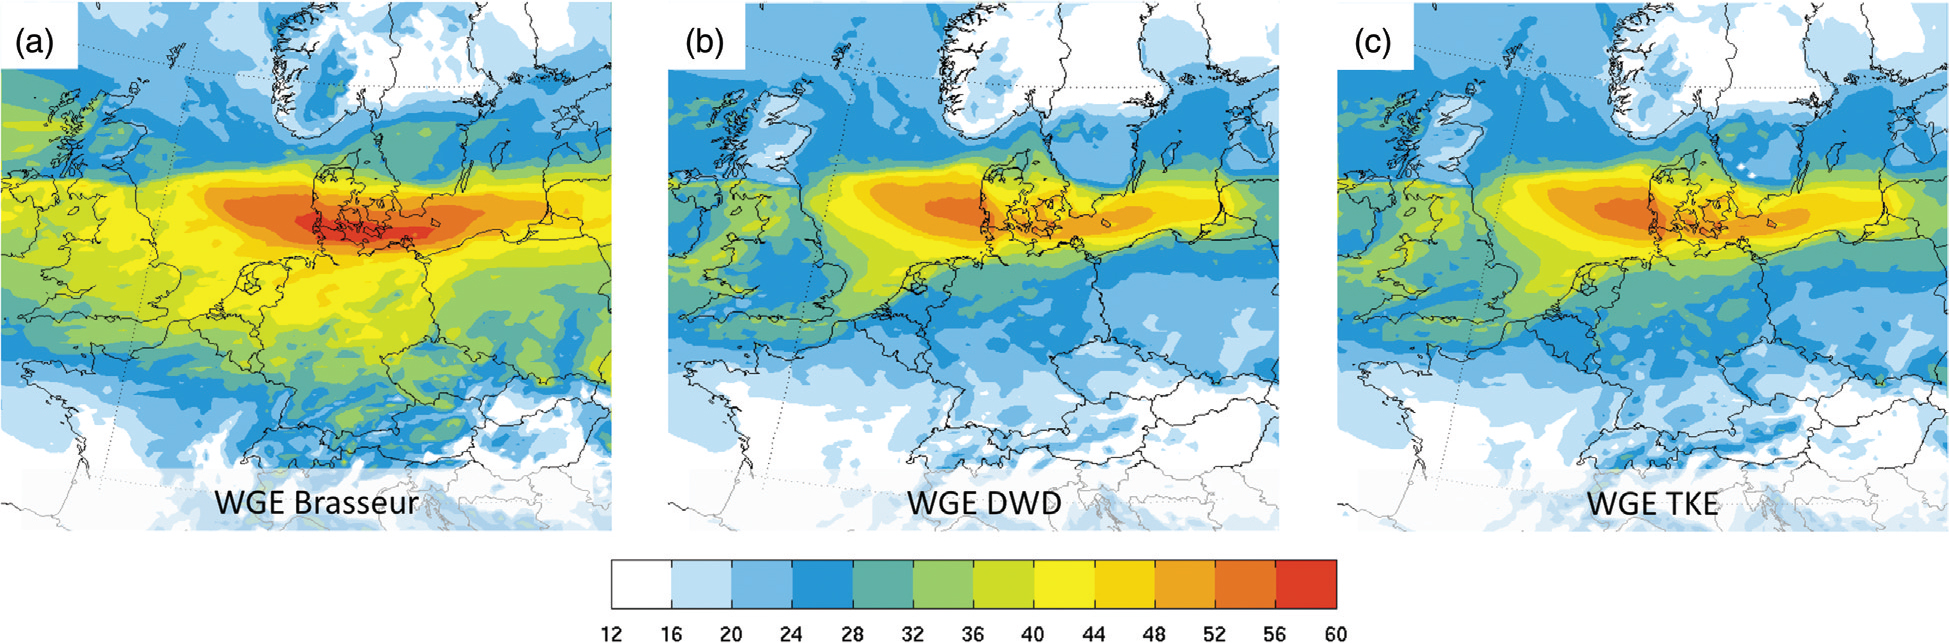
Fig. 7. 

Wind speed of gusts and 10 m winds at all available observational sites for three exemplary storms, Anatol (3 December 1999), Lothar (26 December 1999) and Jeanett (27 October 2002). The standard WGE methods after Brasseur (2001) (WGE Brasseur) and Schulz and Heise (2003) (WGE DWD) are compared with the TKE-based probabilistic estimation (box and whiskers for 5, 25, 50, 75 and 95% quantiles, respectively). The difference between 5 and 95% quantiles mark the range in which 90% of gusts are expected to occur. The latter are slightly shifted for easier comparison. For more details on each station, see Table 1.
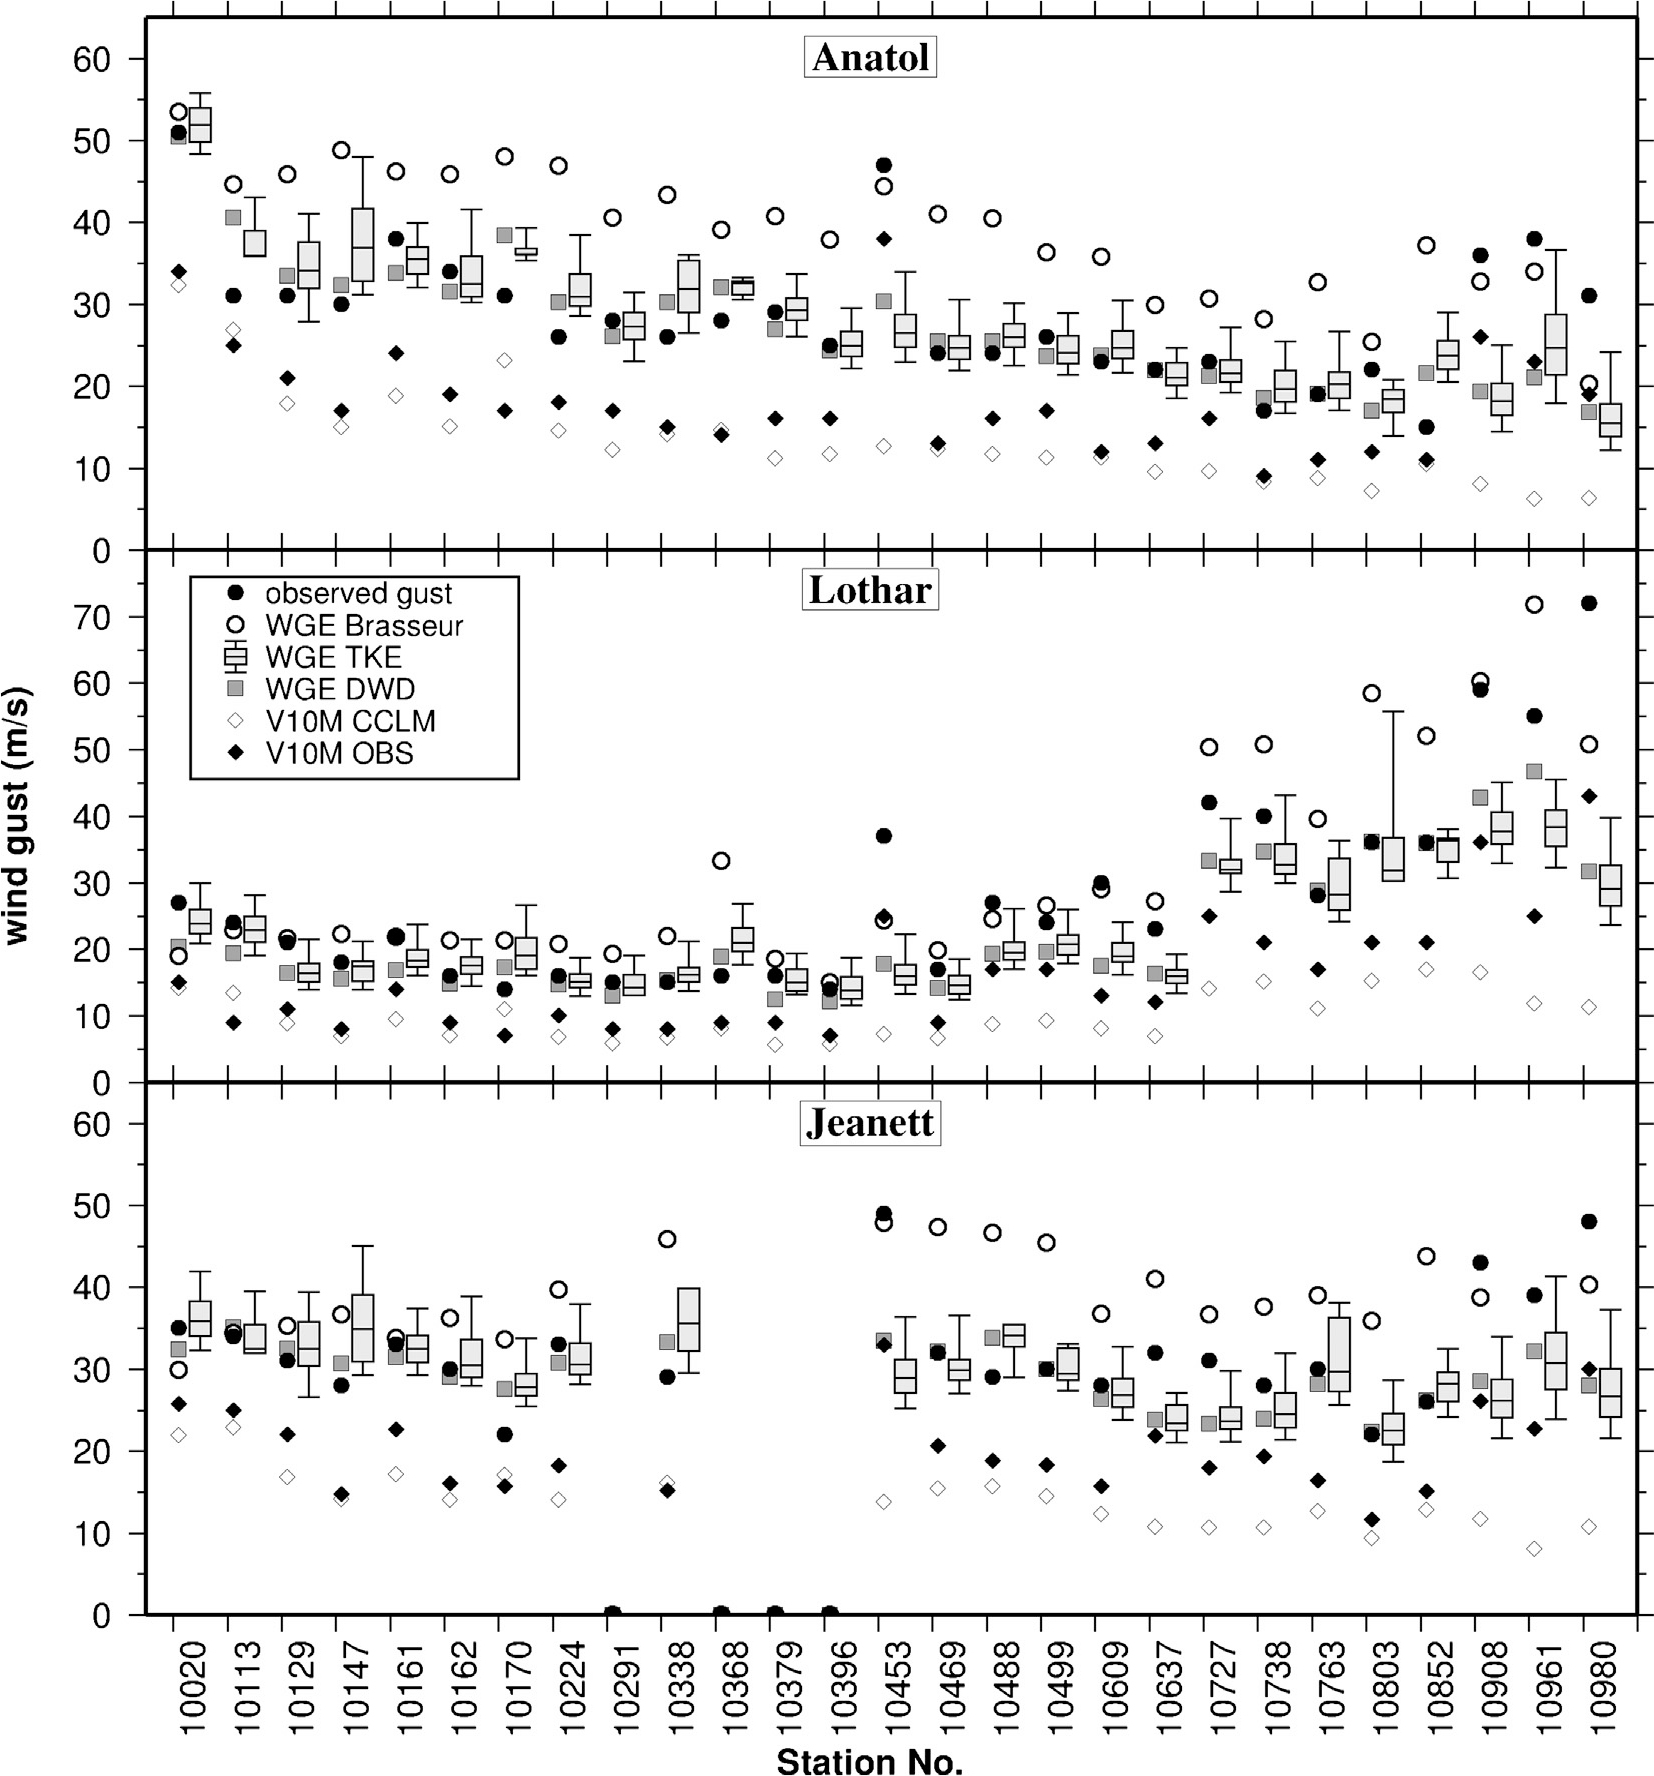
Fig. 8. 

Skill scores for the quality of the statistical distributions of gusts (QSS), the deviation of gust estimates from observations (RSS) and for temporal coincidence (CORR) at climate observation sites in Germany for WGE Brasseur (light grey), WGE TKE (dark grey) and WGE DWD (black). On the last row, an average over all stations per approach is given. For each station, the maximum number of considered storms is limited by availability of observations. M indicates a mountain station (height above 800 m a.s.l.). For more details on each station, see Table 1.
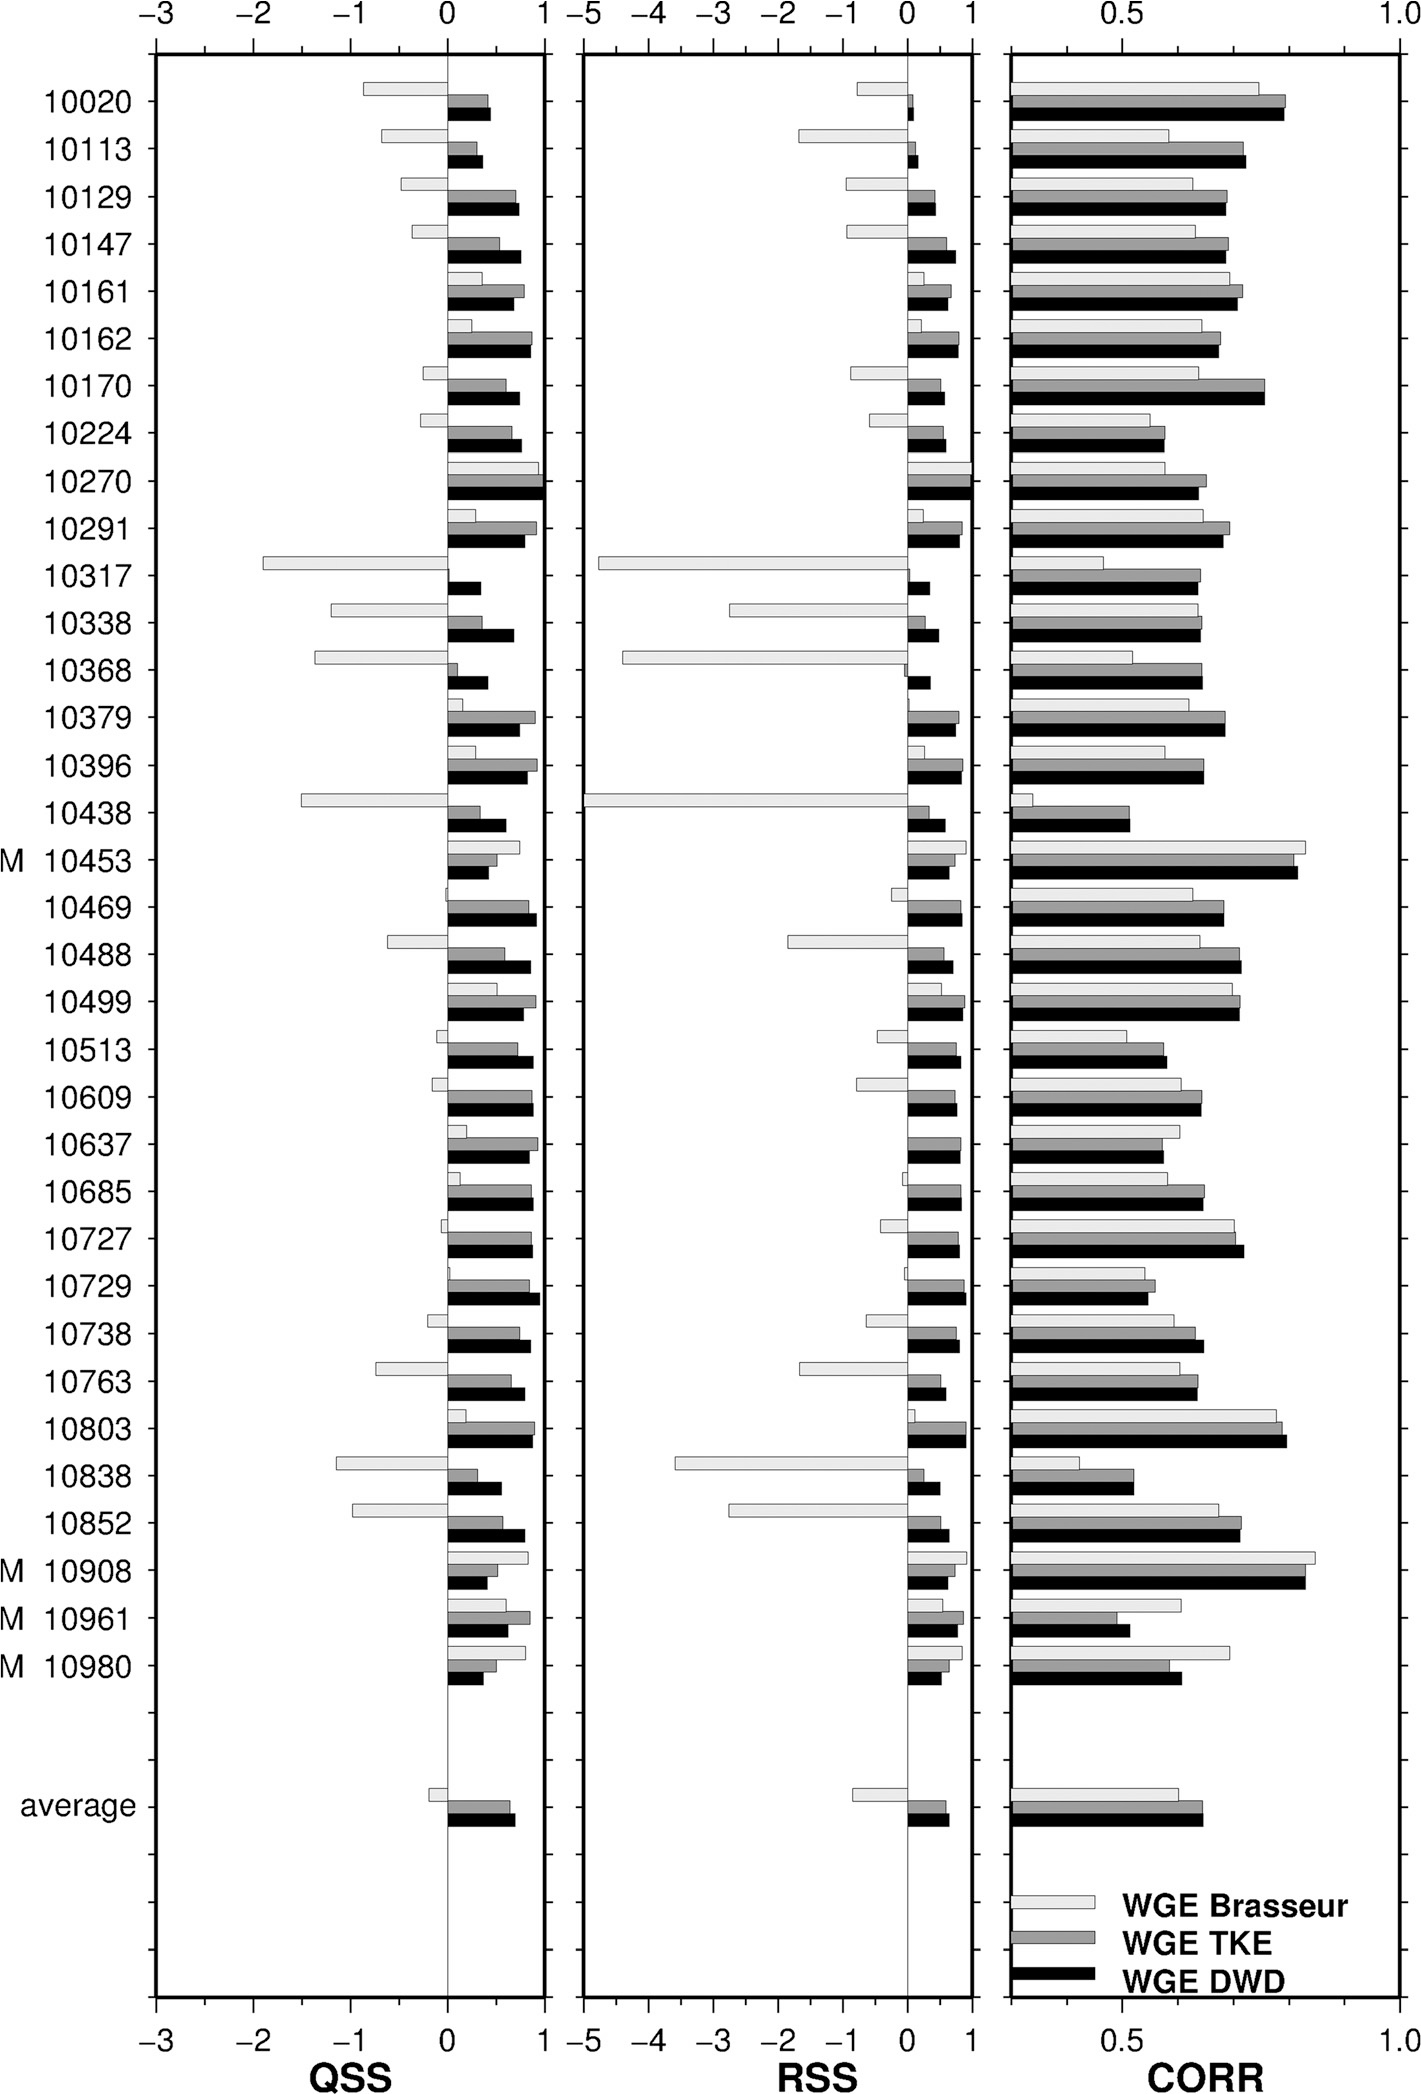
Table 3. Averaged skill scores for all stations and all events using investigated WGE methods

DWD TKE Brasseur QSS 0.69 0.63 −0.24 RSS 0.63 0.57 −0.96 CORR 0.65 0.65 0.60

[i] See text for details on skill scores and different WGE formulations.

Language: English
Page range: 17471 - 17471
Submitted on: May 25, 2011
Accepted on: Jan 9, 2012
Published on: Dec 1, 2012
Published by: Stockholm University Press
In partnership with: Paradigm Publishing Services

© 2012 Kai Born, Patrick Ludwig, Joaquim G. Pinto, published by Stockholm University Press
This work is licensed under the Creative Commons Attribution 4.0 License.