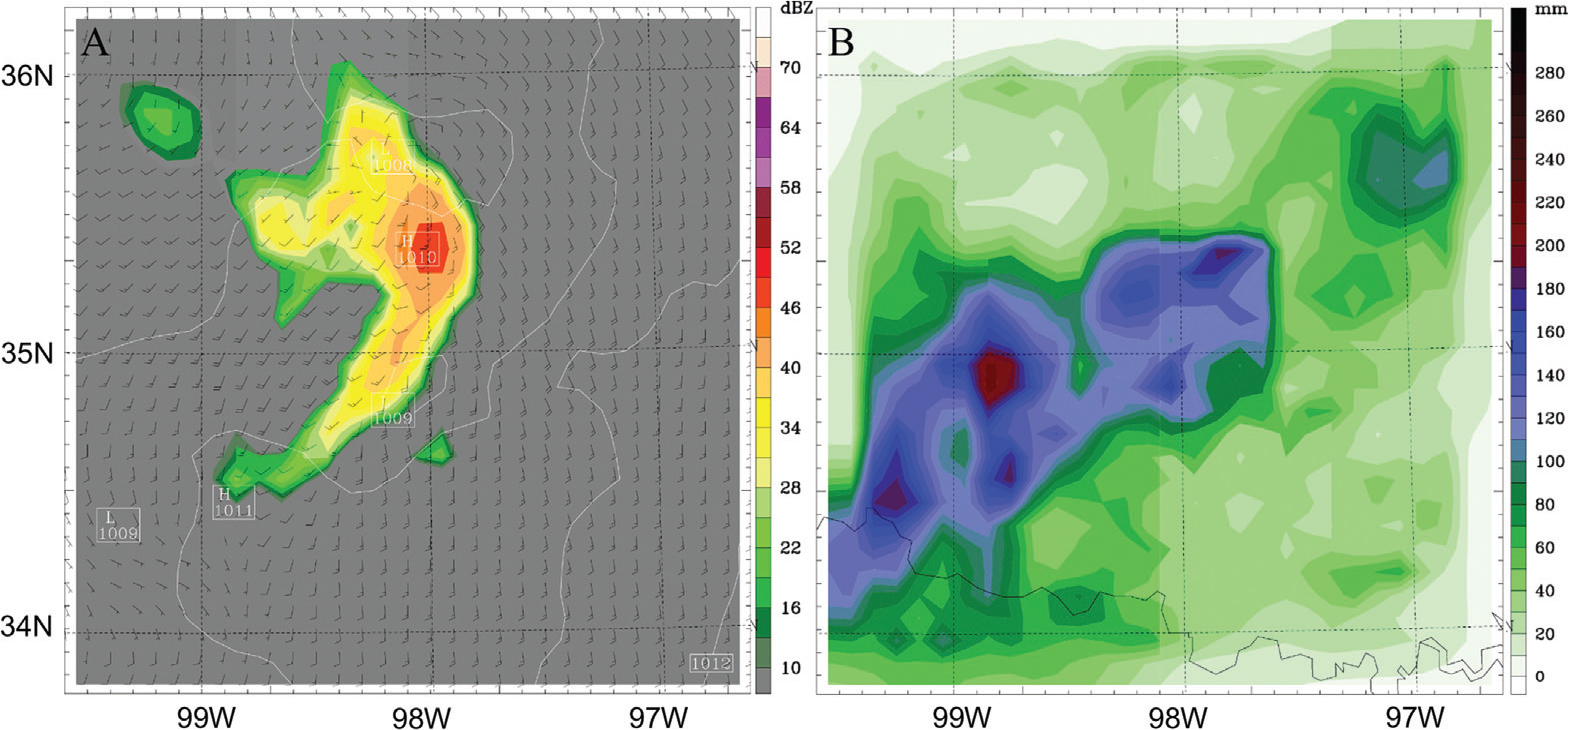
Fig. 1.
Radar reflectivity (dBZ) of the ‘eye’ of TS Erin 19 August 2007, 12:31 UTC. The squares indicate model domains 2 and 3. Source: wunderground.com.
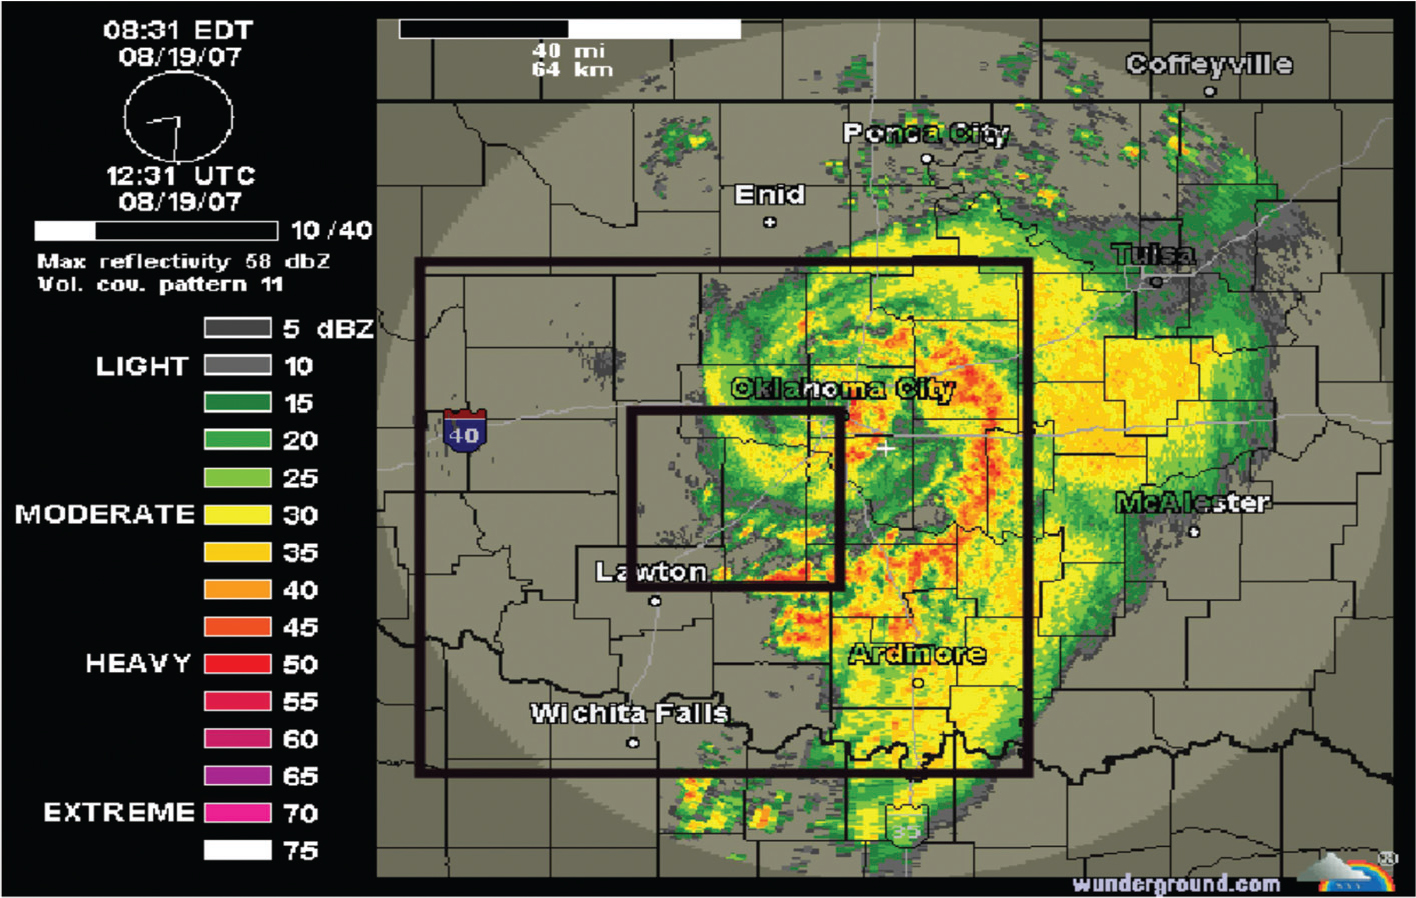
Table 1. Experimental set-up of experiment 1
Fig. 2.
Cumulative precipitation of all the 8 runs from August 17th 00:00 UTC to August 20th 18:00 UTC 2007, domain 2.
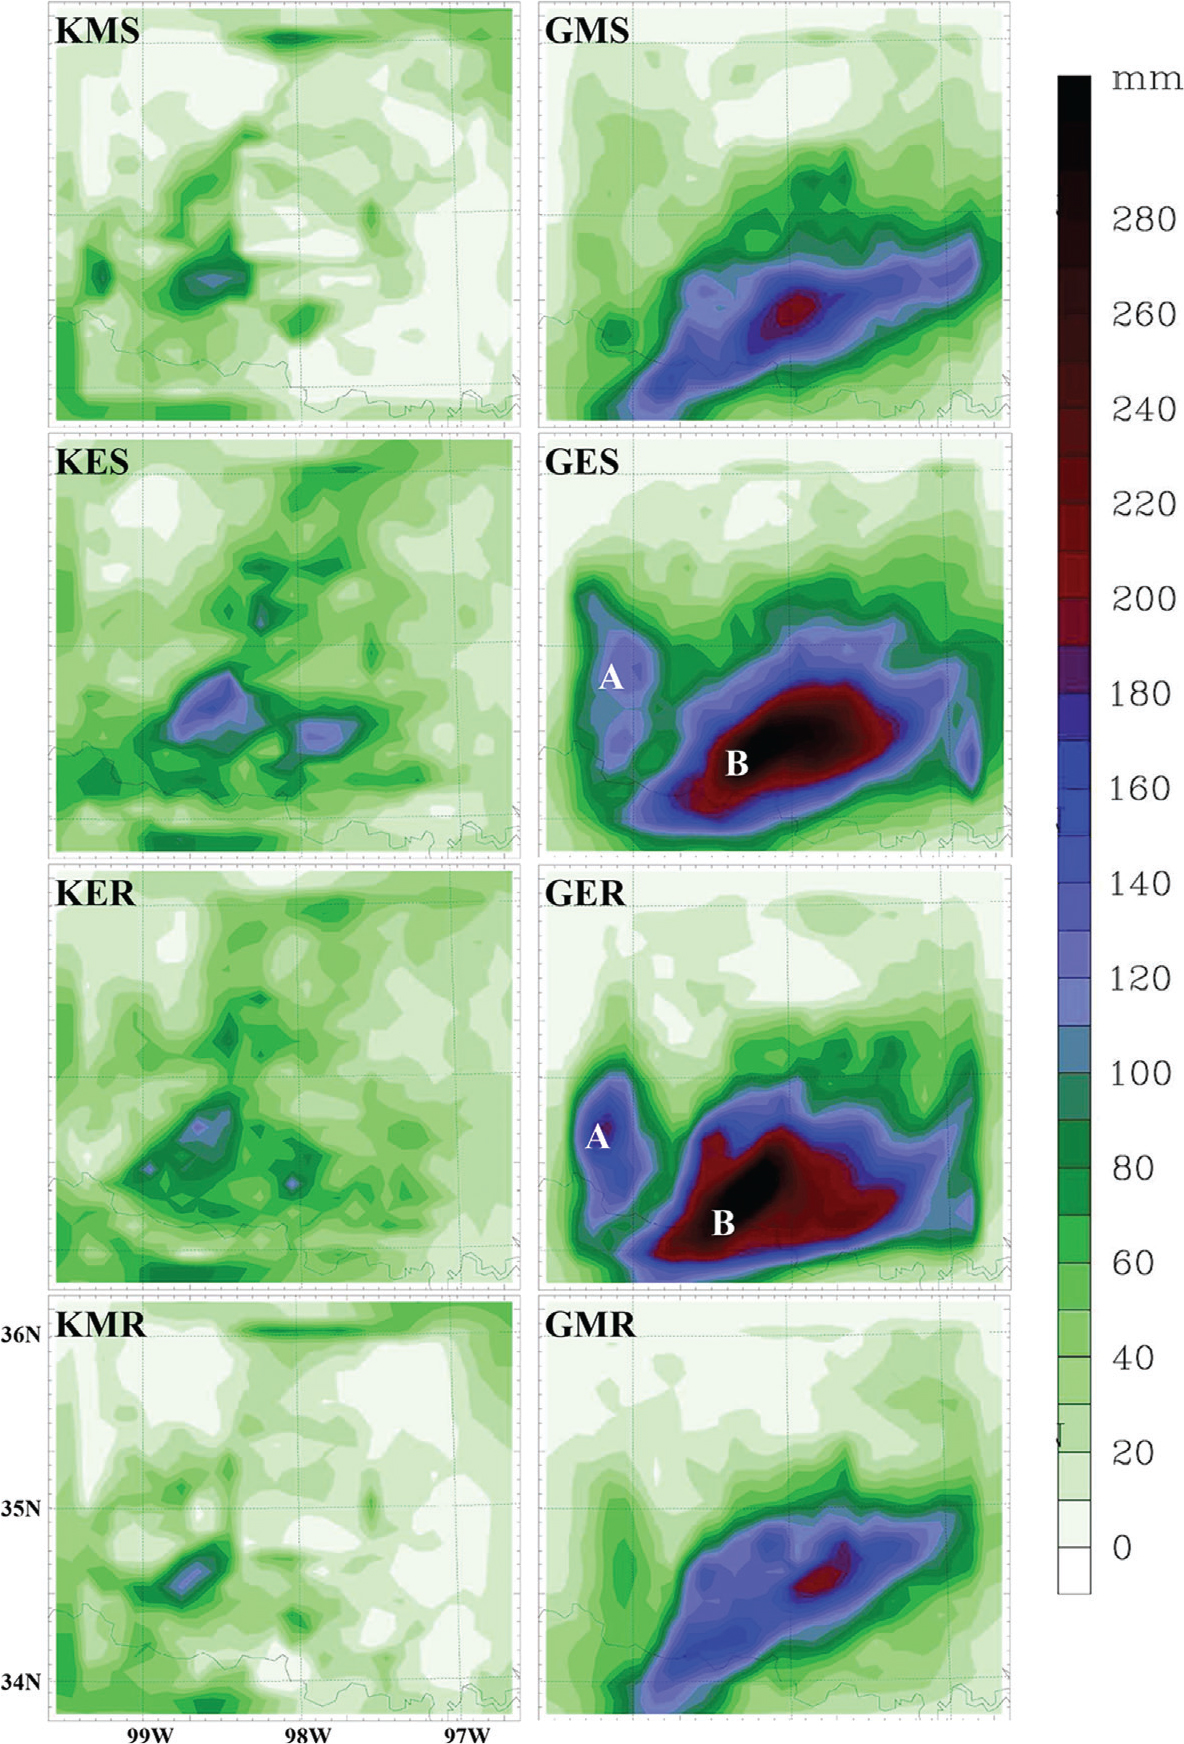
Fig. 3.
Observed precipitation (inches) from the Oklahoma Mesonet from August 18–19, 2007.
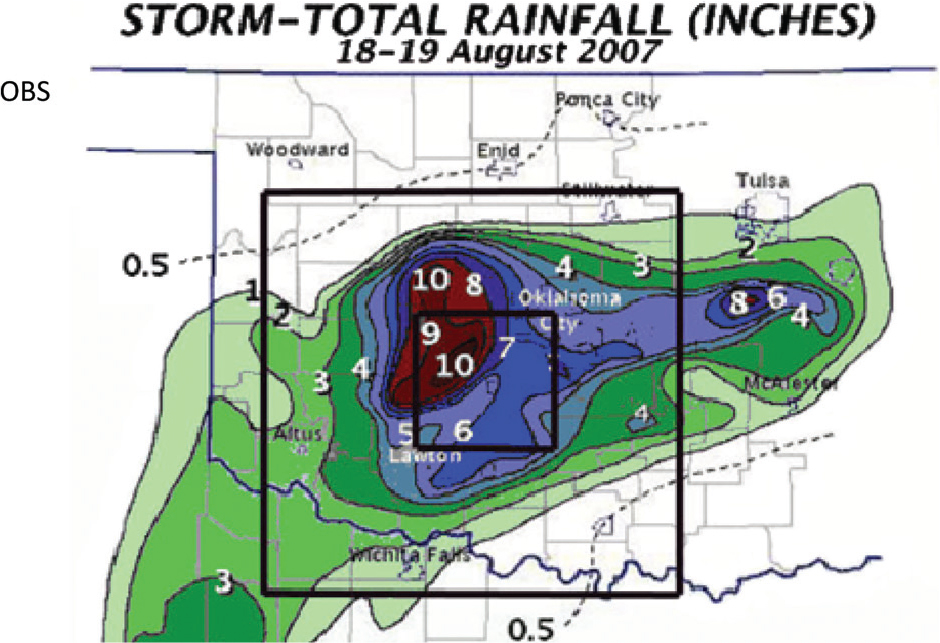
Fig. 4.
(A) Modelled and observed cumulative precipitation. The accumulation is performed over hourly maximum precipitation and (B) modelled and observed maximum wind speed. Both figures are in the period 18–19 August 2007, with time in UTC and from domain 2.
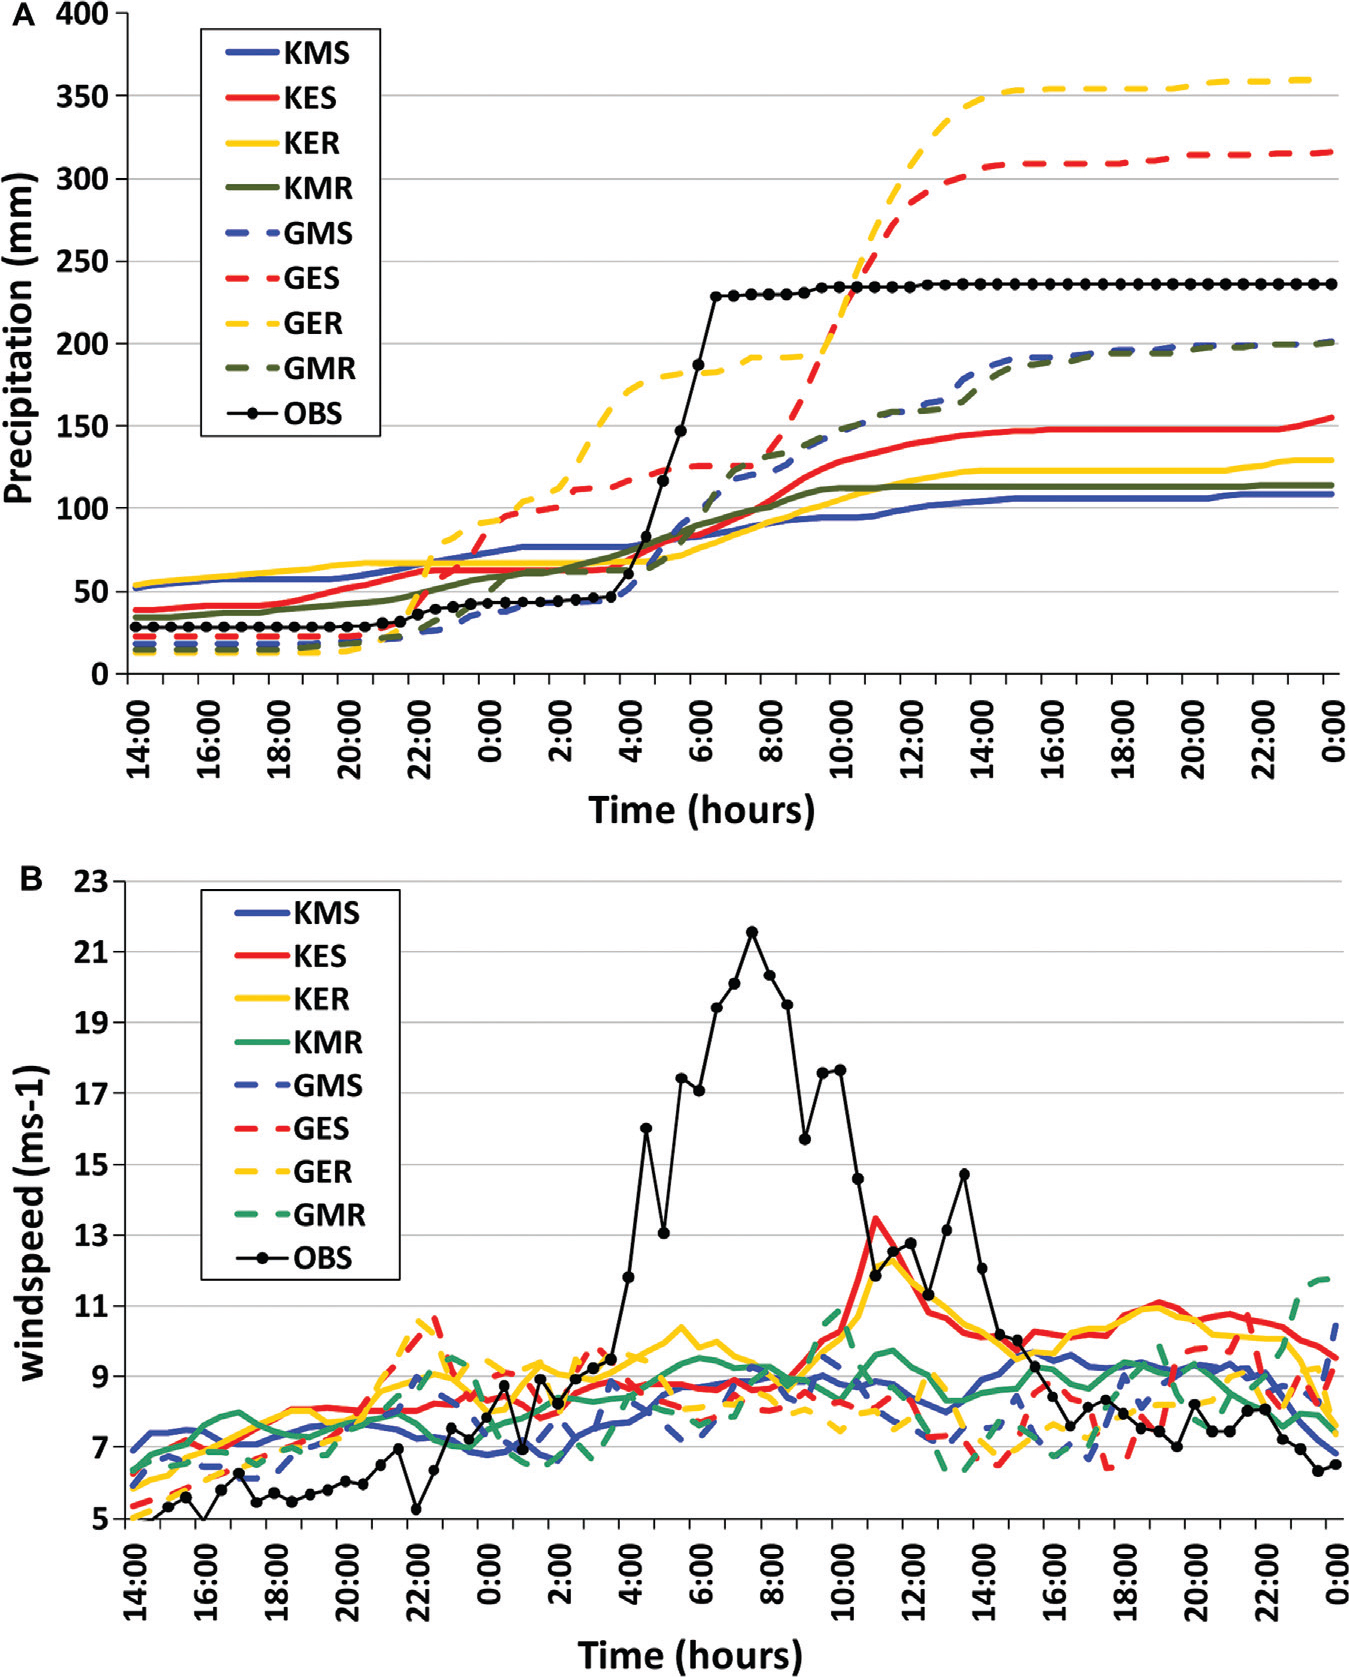
Fig. 5.
Simulated radar images and sea level pressure of (A) KER and (B) GER of domain 2 on 19 August 2007, 12:30 UTC.
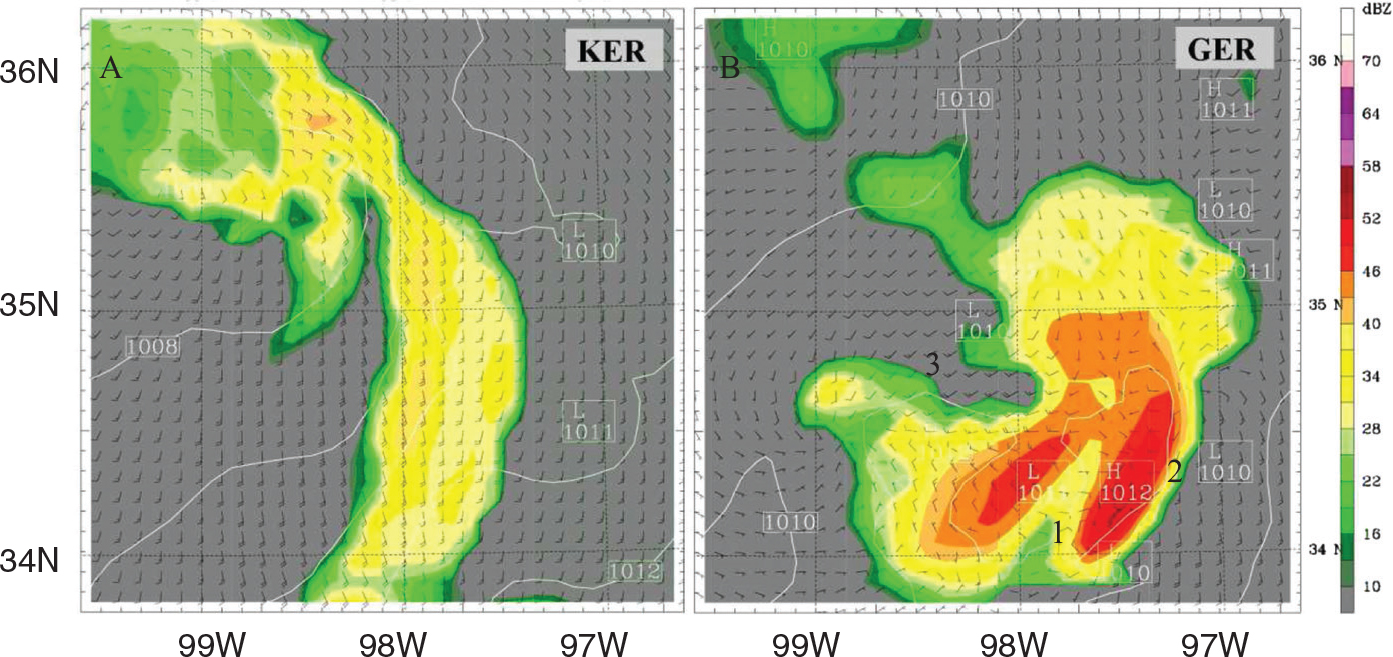
Fig. 6.
Modeled CAPE (A) and dew point temperature (B) at 2 meters for all eight runs. Figure B has same legend as A. Figure C and D show the LCL and LFC of respectively the runs with KF2 and the runs with Grell. Shown figures indicate August 18–19, 2007, with time in UTC.
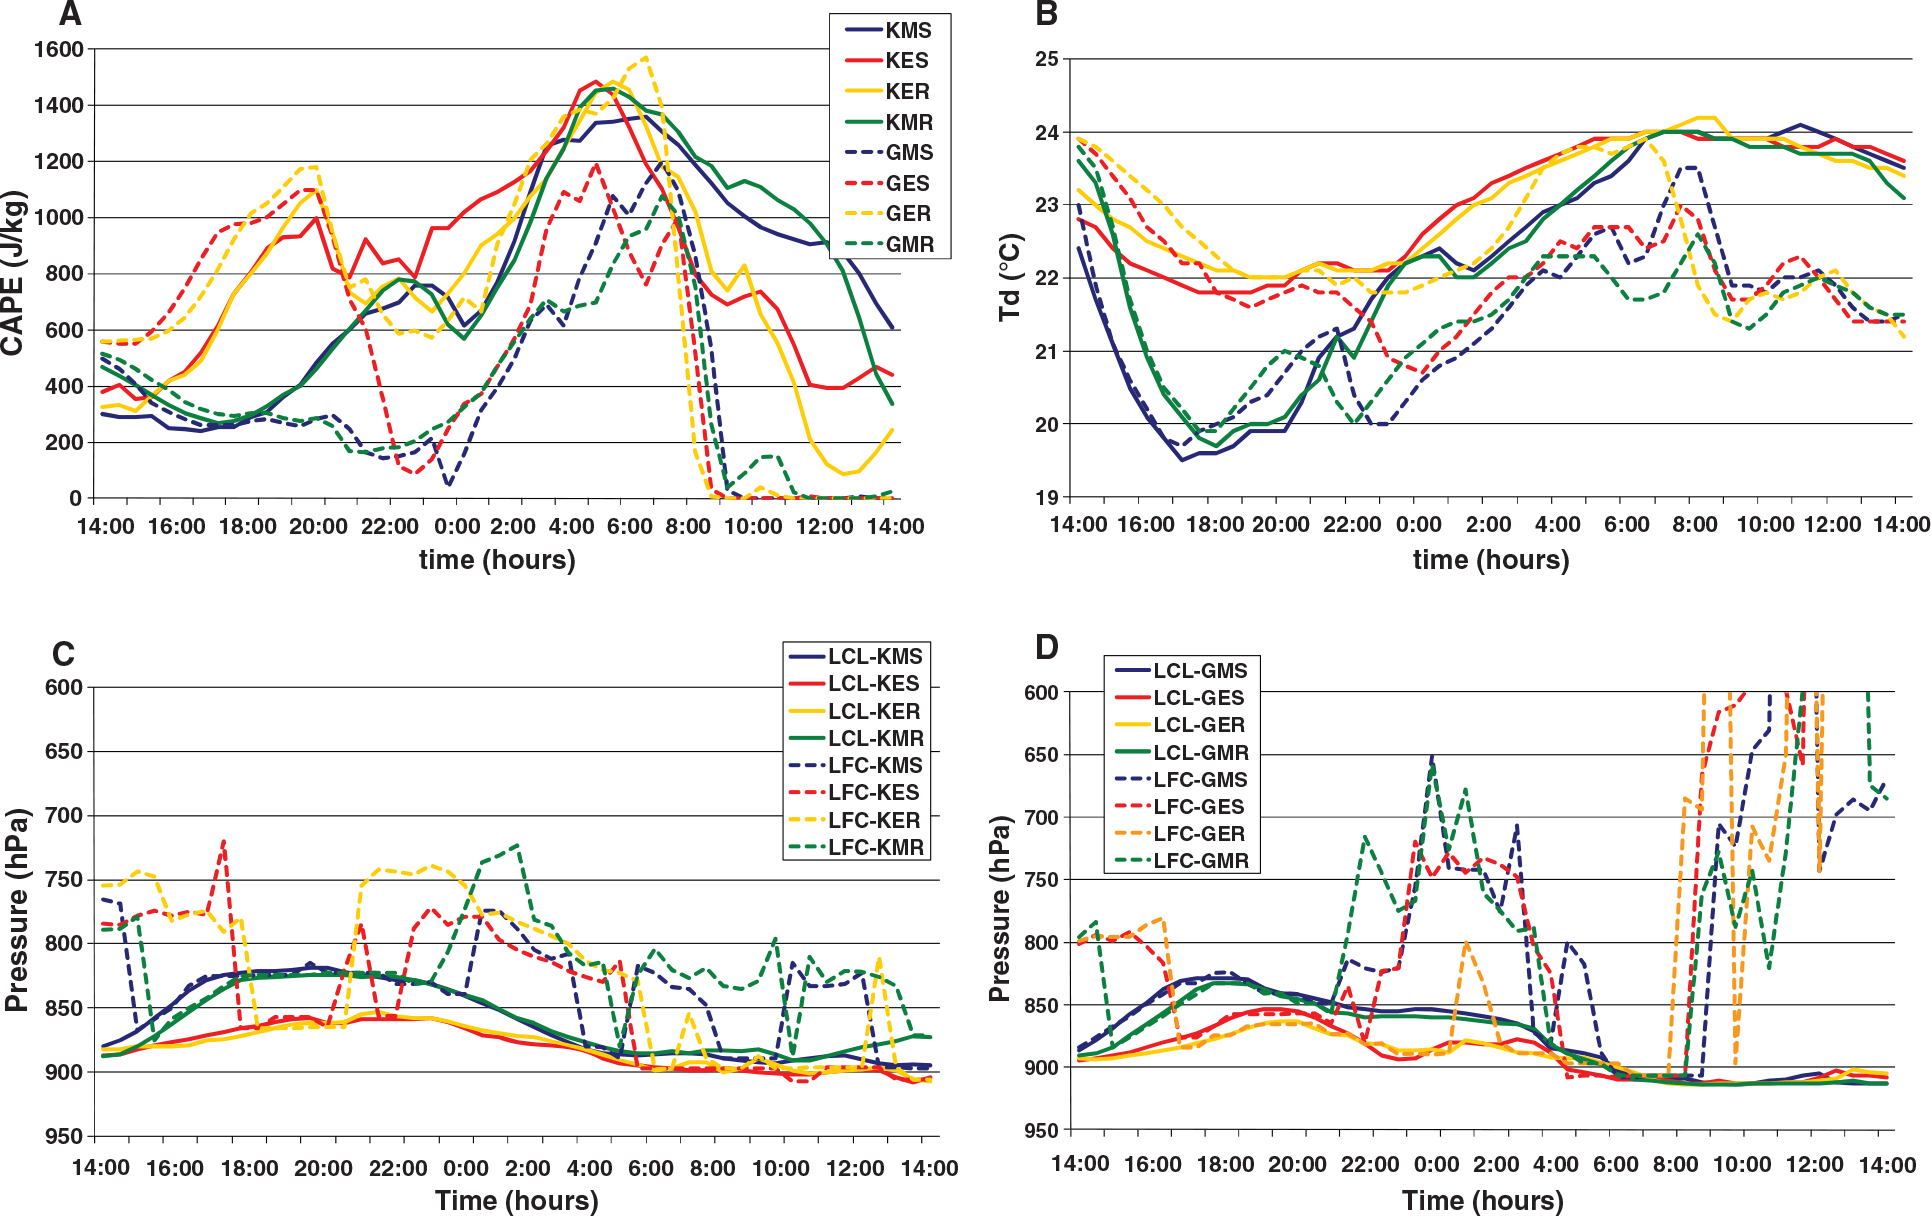
Fig. 10.
(A) Modelled updraft and downdraft maximum of KER (KF2) and KER1 (KF1) during the period 18–19 August 2007. (B) Modelled updraft and downdraft maximum of DDFORM and RHDSL during the period 18–19 August 2007. A simulation time of 48 hours corresponds to 19 August 2007, 00:00 UTC. Note the different range on the y-axis of panels A and B.
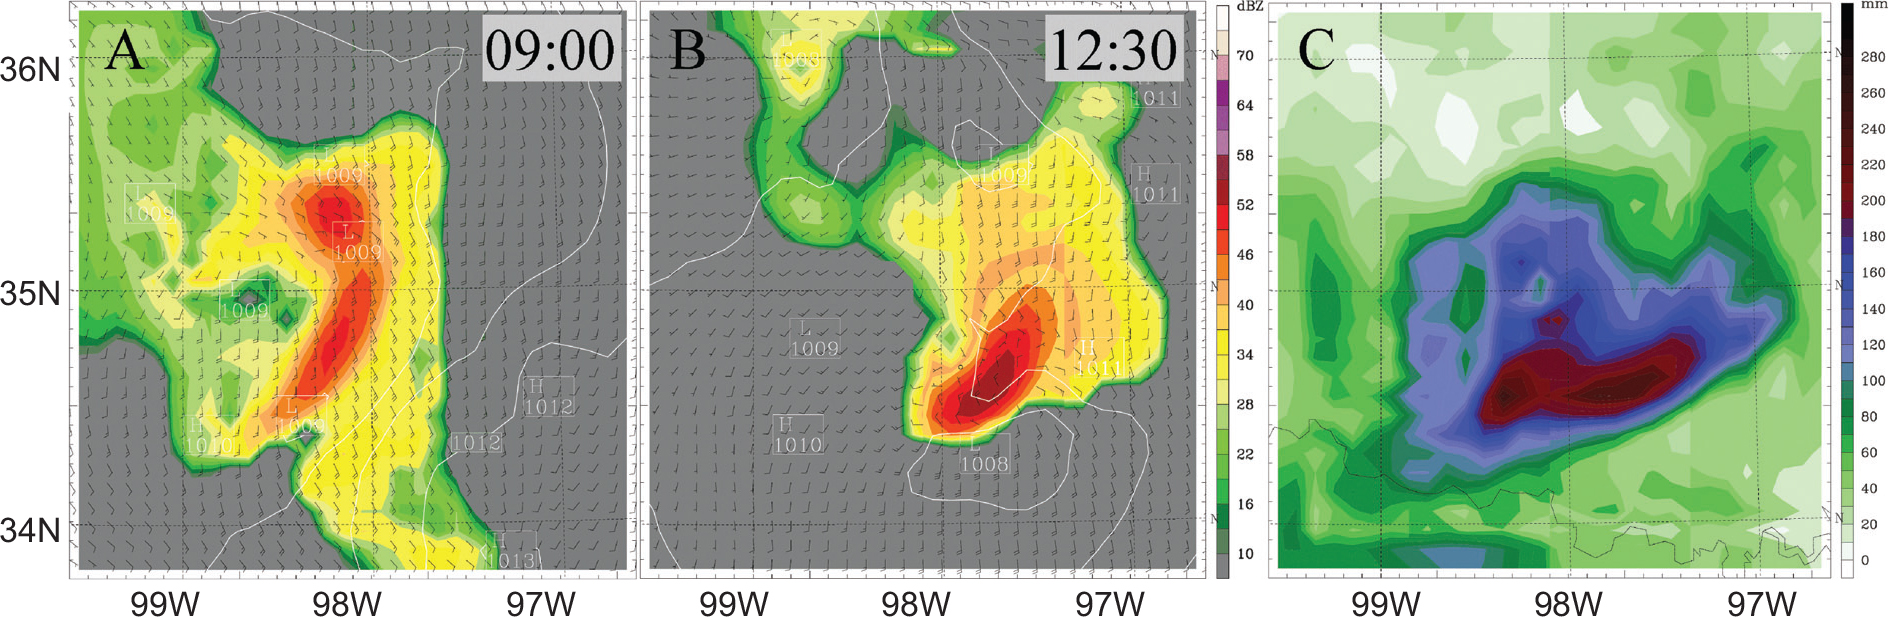
Fig. 7.
Modelled radar reflectivity for KF1-ETA-Reisner Graupel on 19 August 2007, 09:00 UTC (A) and 12:30 UTC (B) and cumulative precipitation (C) from the complete simulation time, all from domain 2.
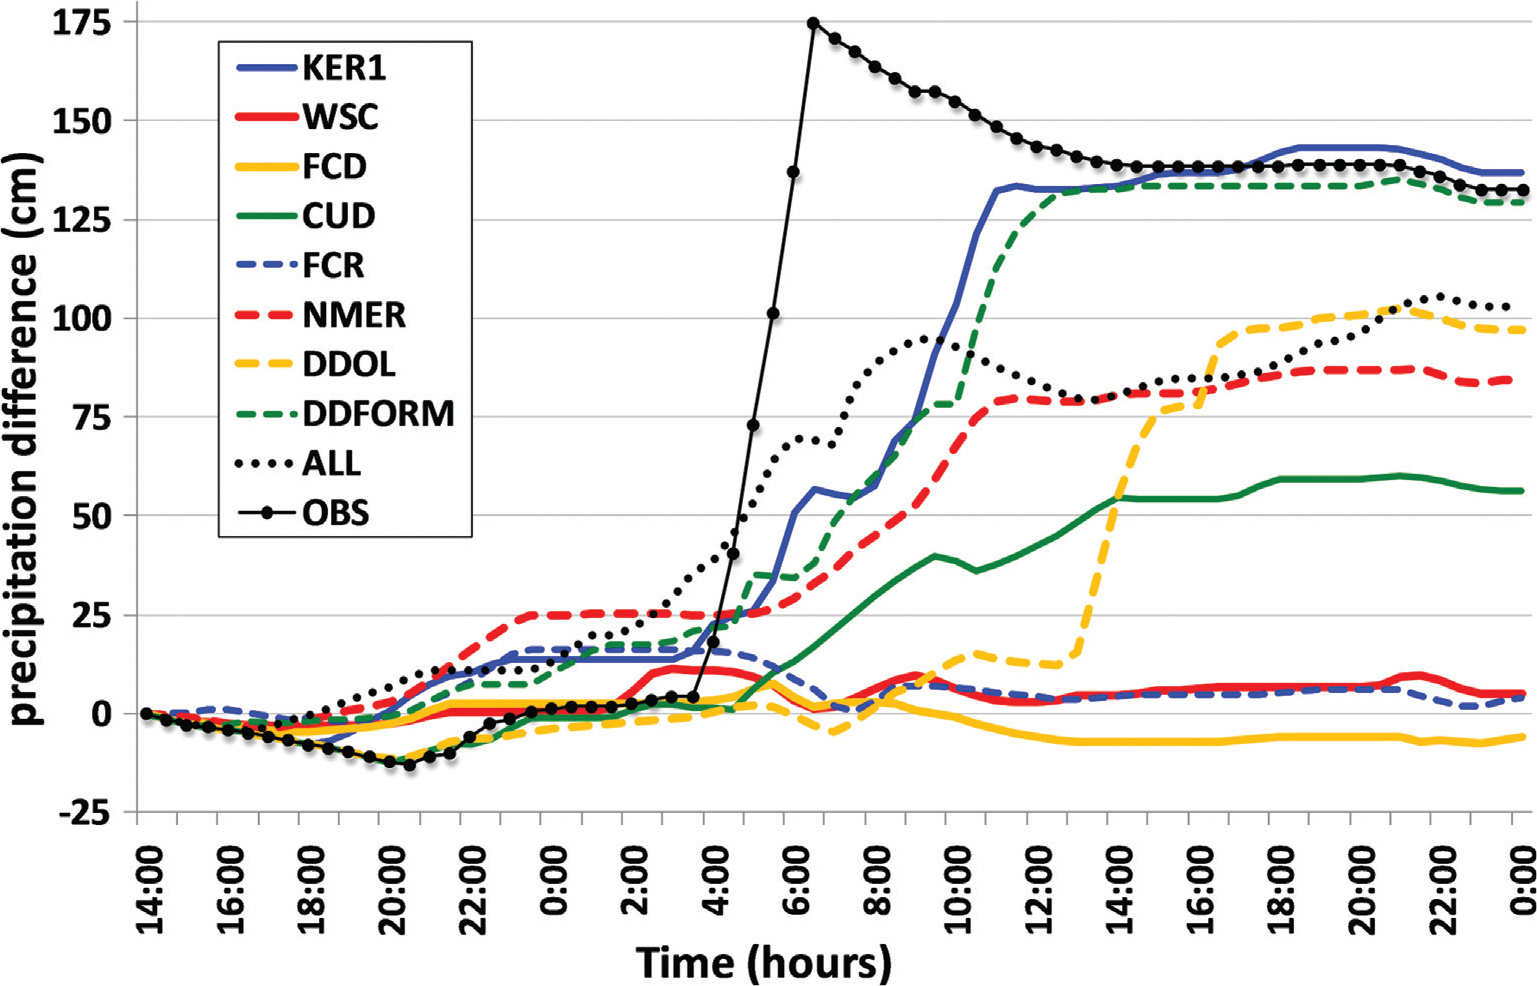
Fig. 8.
Modelled cumulative precipitation for runs 9–17 (Table 2) with the reference run (run 3 – KER) subtracted, from 18 August 2007, 14:00 UTC till 19 August 2007, 24:00 UTC.
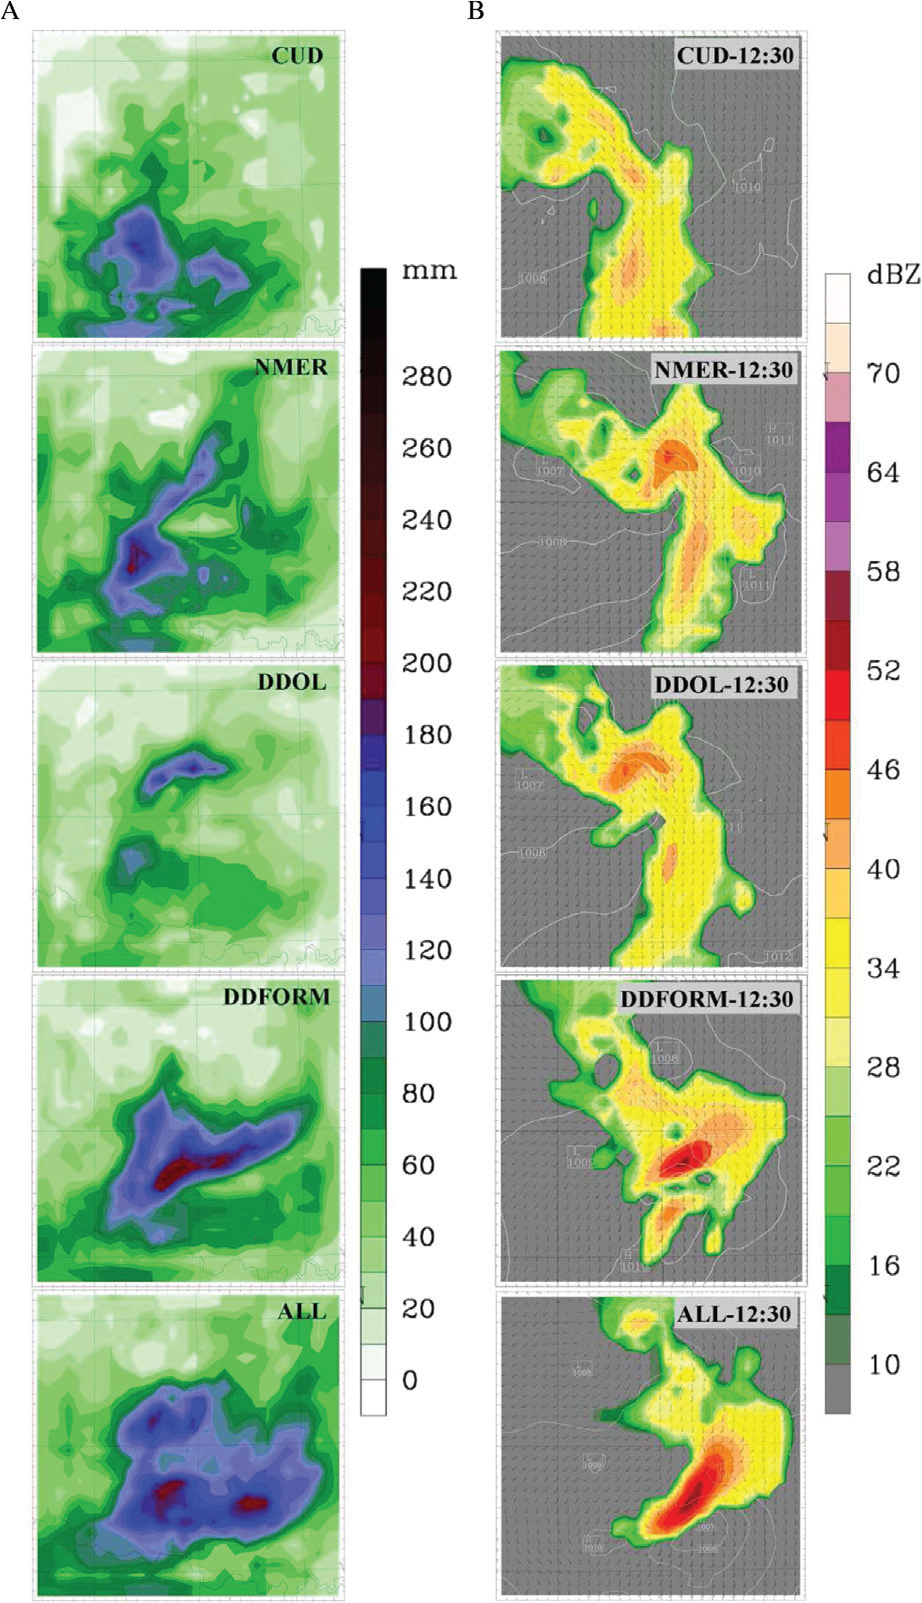
Fig. 9.
(A) Modelled cumulative precipitation of the complete simulation with different permutations for the convection scheme. (B) Simulated radar reflectivity on 19 August 2007, with time in UTC. Different permutations within the convection scheme are shown.
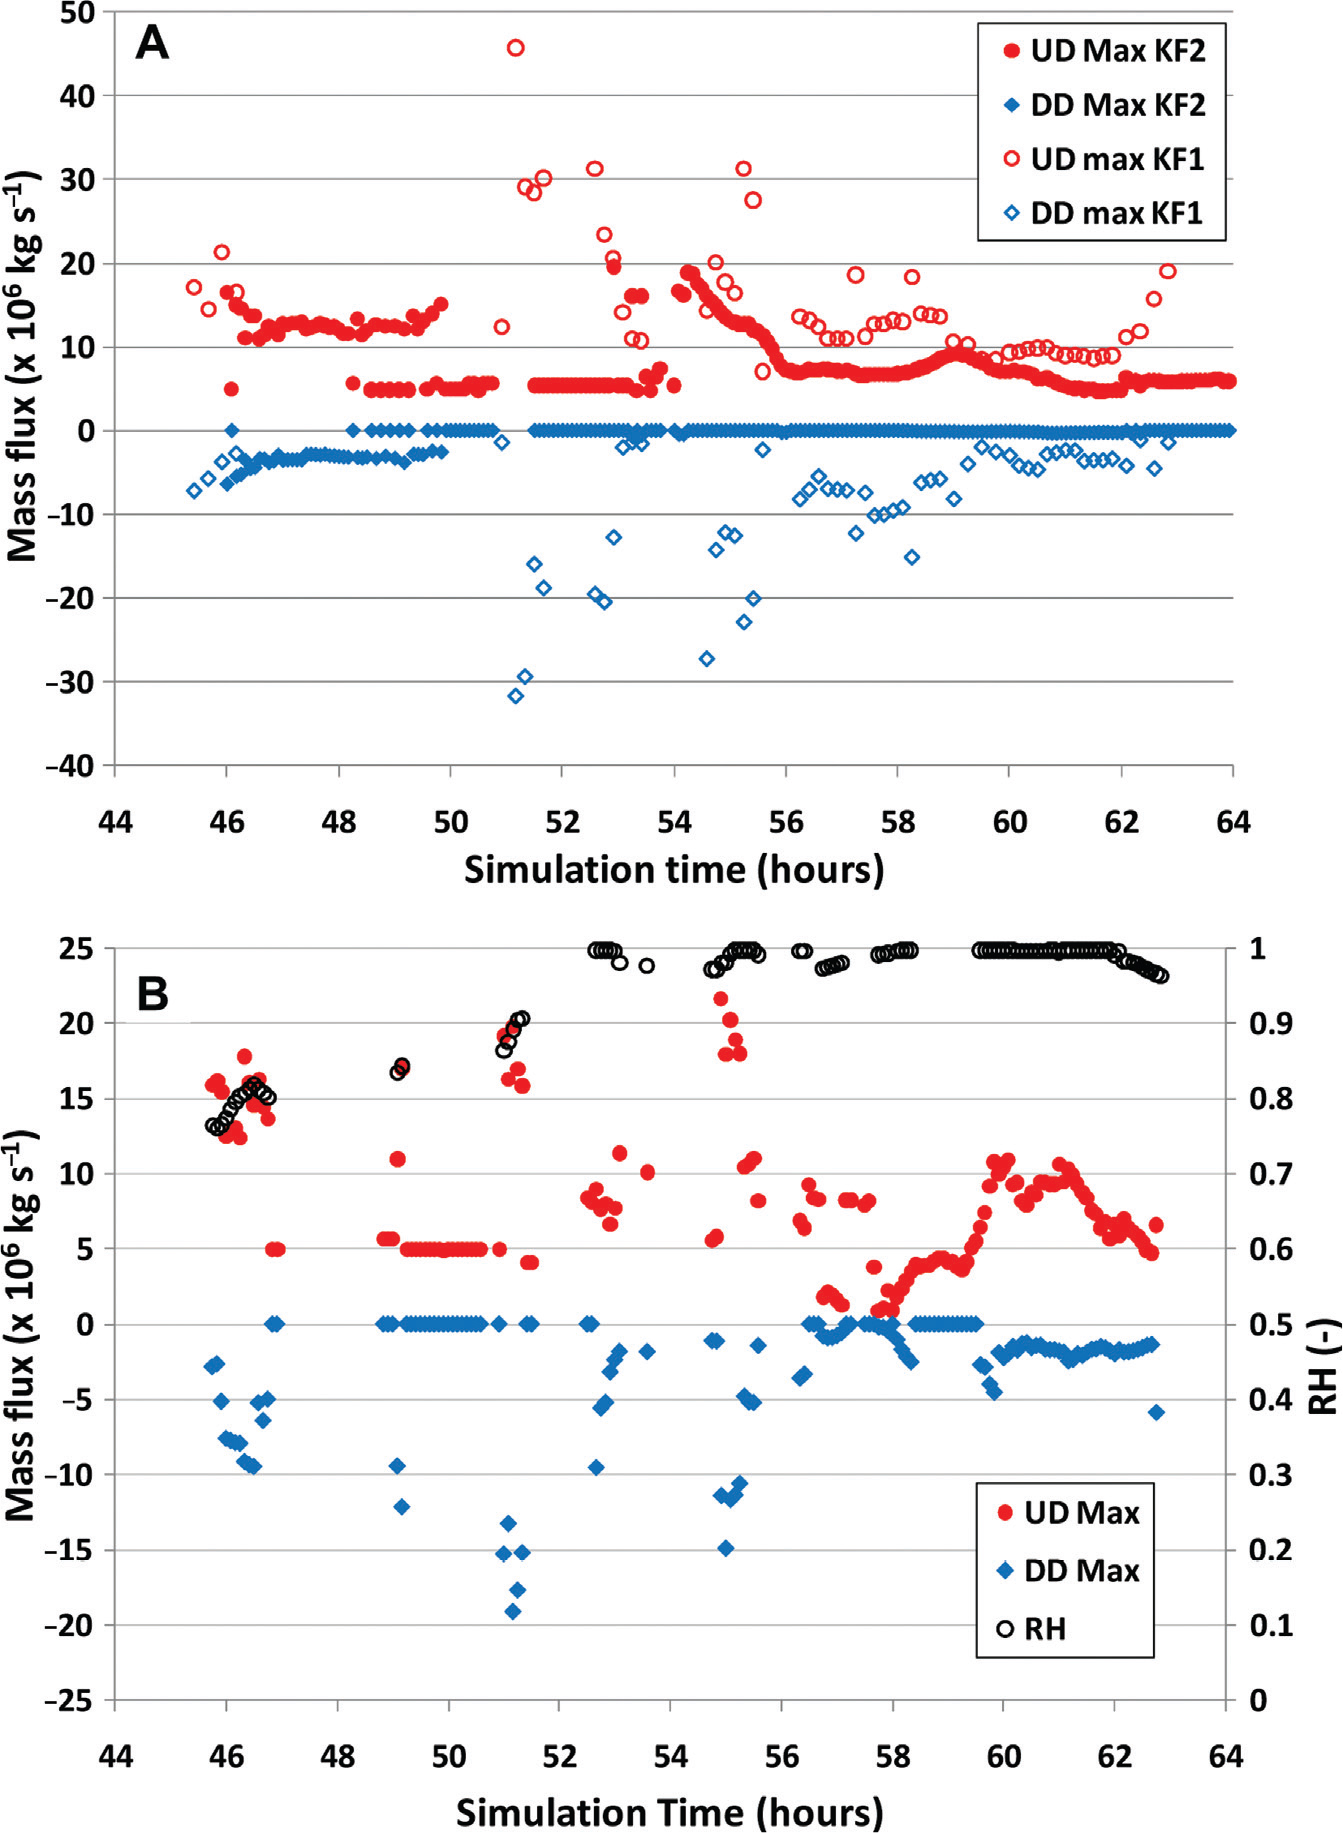
Table 2. Experimental set-up for experiment 2
Fig. 11.
Simulated radar reflectivity (A) on 19 August 2007, 13:00 UTC and total cumulative precipitation (B) from domain 2 of run 19 (Grell-DD).