Fig. 1.
Main processes affecting the DO regime that are taken into account in the FLakeEco model: (a) the case of open water; and (b) the case of ice-covered lake. Arrows mark the directions of DO fluxes in the model.
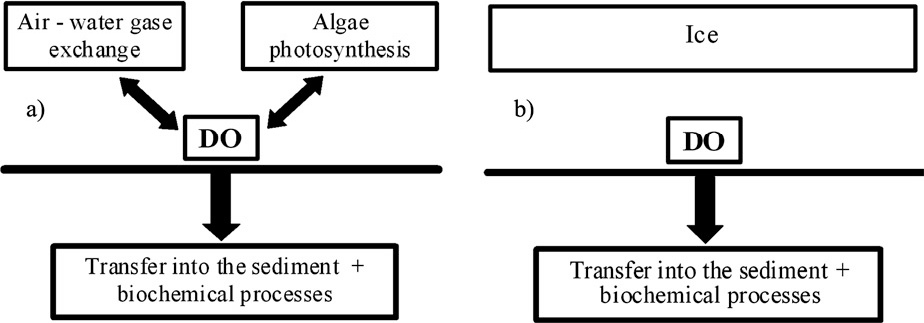
Fig. 2.
Temporal dynamics of air temperature over the lakes under study: (a) reanalysis data; (b) GLOWA Elbe scenario; and (c) the MPI B2 scenario. Solid black lines mark linear trends in air temperature correspondingly to the scenarios chosen.
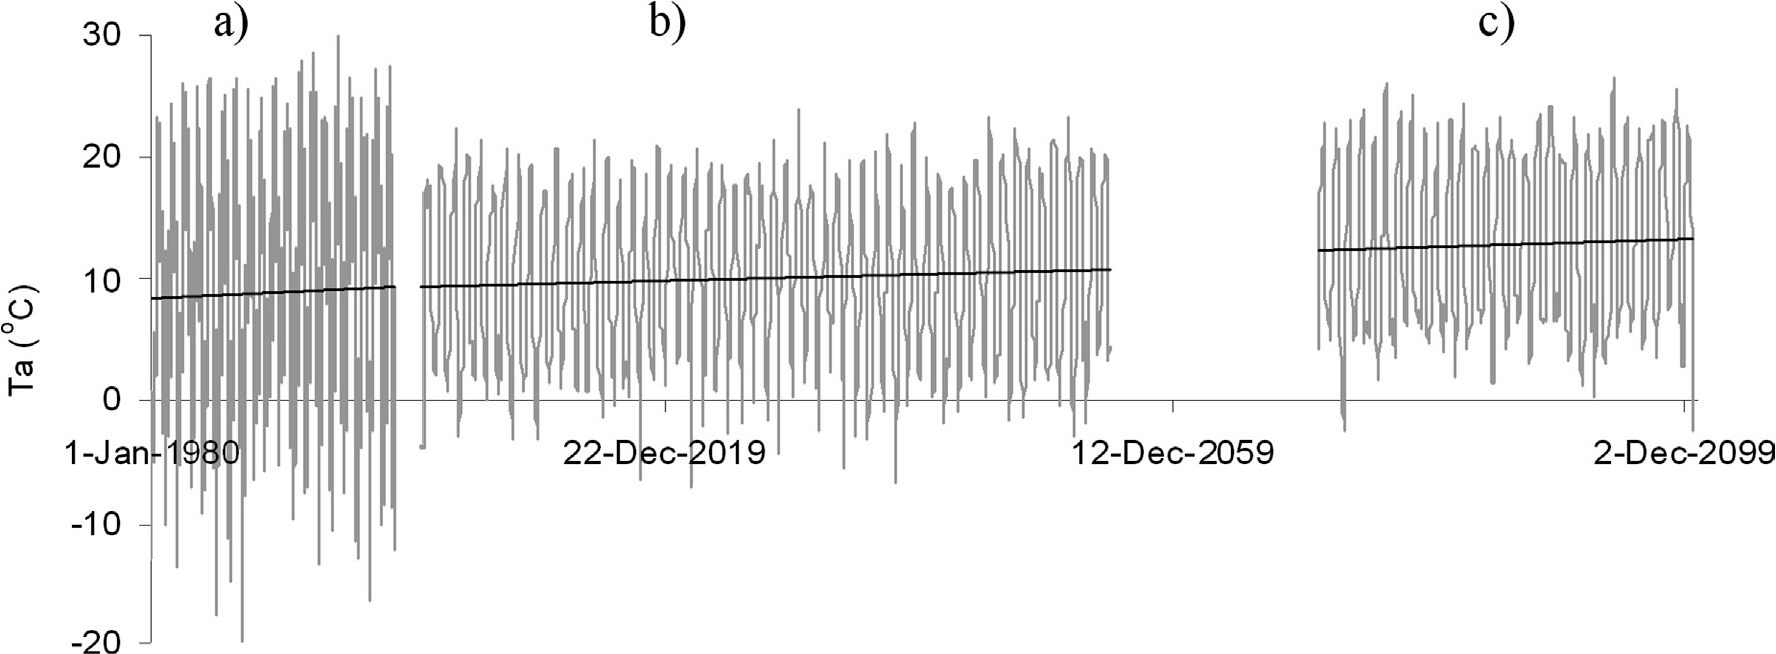
Fig. 3.
Temporal dynamics of surface and near-bottom temperature in MS. Points stand for observational data (Ts meas and Tb meas), lines represent results of simulations (Ts mod and Tb mod).
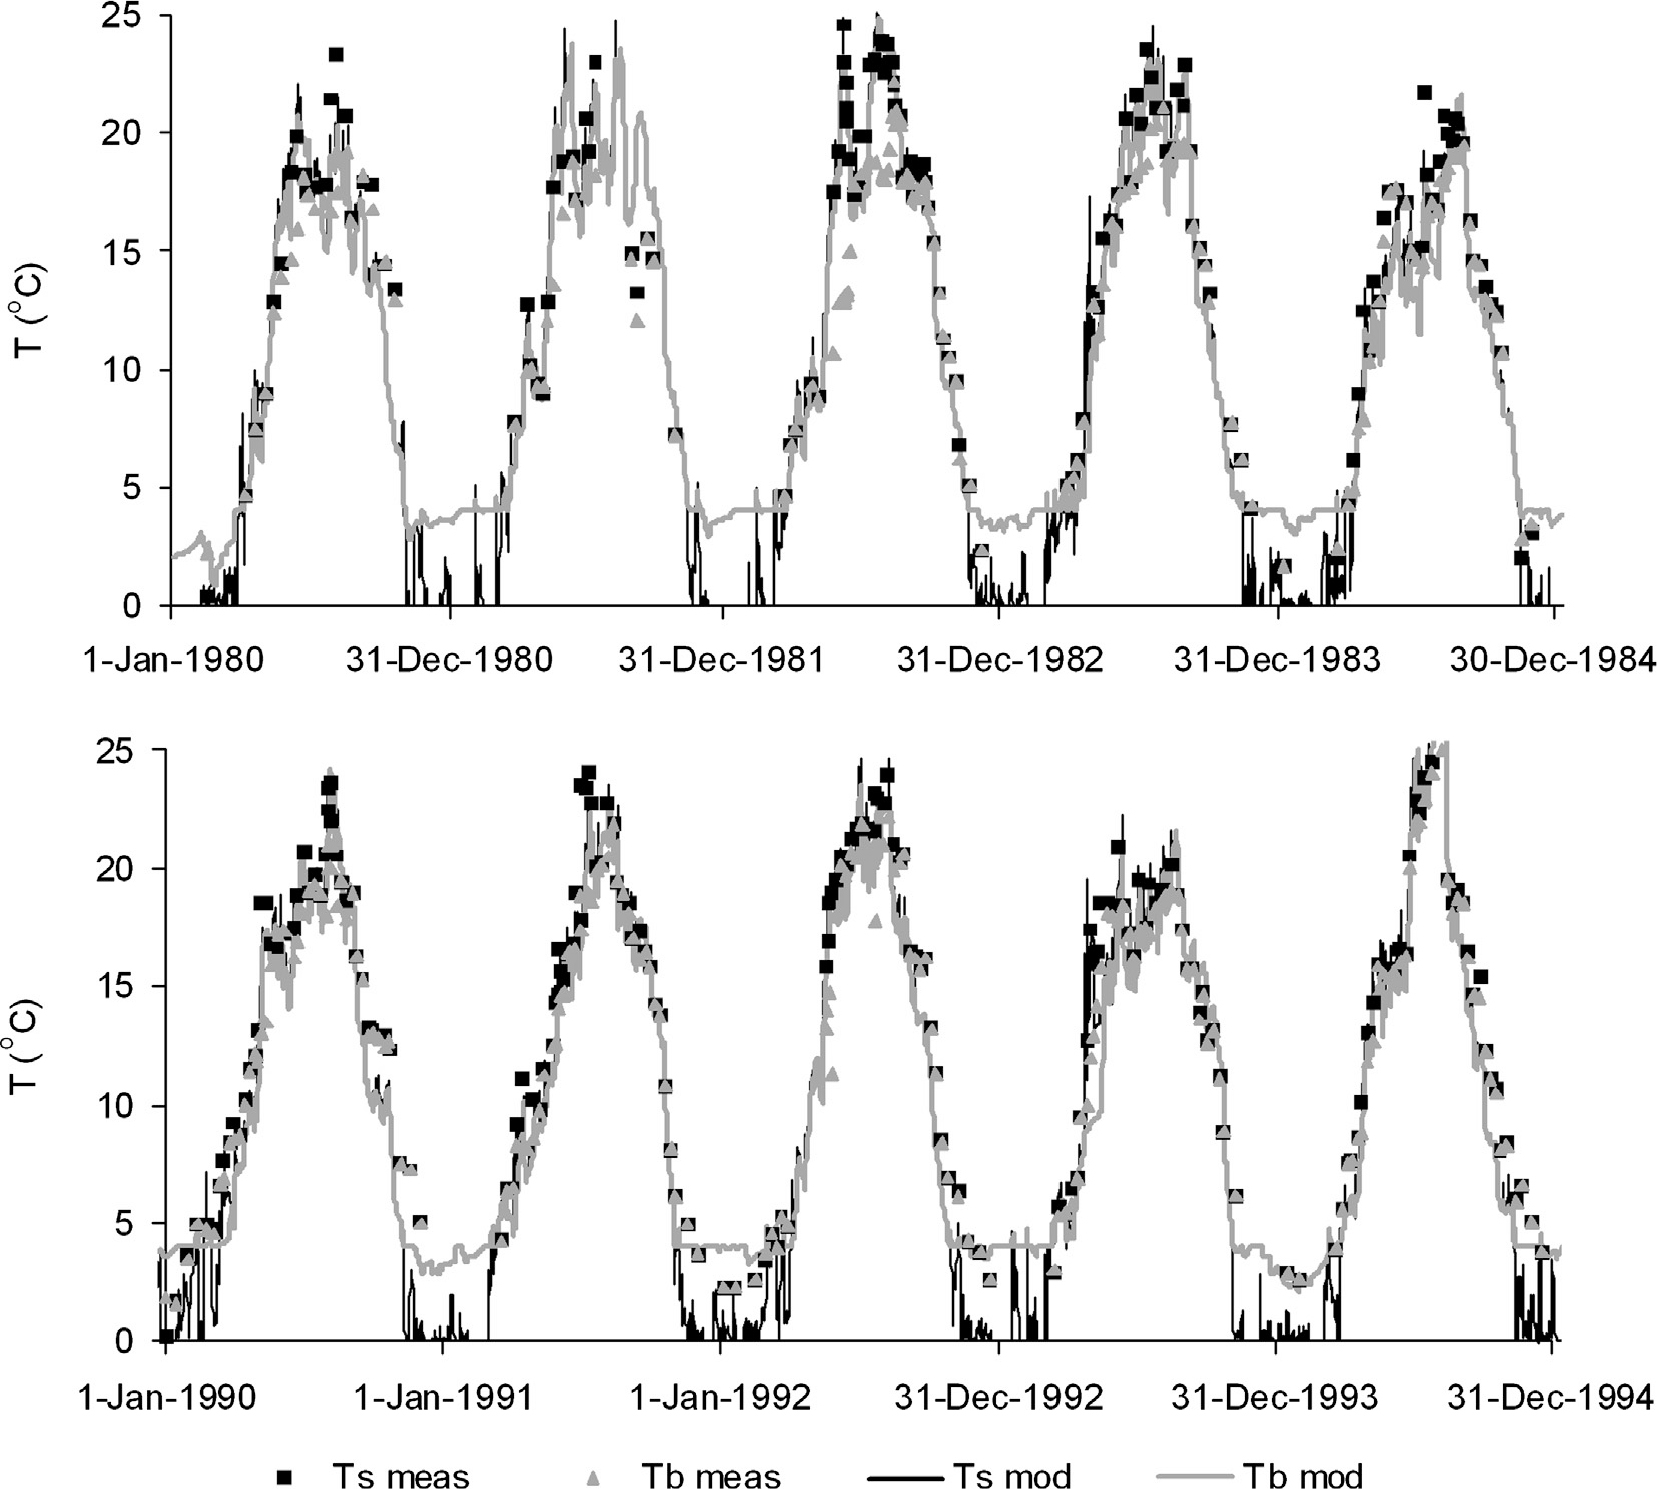
Fig. 4.
The same as in Fig. 3, but for HS.
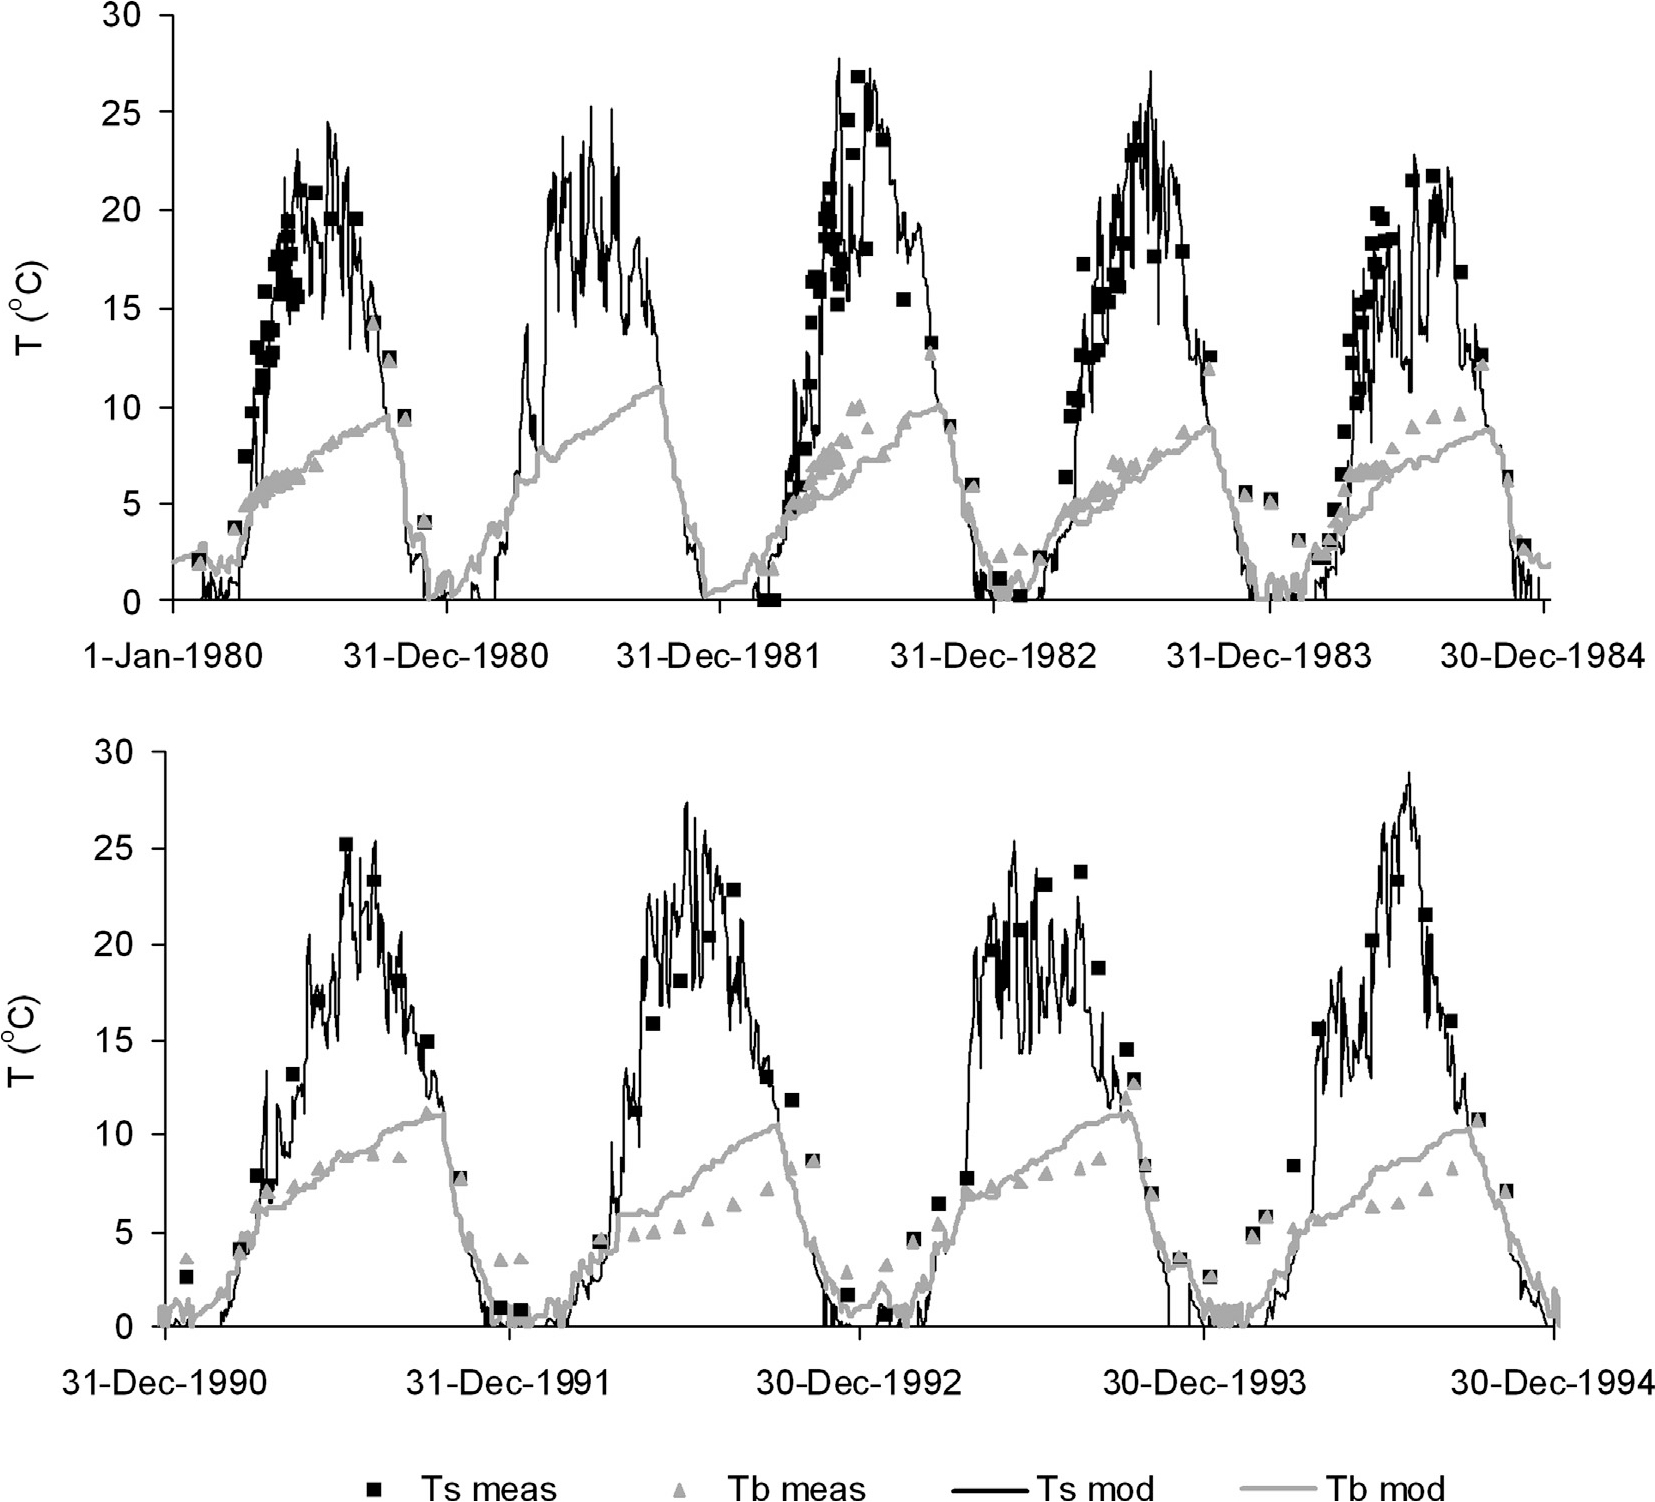
Fig. 5.
Temporal dynamics of surface and near-bottom DO concentrations in MS during 1980–1984 (a); and 1990–1994 (b). Points stand for the observational data (Cs meas and Cb meas), line represents the results of simulations (Cs mod and Cb mod).
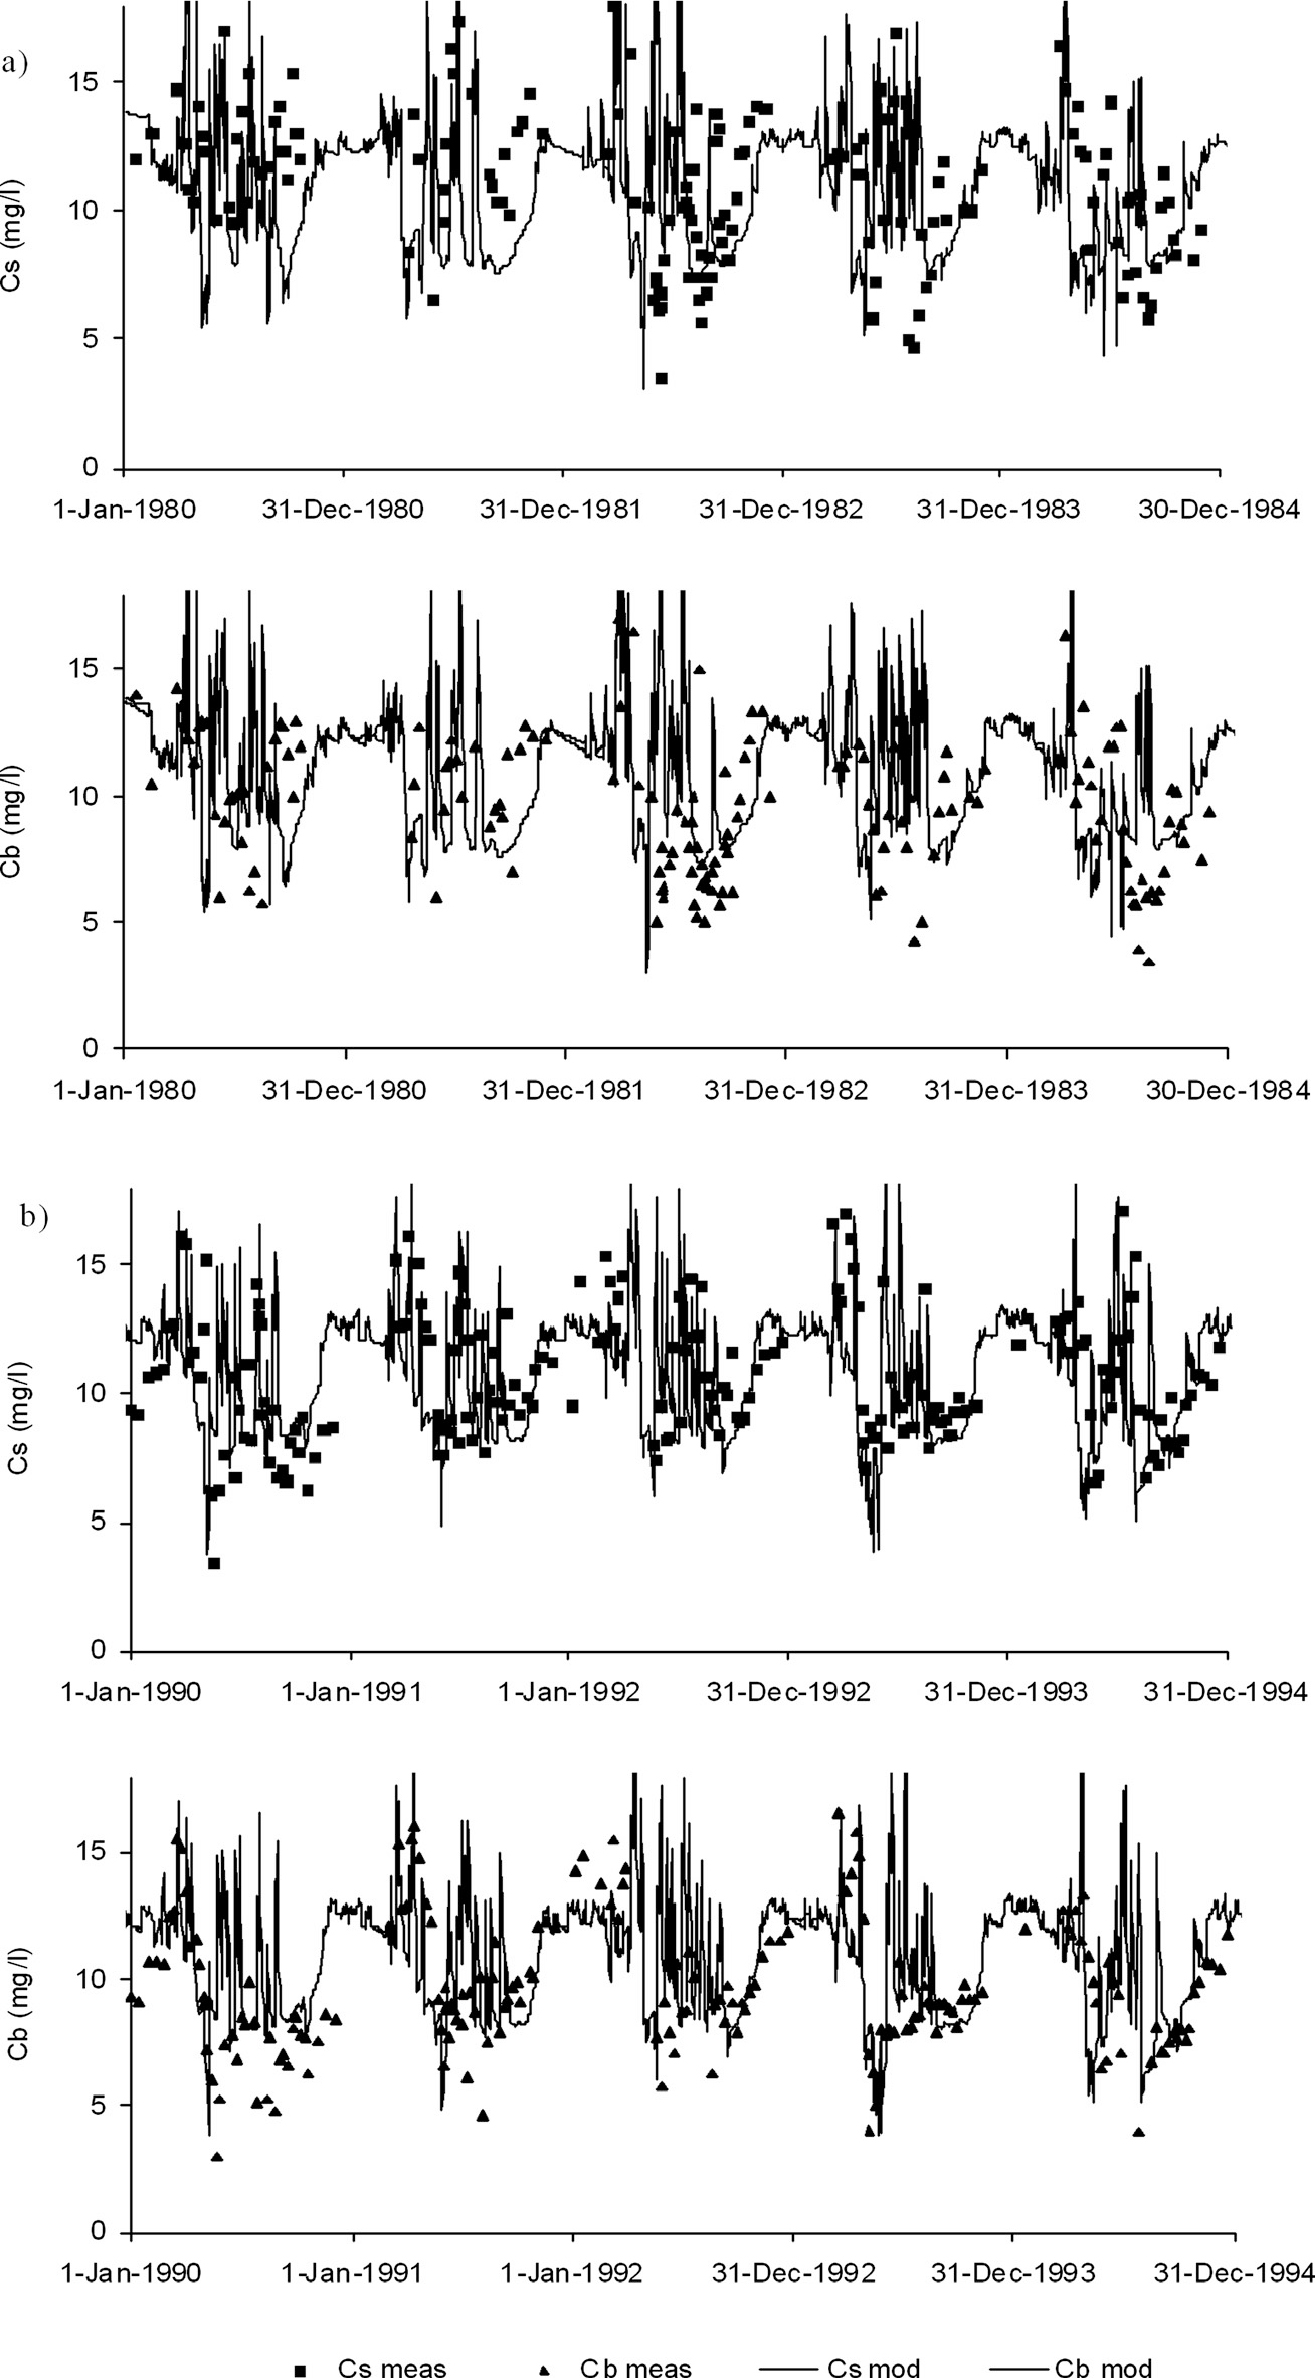
Fig. 6.
Temporal dynamics of surface and near-bottom DO concentrations in HS during 1980–1984 (a); and 1994–1998 (b). Notation is the same as in Fig. 5.
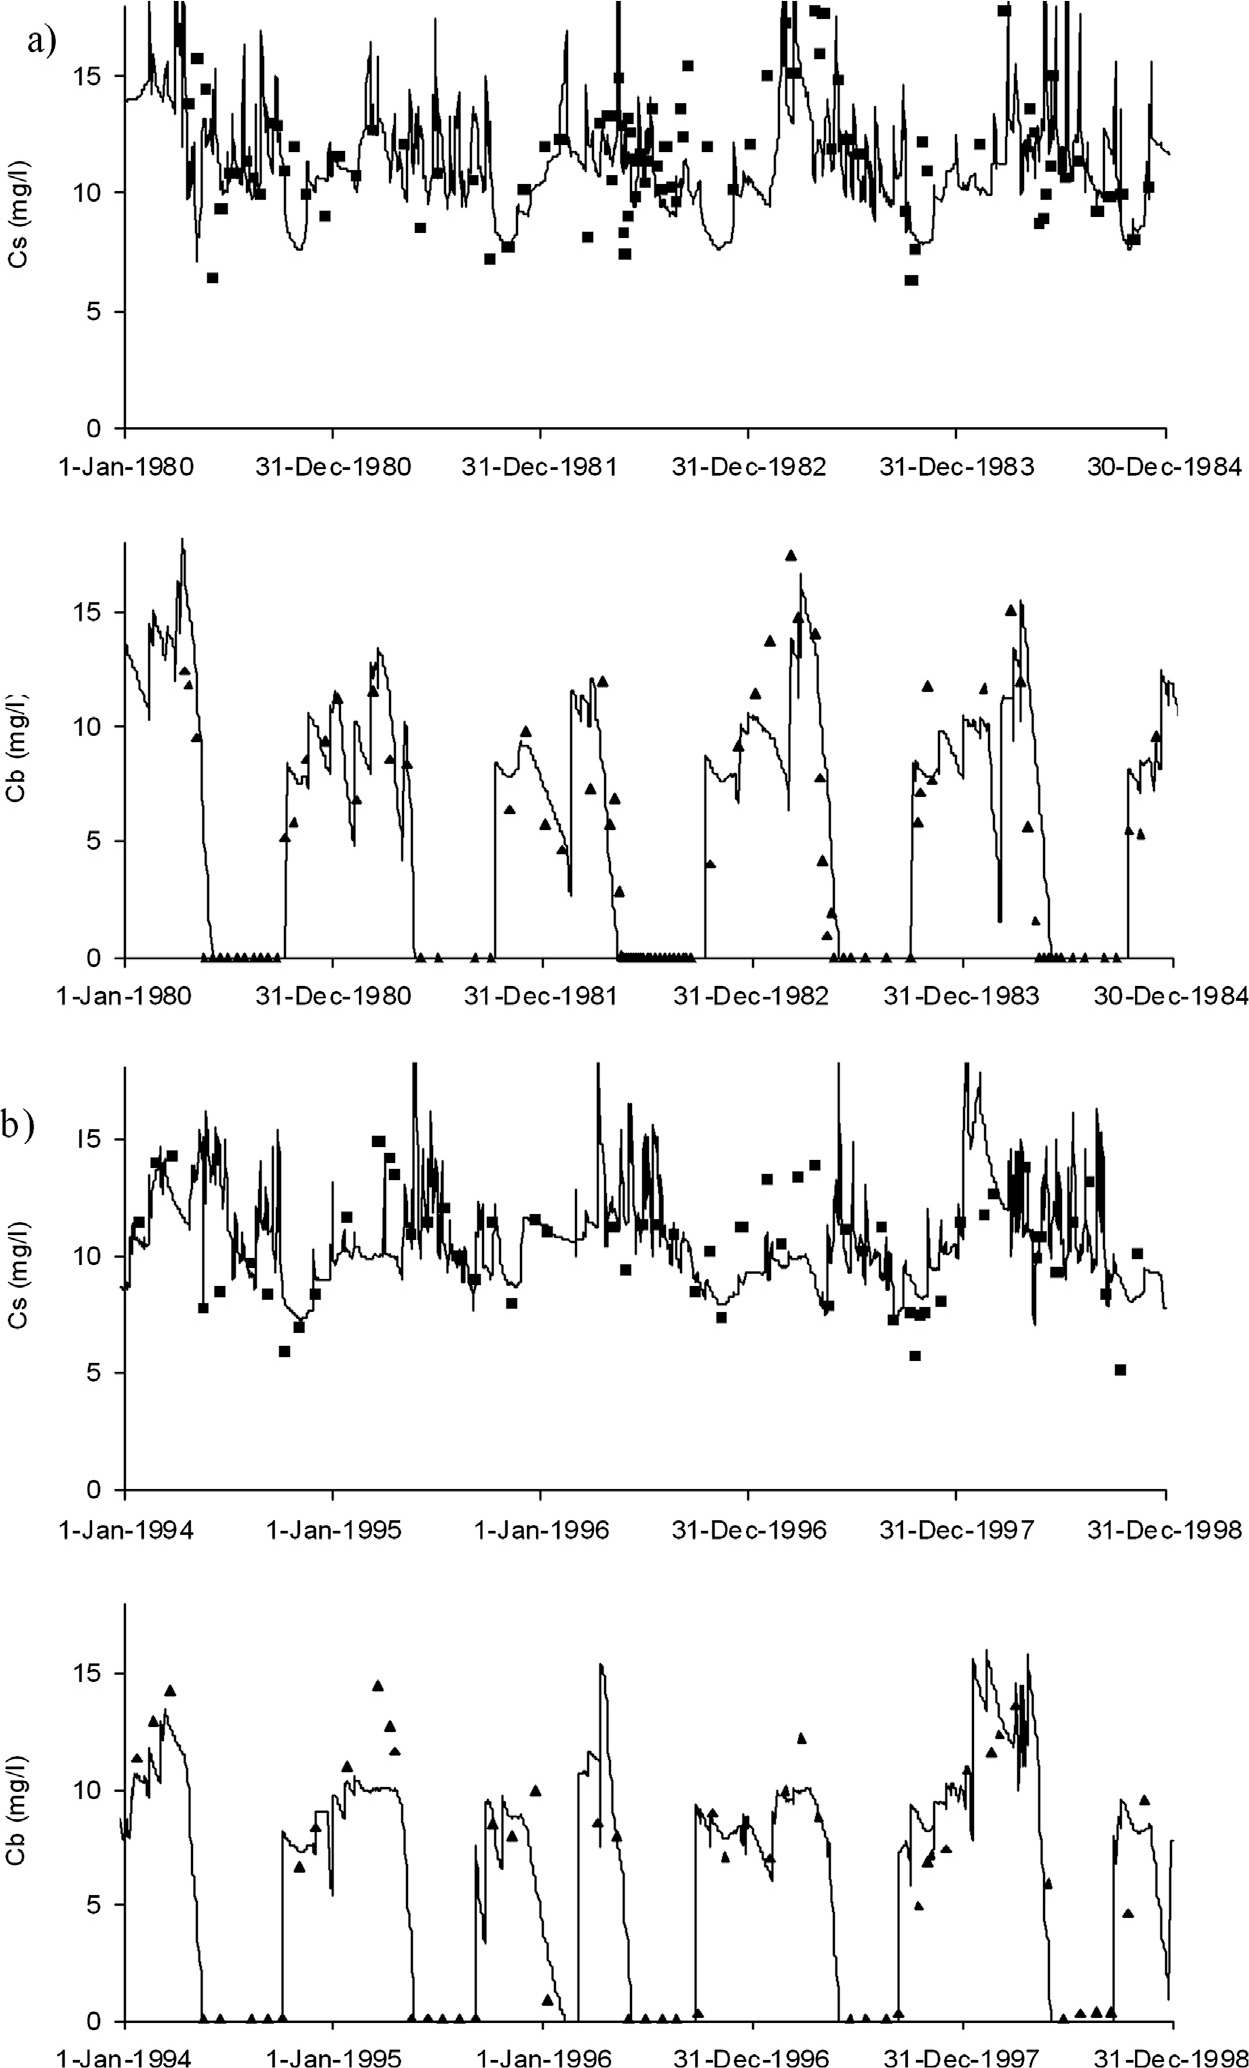
Fig. 7.
Evolution of an anaerobic zone in HS. Points stand for observational data, line represents the results of simulations.
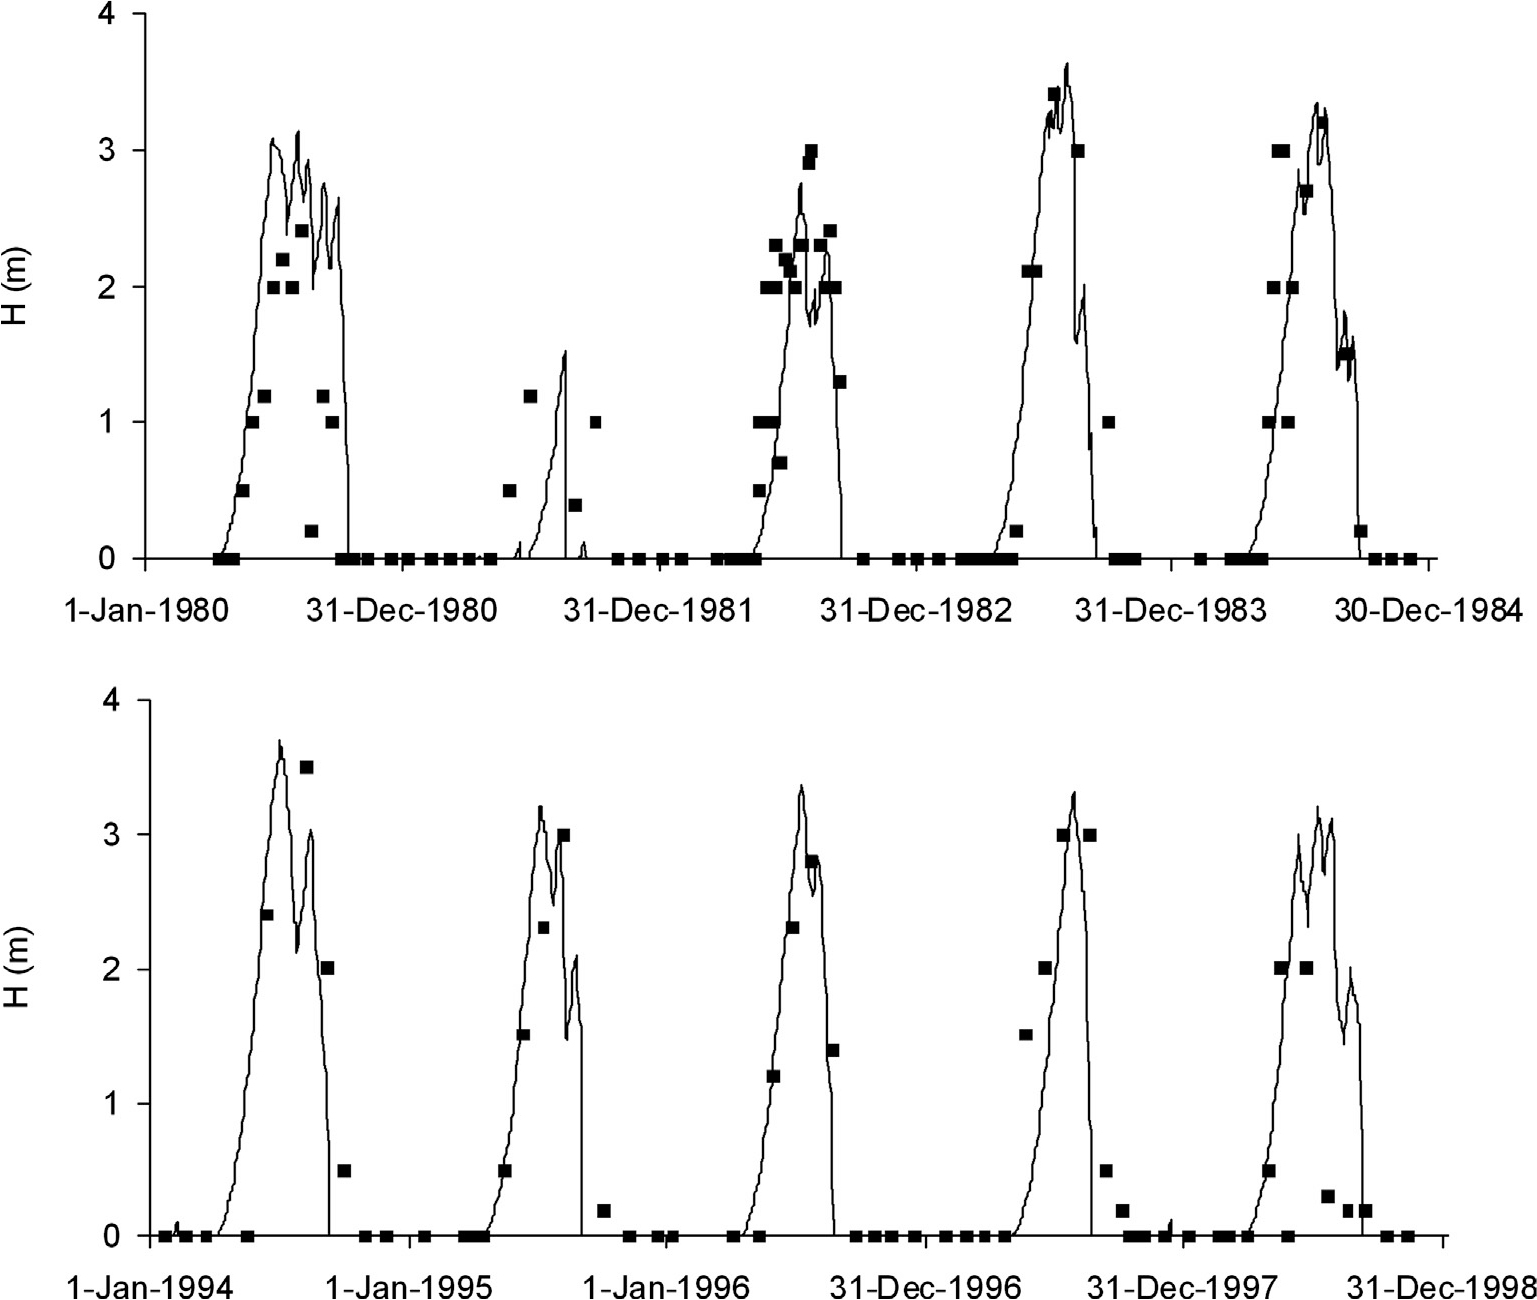
Fig. 8.
Current and projected seasonal dynamics of surface (Ts) and near-bottom (Tb) temperature in MS and in HS.
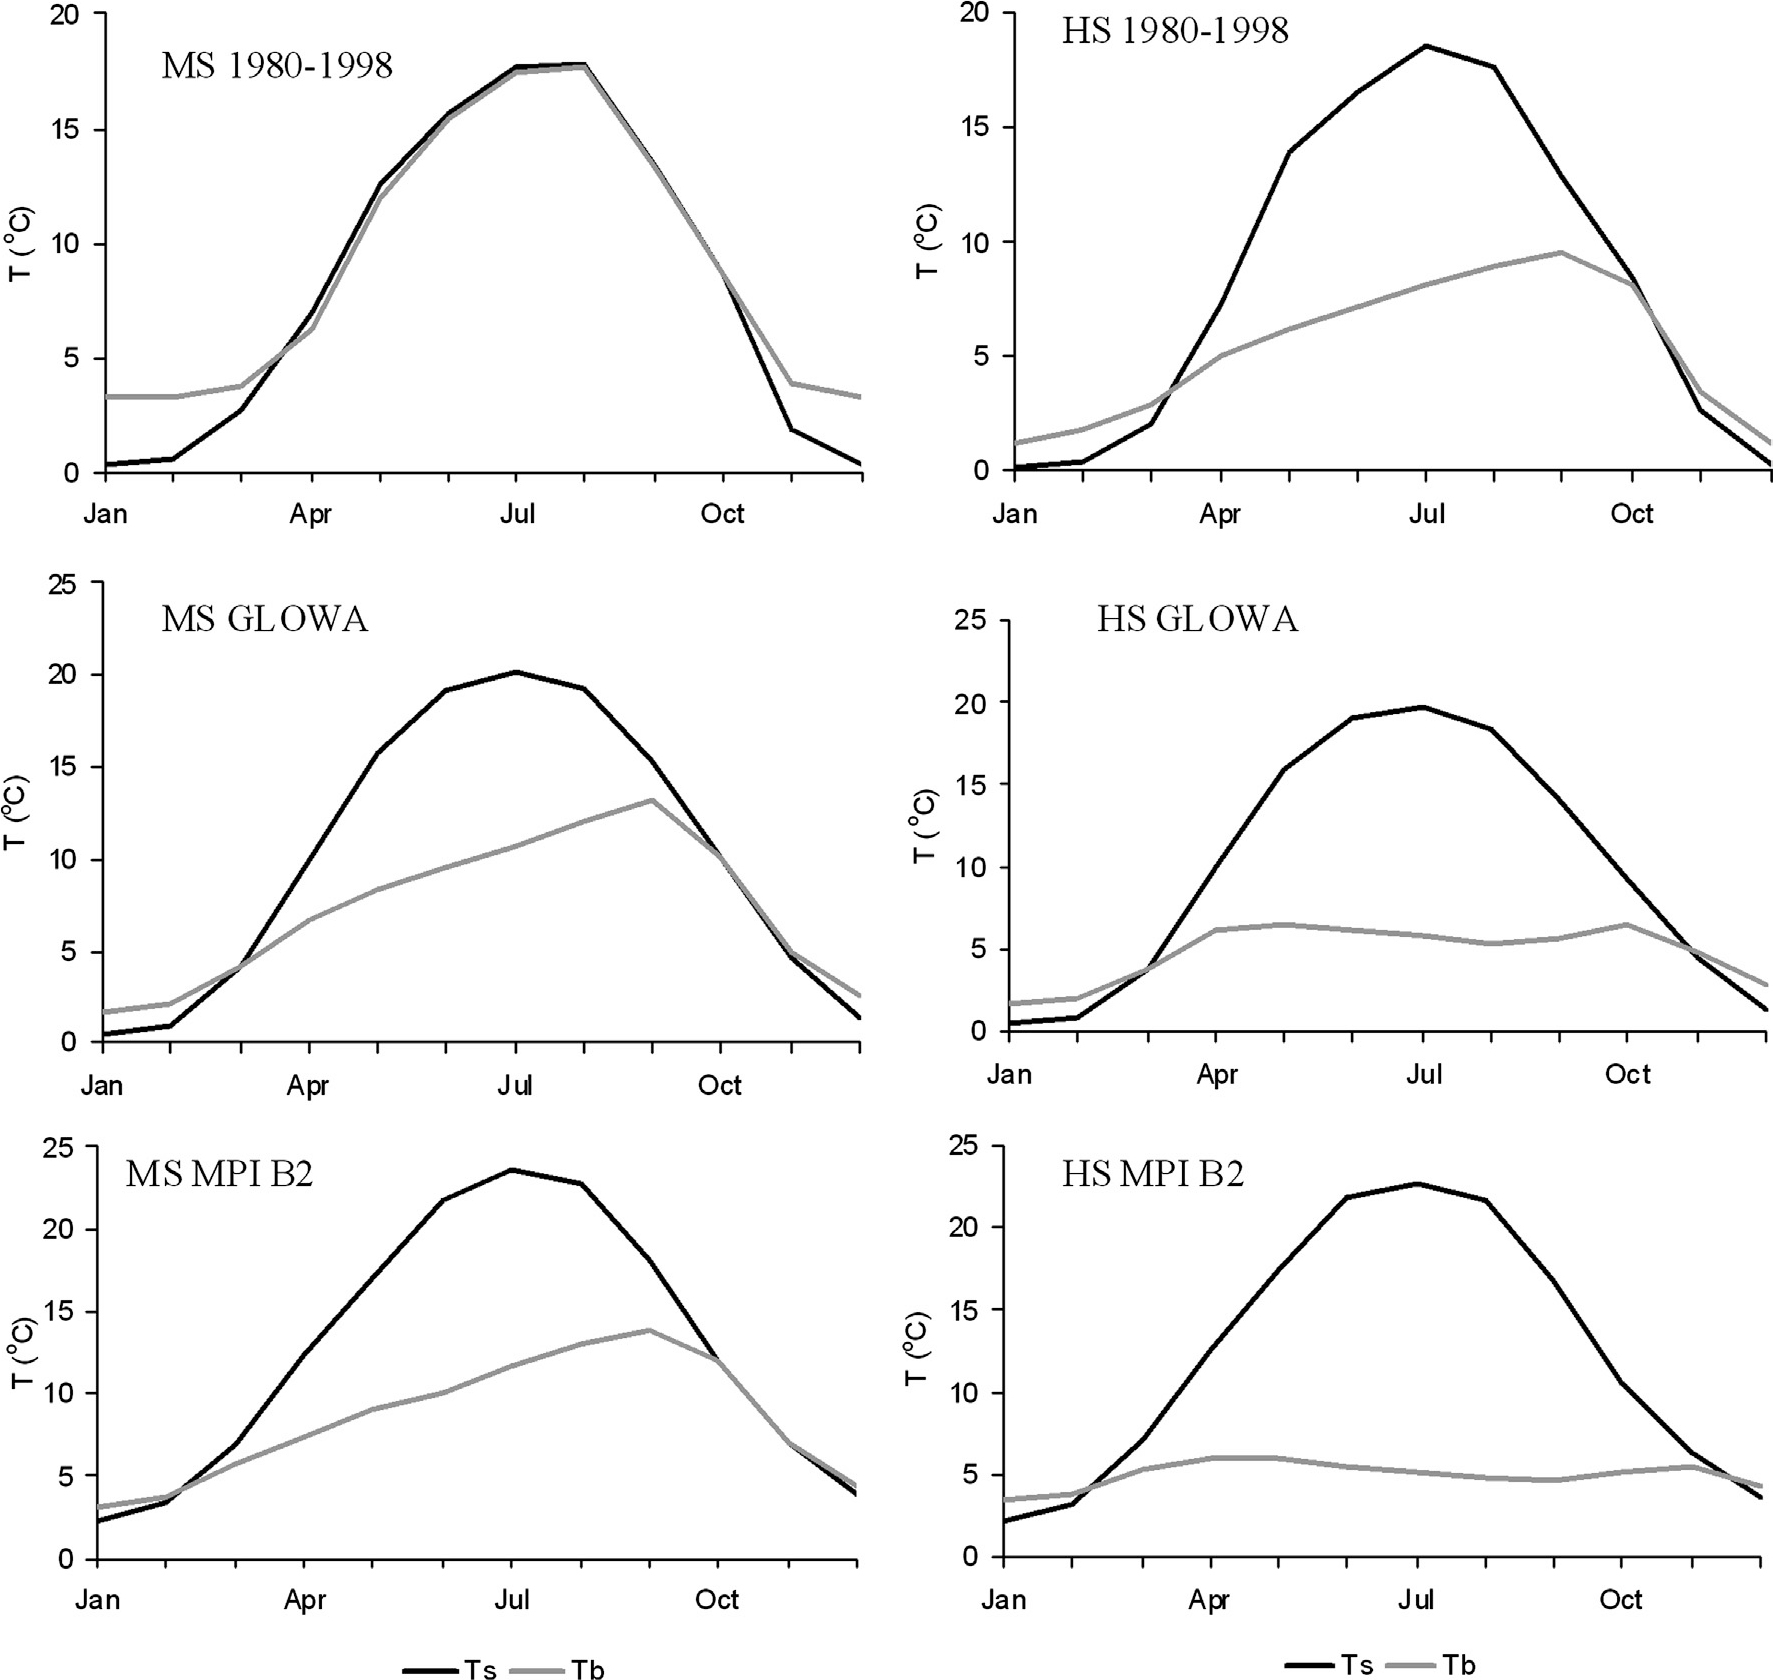
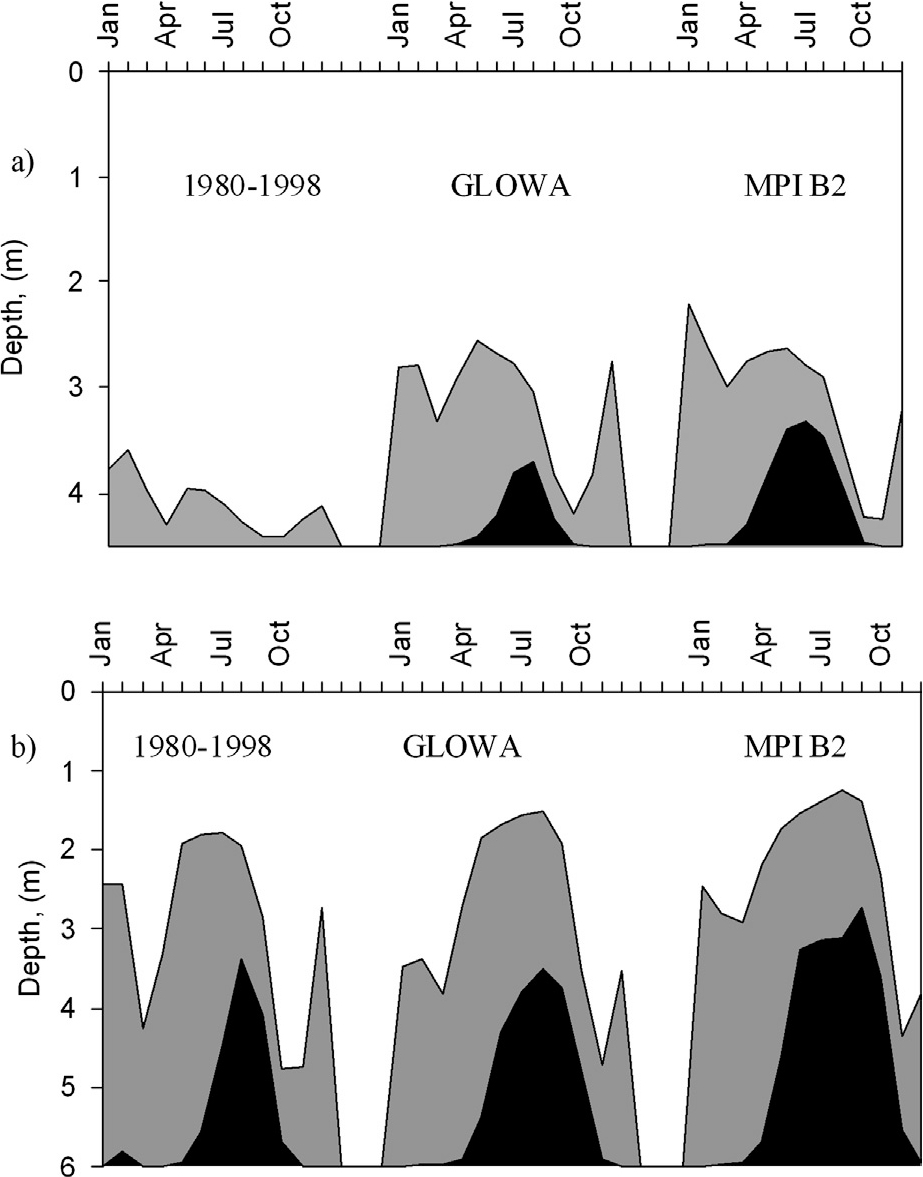
Fig. 9.
Current and projected seasonal dynamics of the anaerobic layer thickness in MS (a); and in HS (b). The white area bounds well aerated ‘problem-free’ upper mixed layers, grey coloured area coincides with the gradual decrease (from 100% to 0% of saturation) of DO concentration. The anoxic zone (complete absence of DO) is marked by black colour.