Fig. 1.
Unfiltered MSLP field on 06:00 14 October 1993 (hPa).
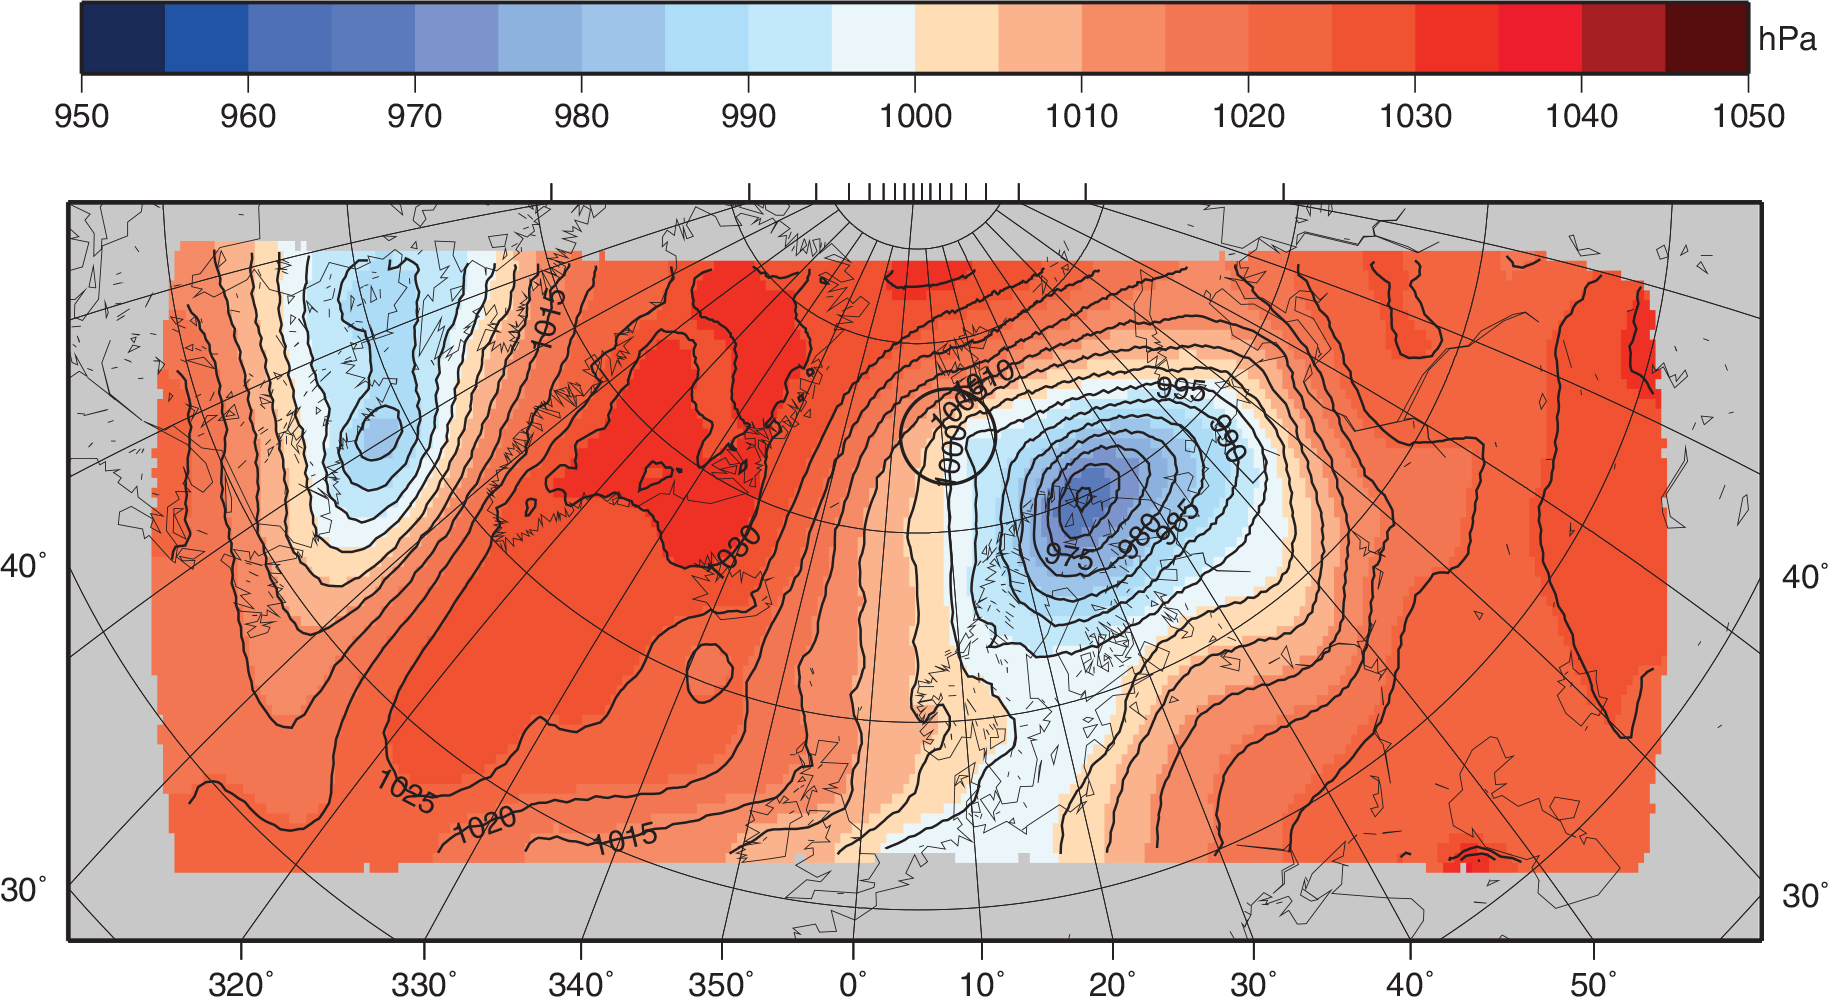
Fig. 2.
NOAA 11/AVHRR channel 4 thermal infrared for 1529 UTC 14 October 1993 (from www.sat.dundee.ac.uk/).
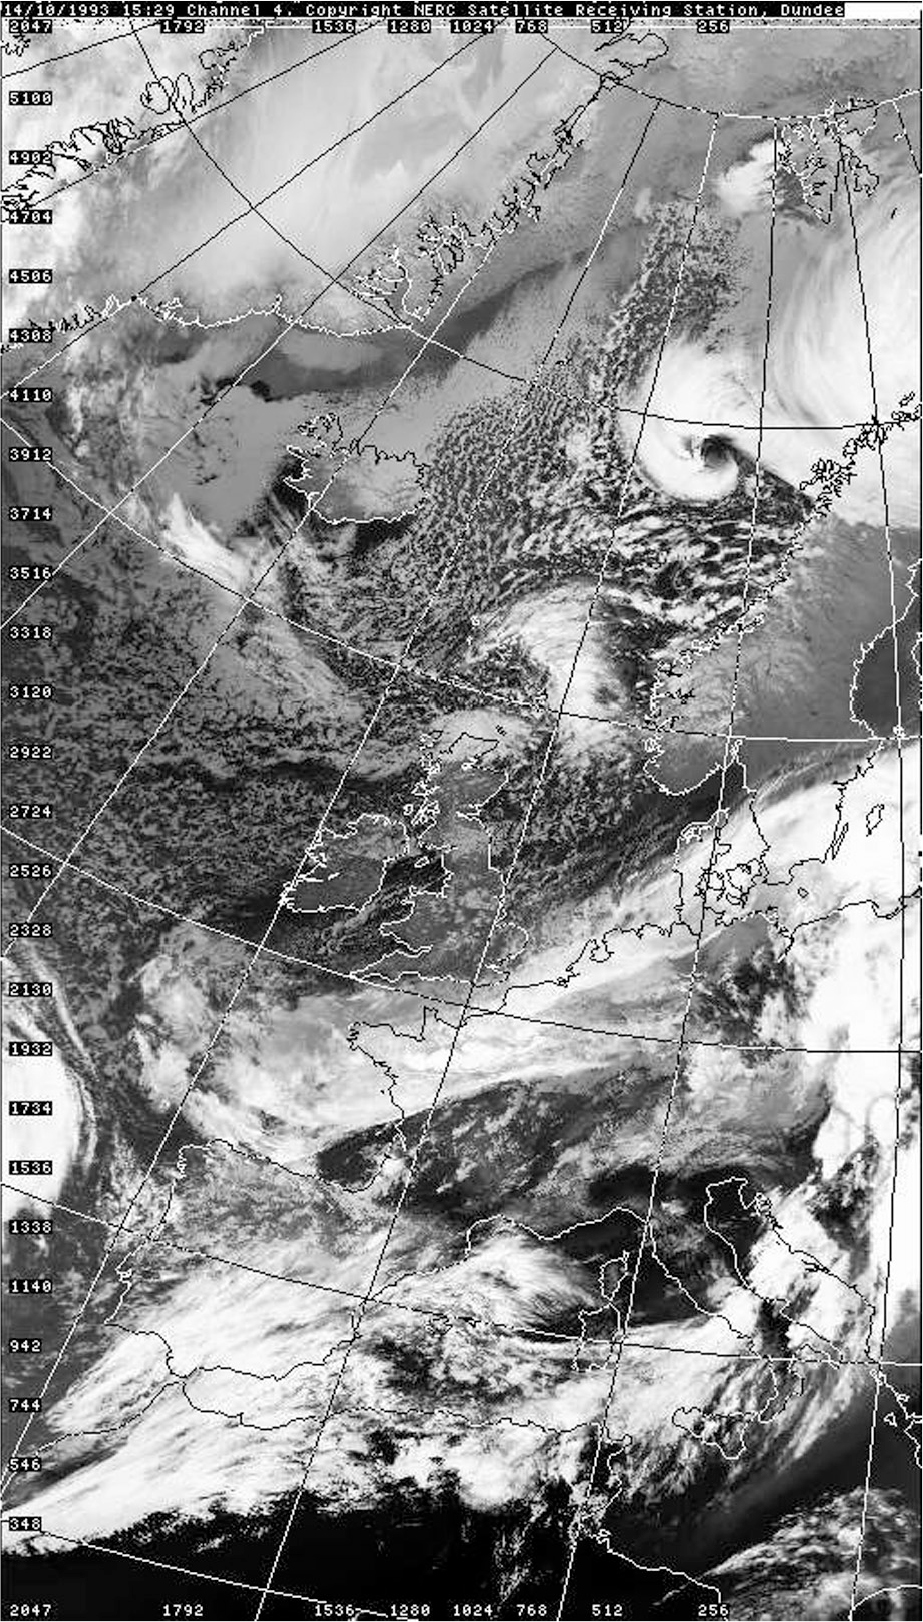
Fig. 3.
Bandpass filtered MSLP fields on 06:00 14 October 1993 (hPa): (a) digital filter, (b) DCT, and detected minima: red by KH and green by MZ.
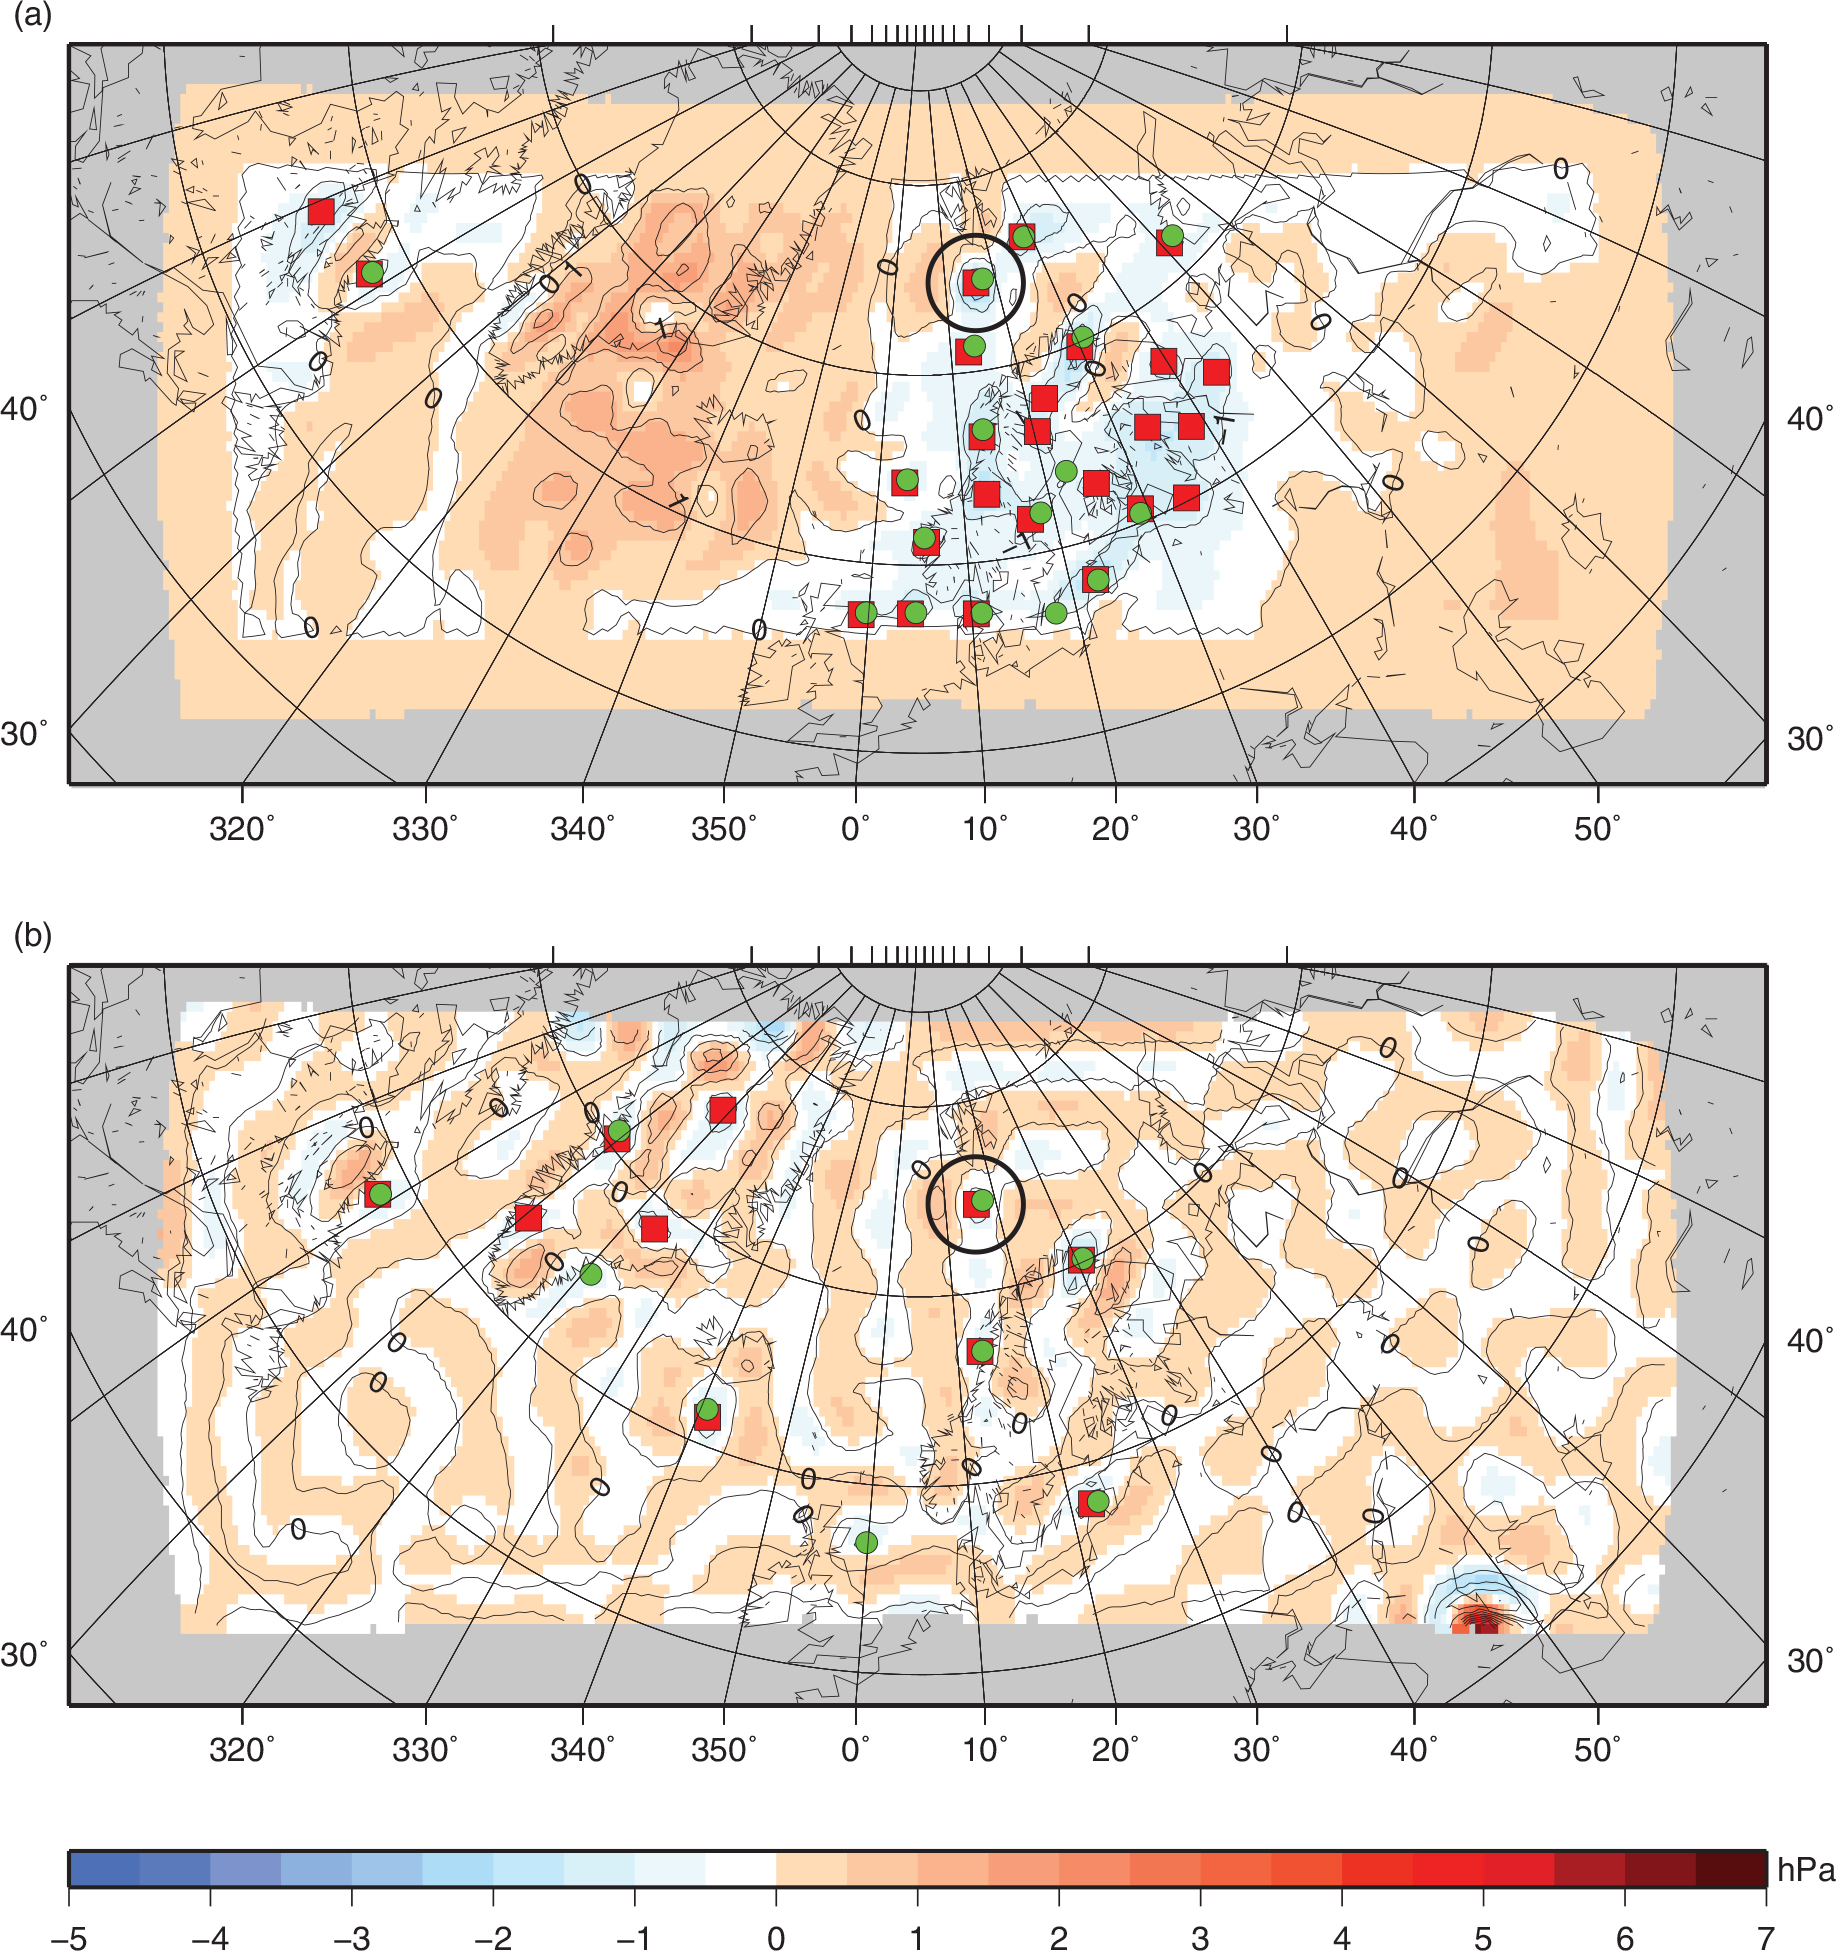
Fig. 4.
Bandpass filtered 850 hPa relative vorticity fields on 06:00 14 October 1993 (10−5 s−1): (a) digital filter and (b) DCT.
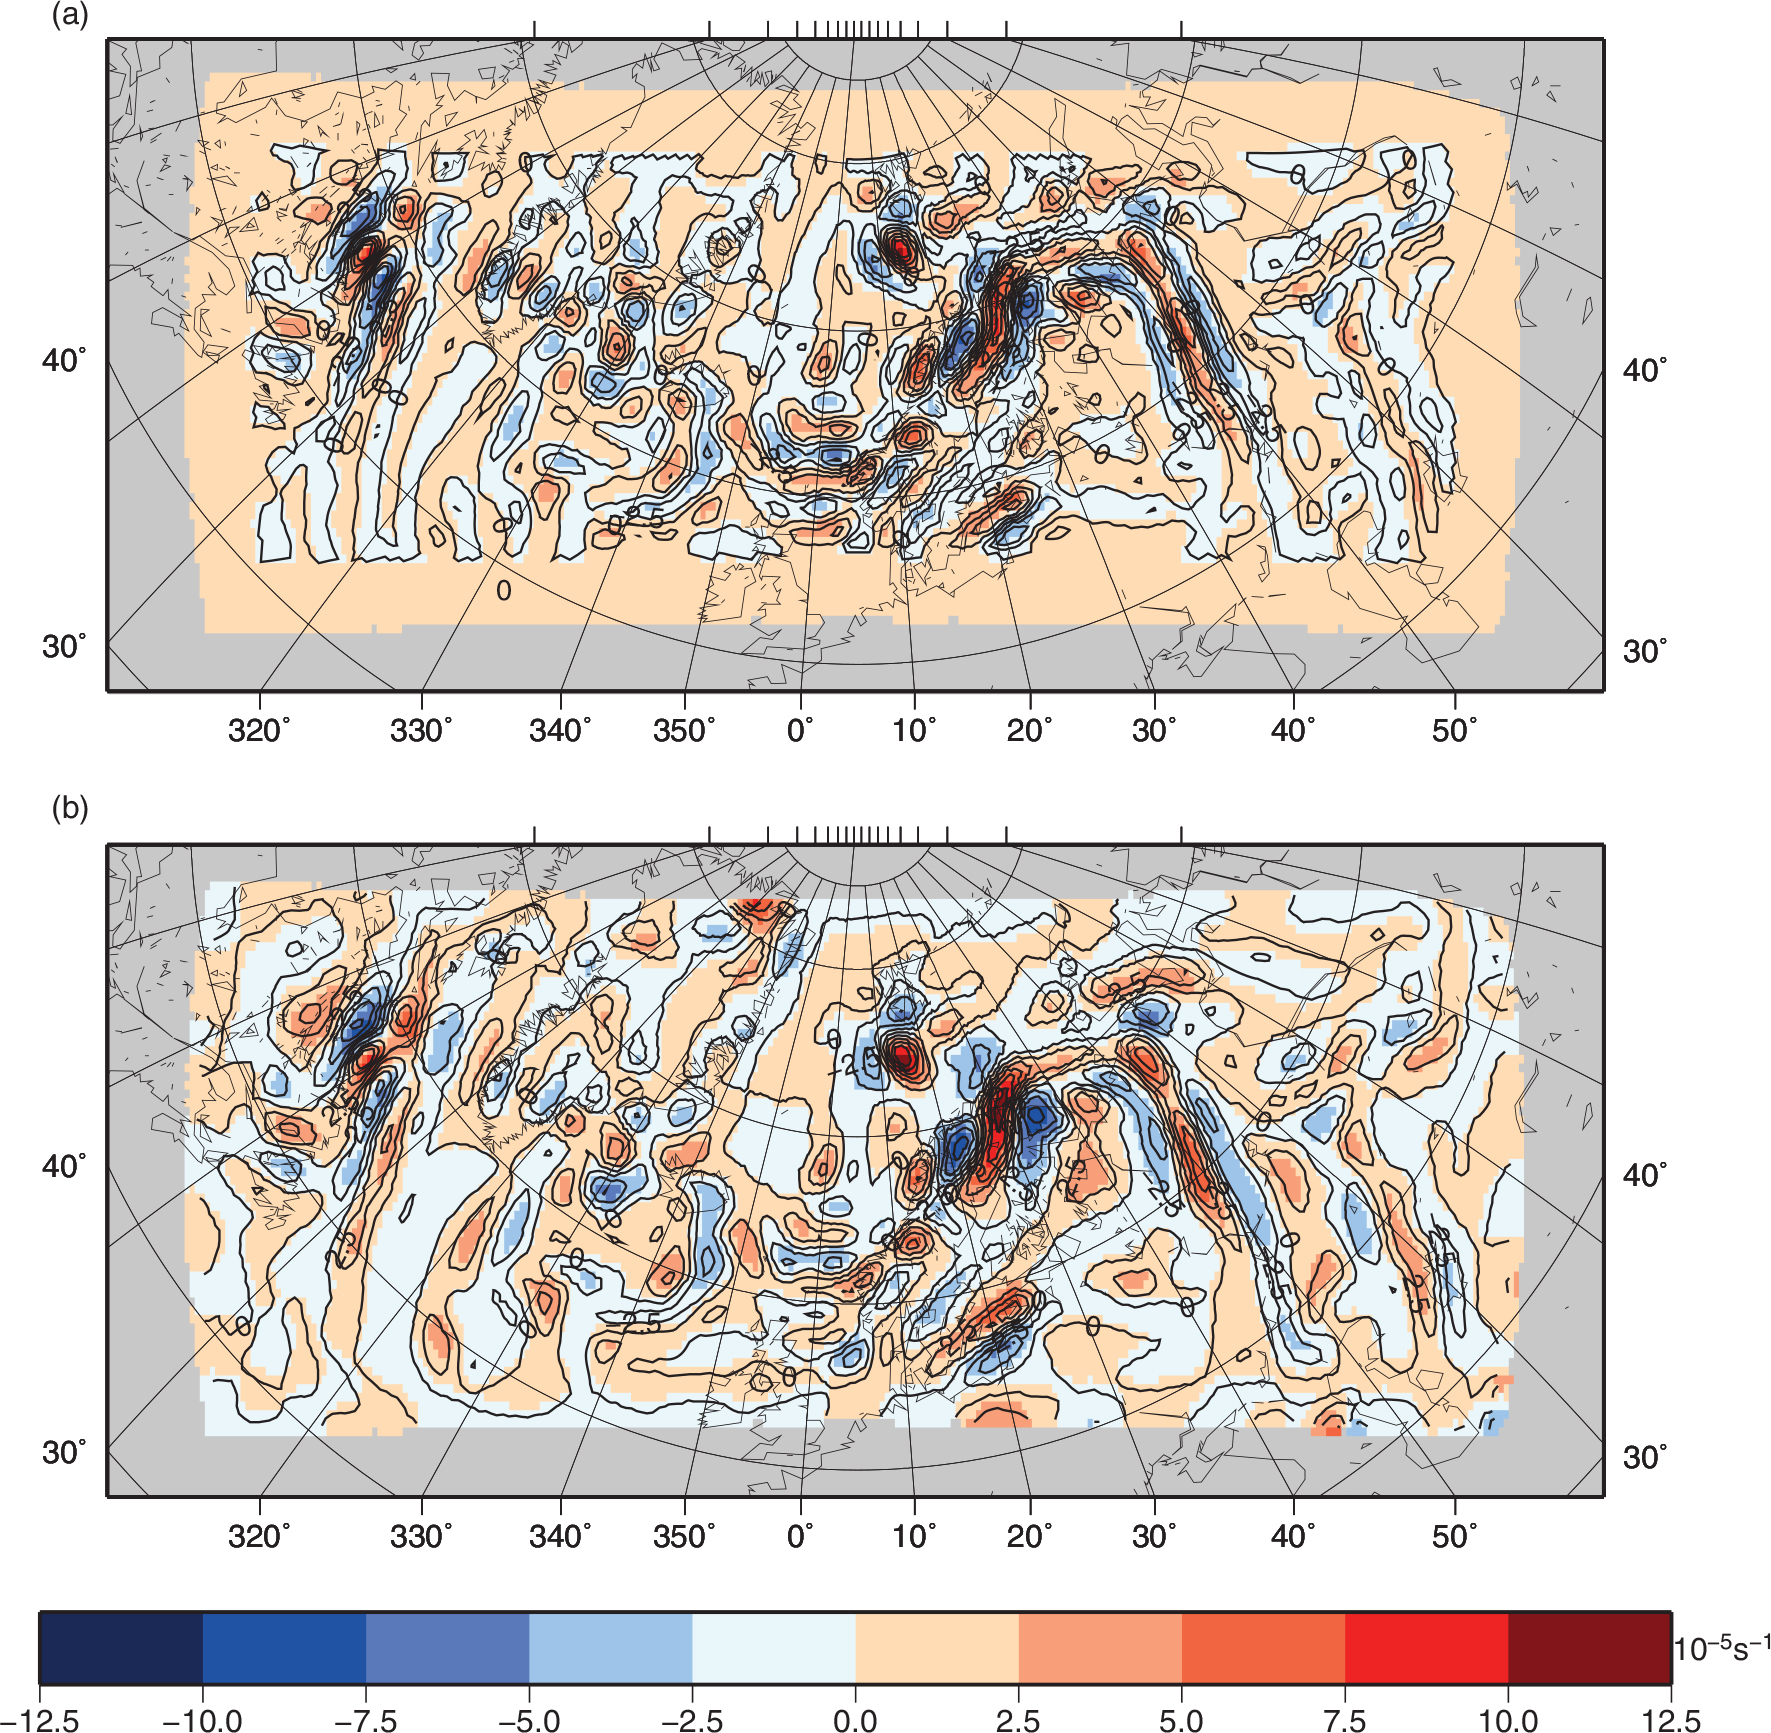
Table 1. Numbers of tracks resulting from different combinations between MZ and KH (October 1993 to September 1995)
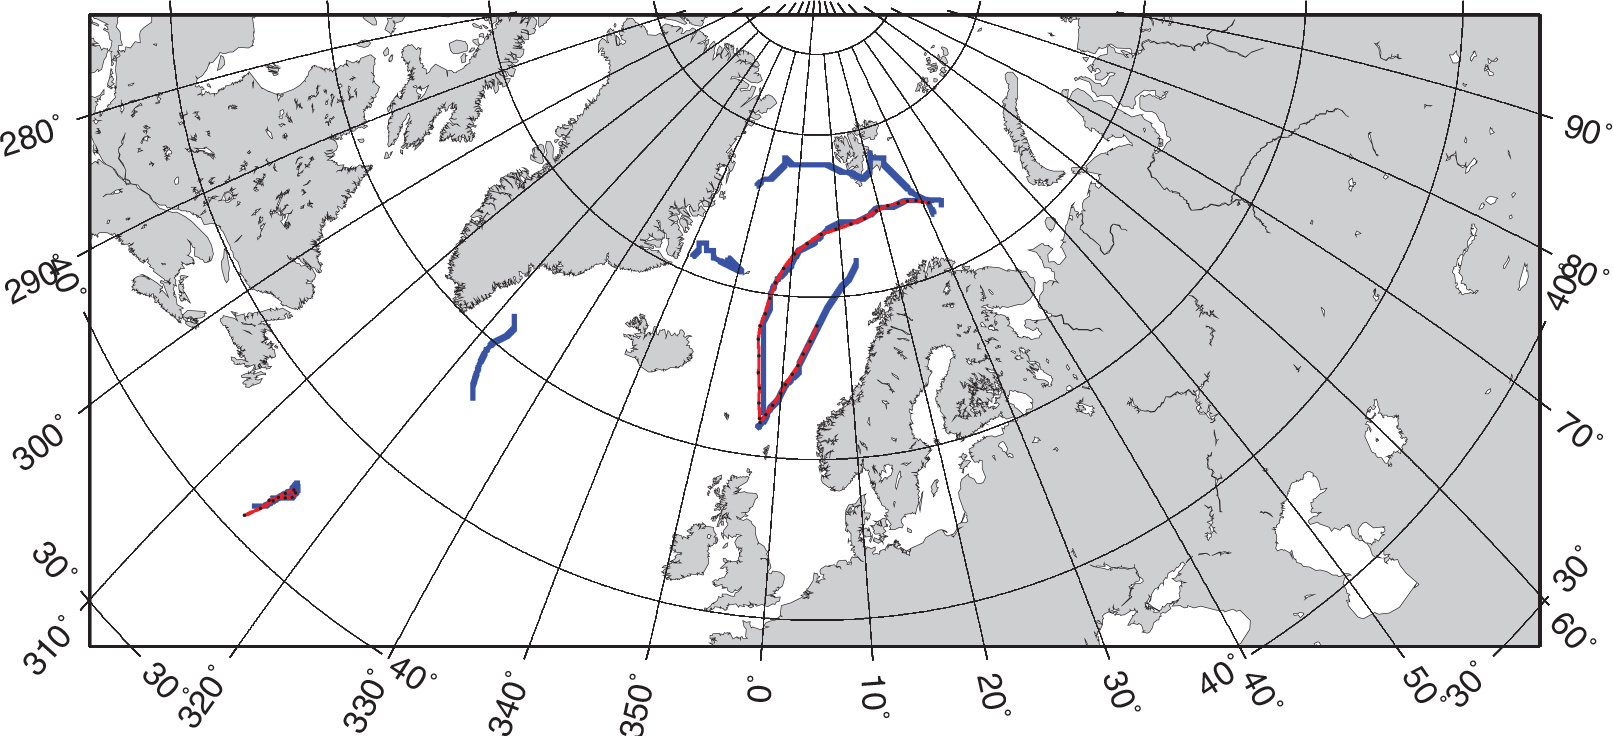
Fig. 5.
Overlapping tracks in October 1993 for combination 5 (blue) and combination 7 (red) of Table 1.
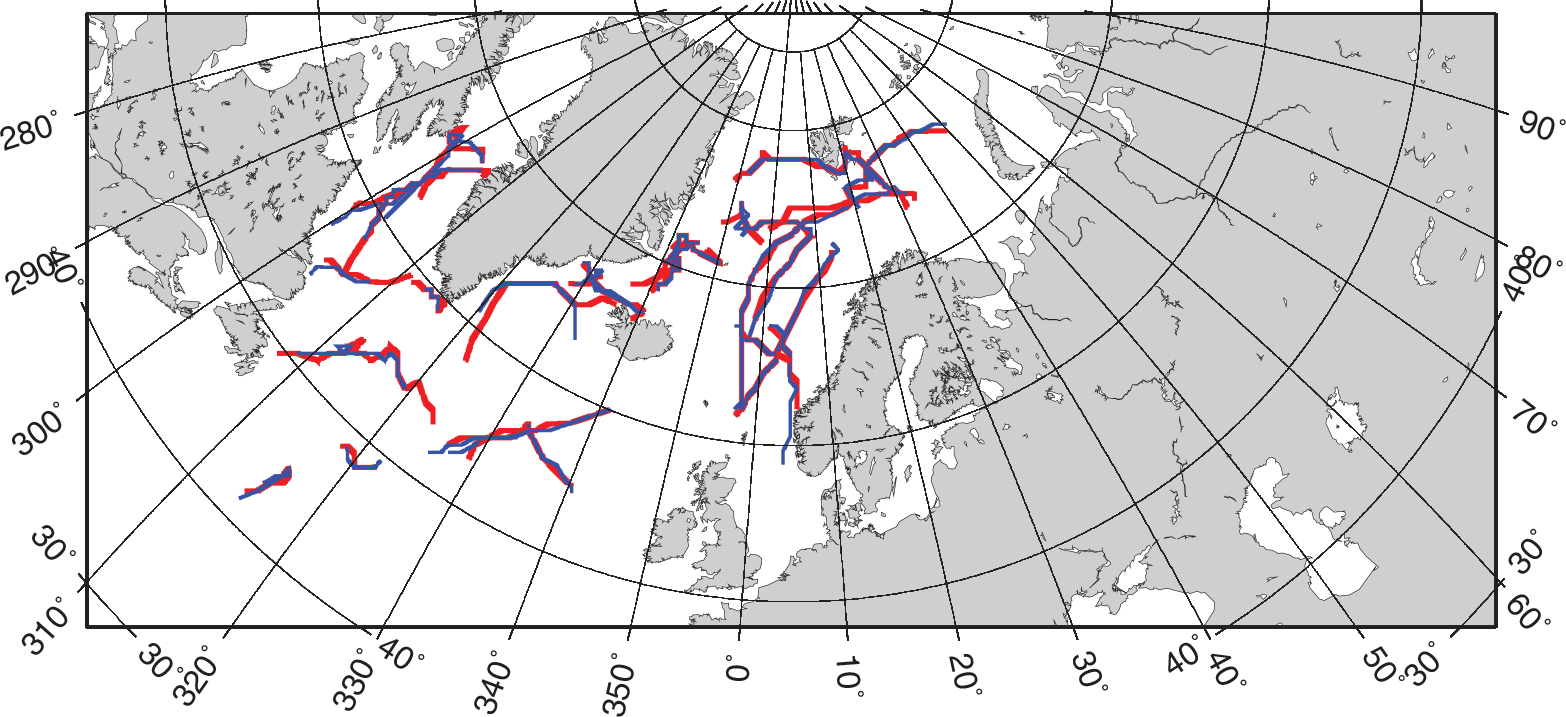
Table 2. Number N o of overlapping tracks, probability P o for overlapping tracks and ratio P m of non-overlapping tracks for different combinations in Table 1 using combination 1 as a reference
Table 3. Number N o of overlapping tracks, probability P o for overlapping tracks and ratio P m of non-overlapping tracks for different combinations in Table 1 using combination 7 as a reference
Table 4. Numbers of retained potential polar lows after applying the respective criteria in Section 2.4 in October 1993 to September 1995
[i] ‘Noland’ means that it excludes tracks over the land as applying the criterion 4; ‘filtered minimum’ means that filtered MSLP should be below –2 hPa at least once along a track as applying the criterion 1; ‘wind speed’ means that the maximum 10 m wind speed around the storm centre has to be larger than 13.9 m s−1 at least for 20% of the positions as applying the criterion 2; ‘vst’ means that vertical instability should be fulfilled as applying the criterion 3; ‘NS’ requires the tracks to go from north to south as applying the criterion 5 and ‘supmin’ means that the filtered MSLP falls below −6 hPa at least once along the track and ‘noland’ is also fulfilled as applying the criterion 6. ‘Sum’ is the final number of retained potential polar lows
Fig. 6.
Tracks of potential polar lows after applying criteria to combination 1 (red with points) of KH and combination 7 of MZ in October 1993 (blue).