Fig. 1.
One-way nested computational domains centred about Kentucky: (a) outer and (b) inner domain.
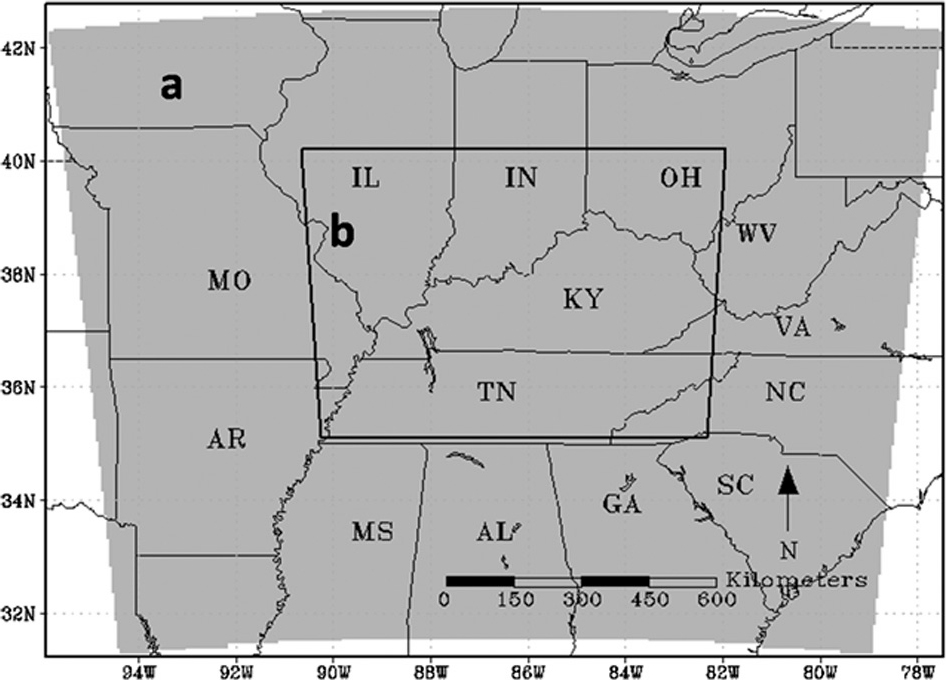
Fig. 2.
(a) Twenty-four hour accumulated precipitation (mm) for the CTRL run from 11 June 1200 UTC to 12 June 1200 UTC; (b) CTRL minus the ensemble average of DRY simulations and (c) for the CTRL minus the ensemble average of WET simulations. Shading refers to positive rainfall intensity while white regions and dashed lines denote negative rainfall intensity. Plotted also is the 24 h average of horizontal wind field (vector scale 2 m s−1) at 960 hPa for that period.
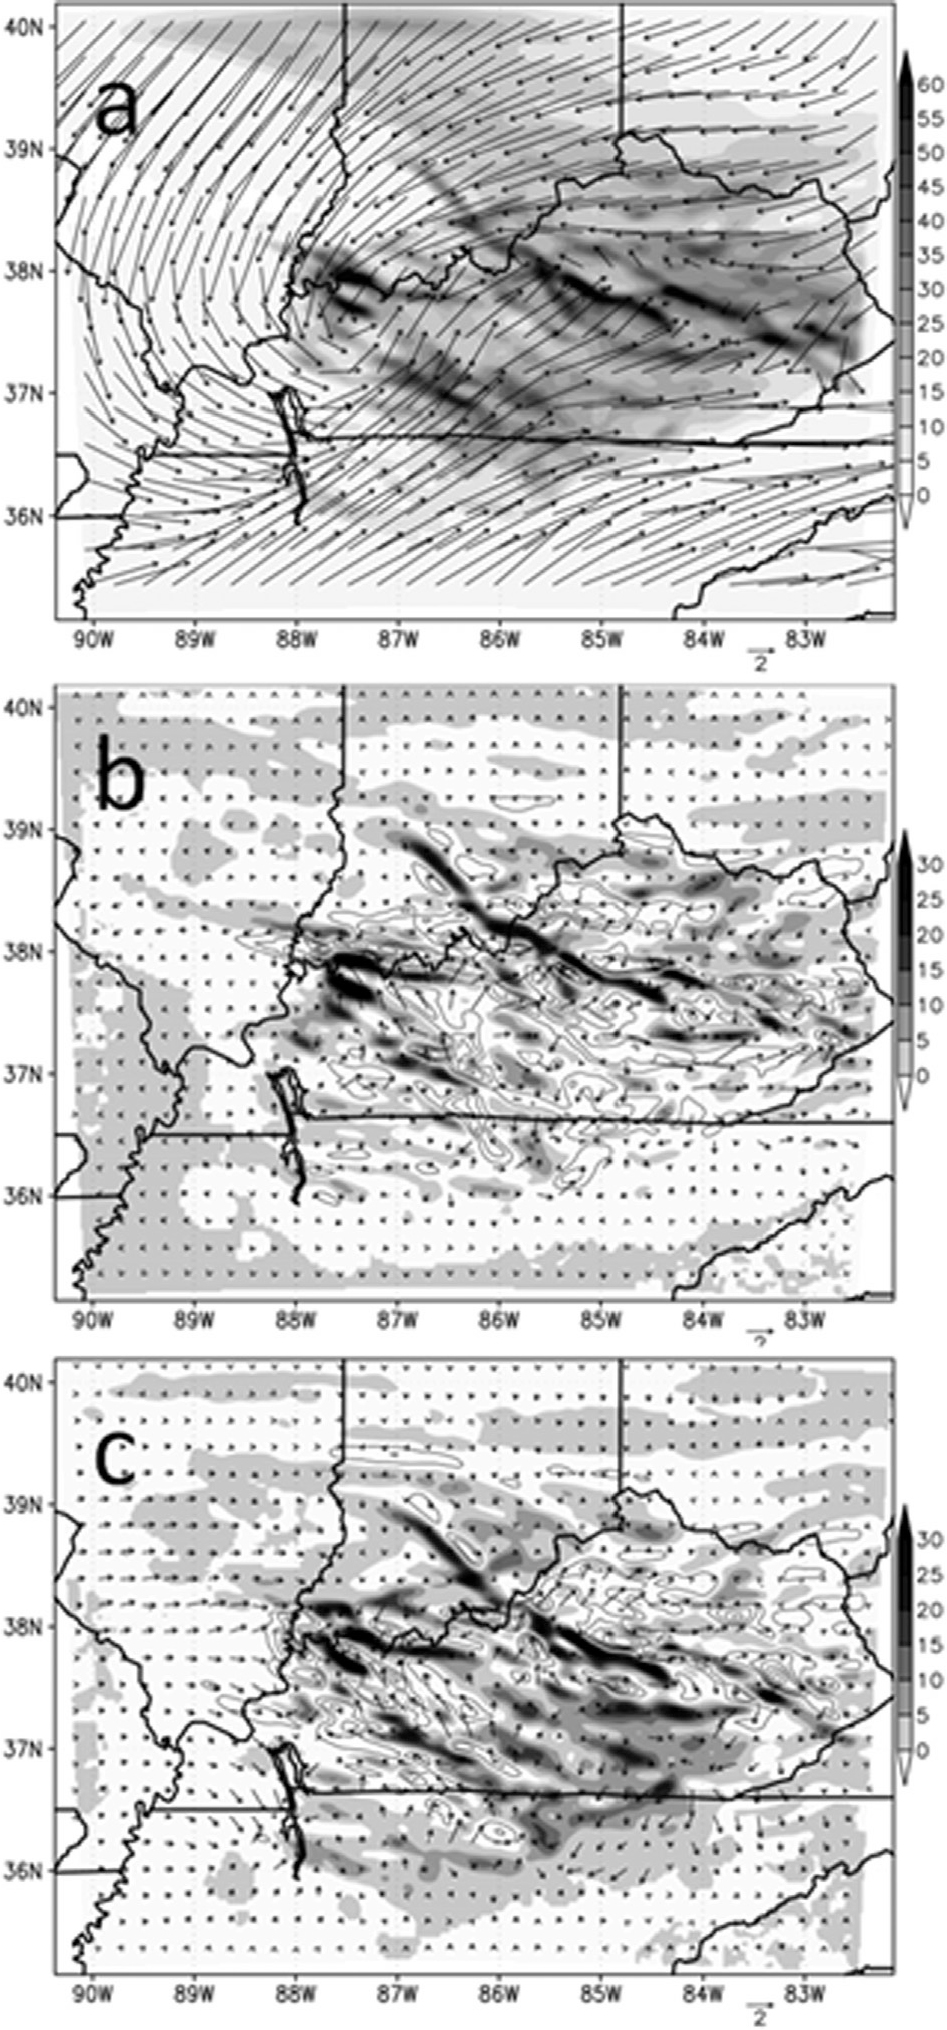
Fig. 3.
(a) Volumetric soil moisture (m3 m−3) for the CTRL run for the upper model layer (0–10 cm) on 12 June 0400 UTC; (b) CTRL minus the ensemble average of DRY runs and (c) for the CTRL minus the ensemble average of WET run.
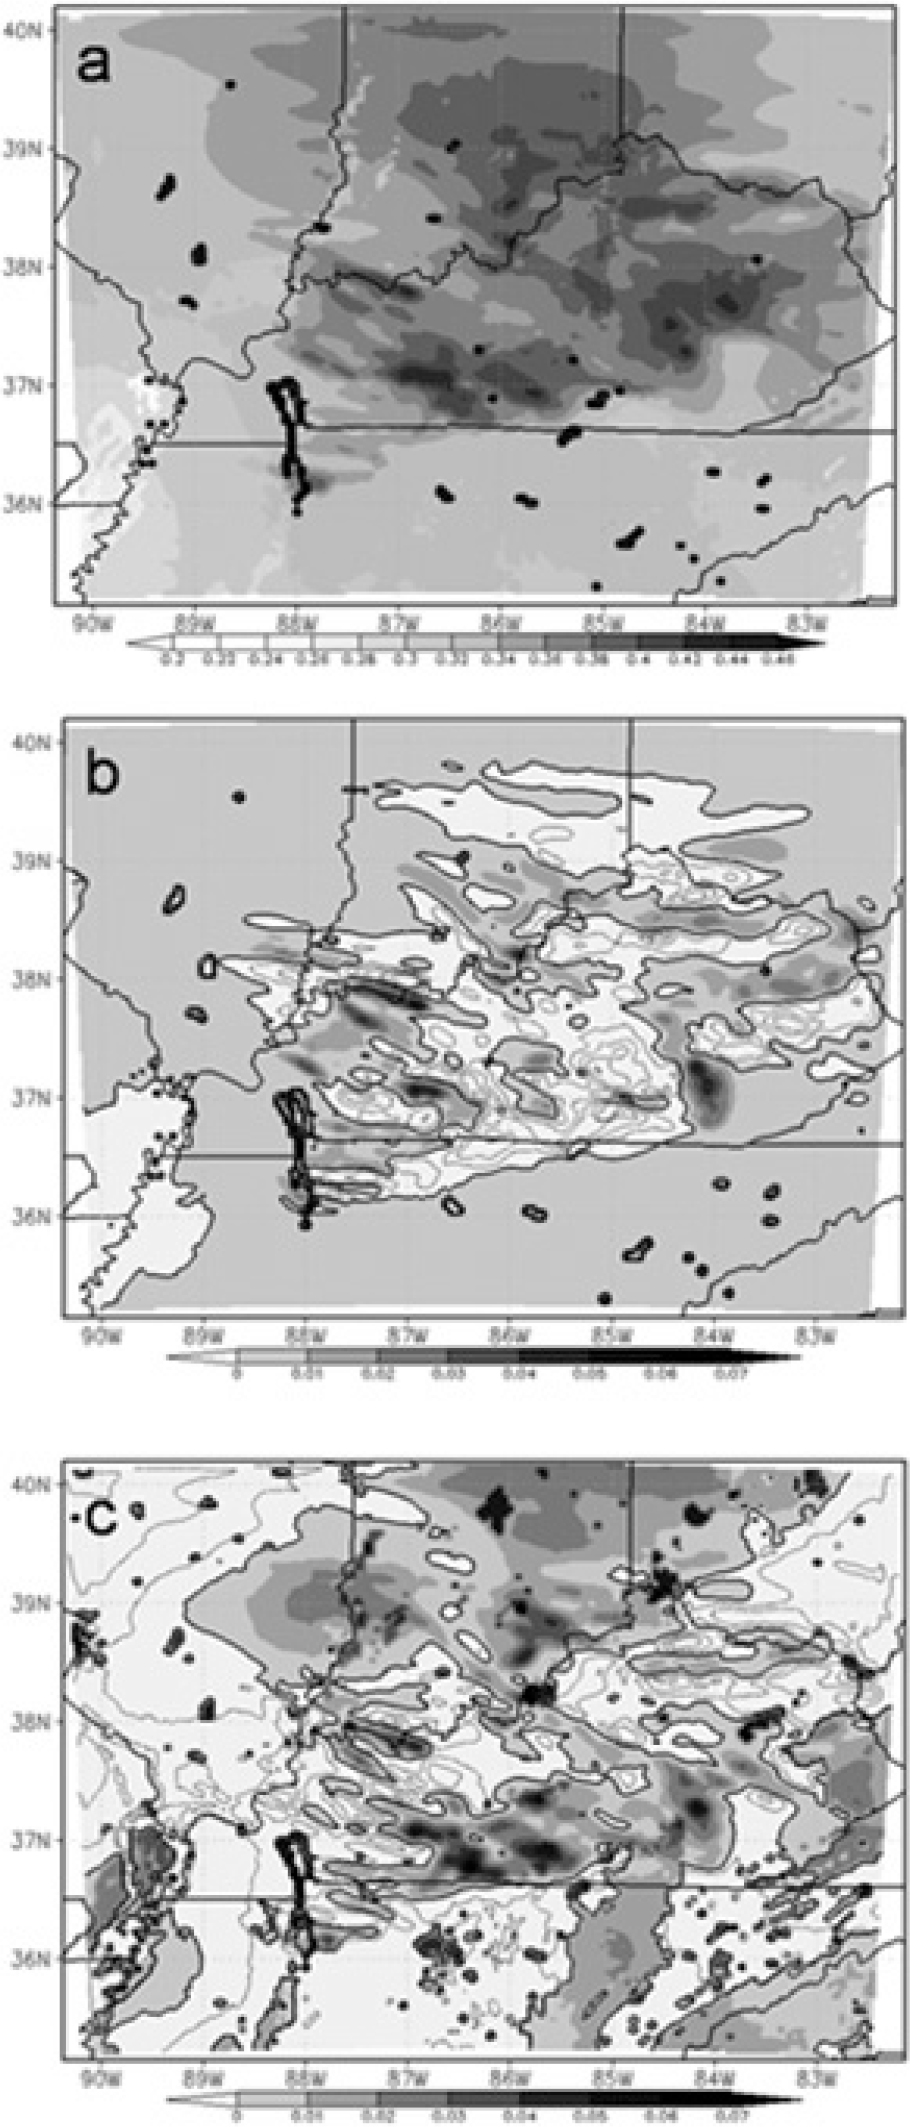
Fig. 4.
(a) Time series for RMSD' between CTRL and DRY ensemble (thin line and cross symbol), CTRL and WET ensemble (thin line and square symbol), CTRL and ENS (thick line and triangle symbol) for relative humidity at 960 hPa; (b) normalised bias B and (c) normalised standard deviation σ for 11–12 June 2006.
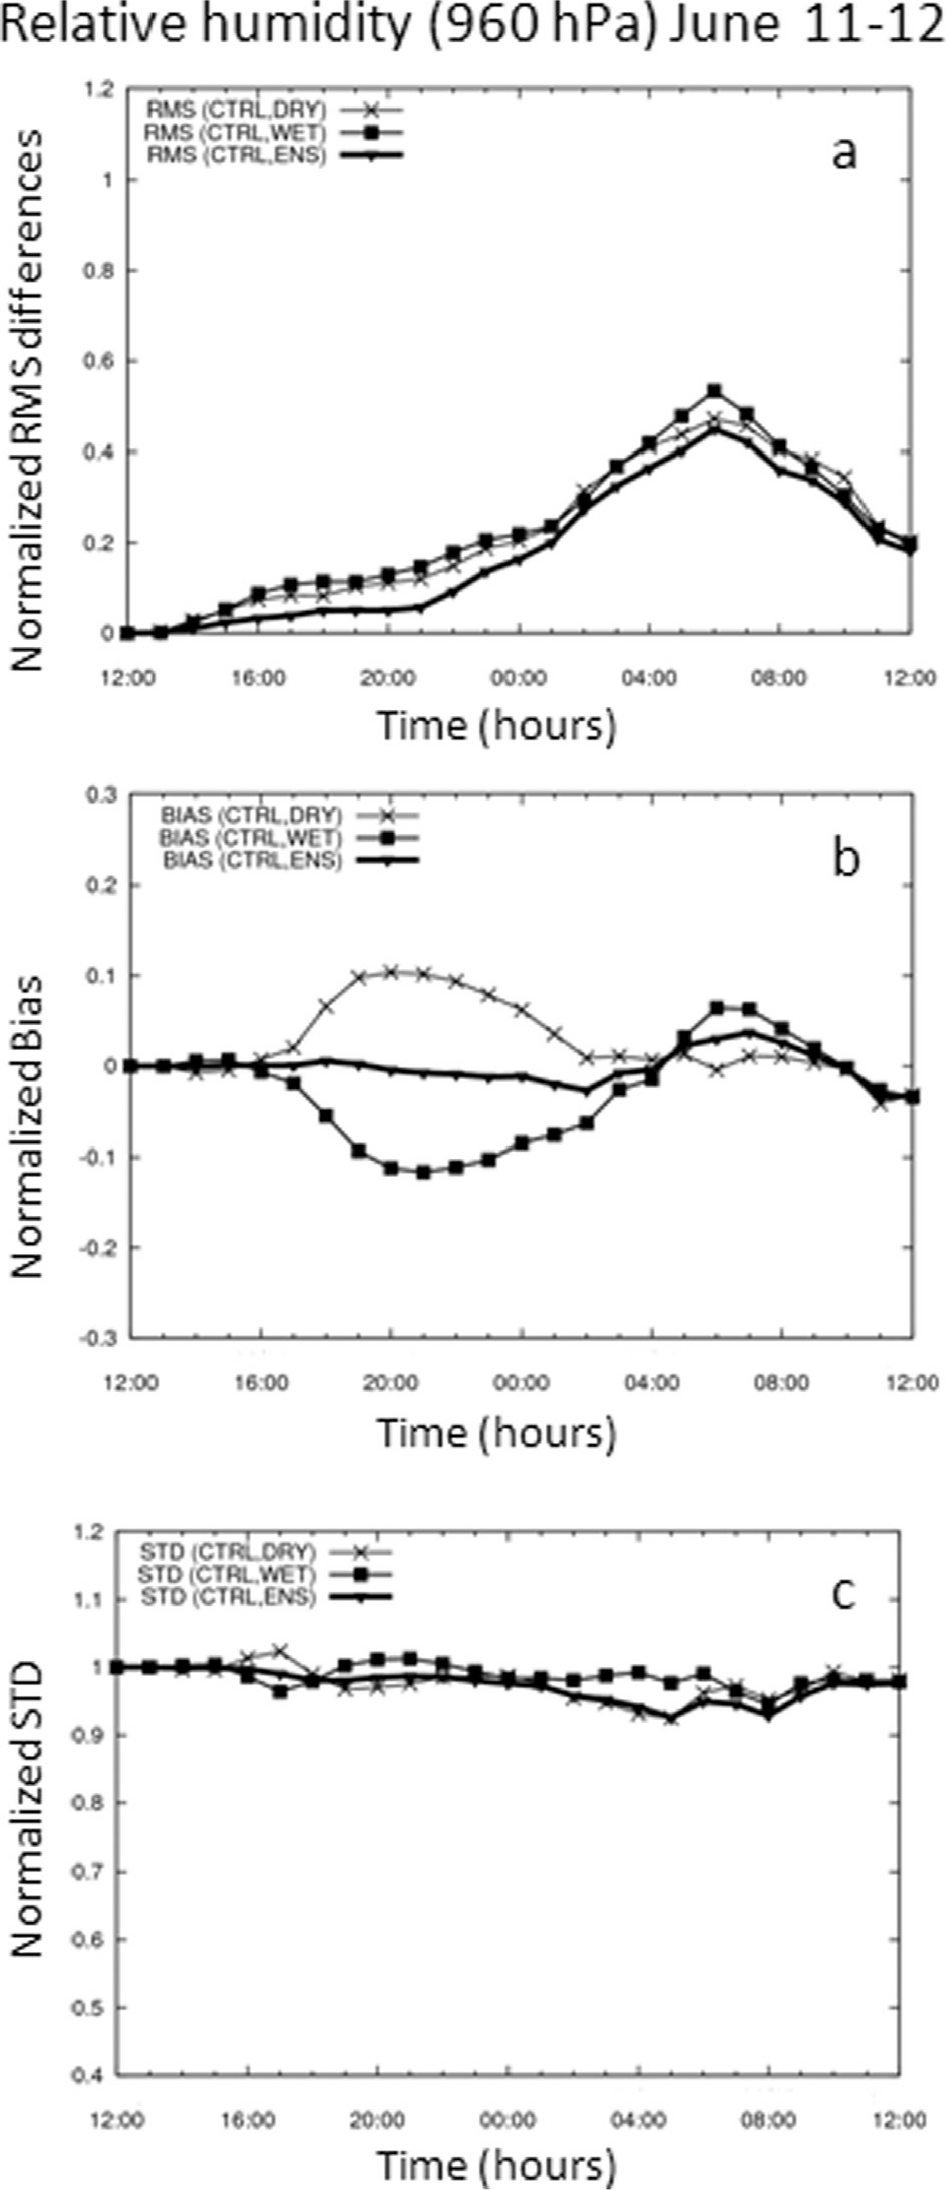
Fig. 5.
As in Fig. 4 but for temperature at 960 hPa.
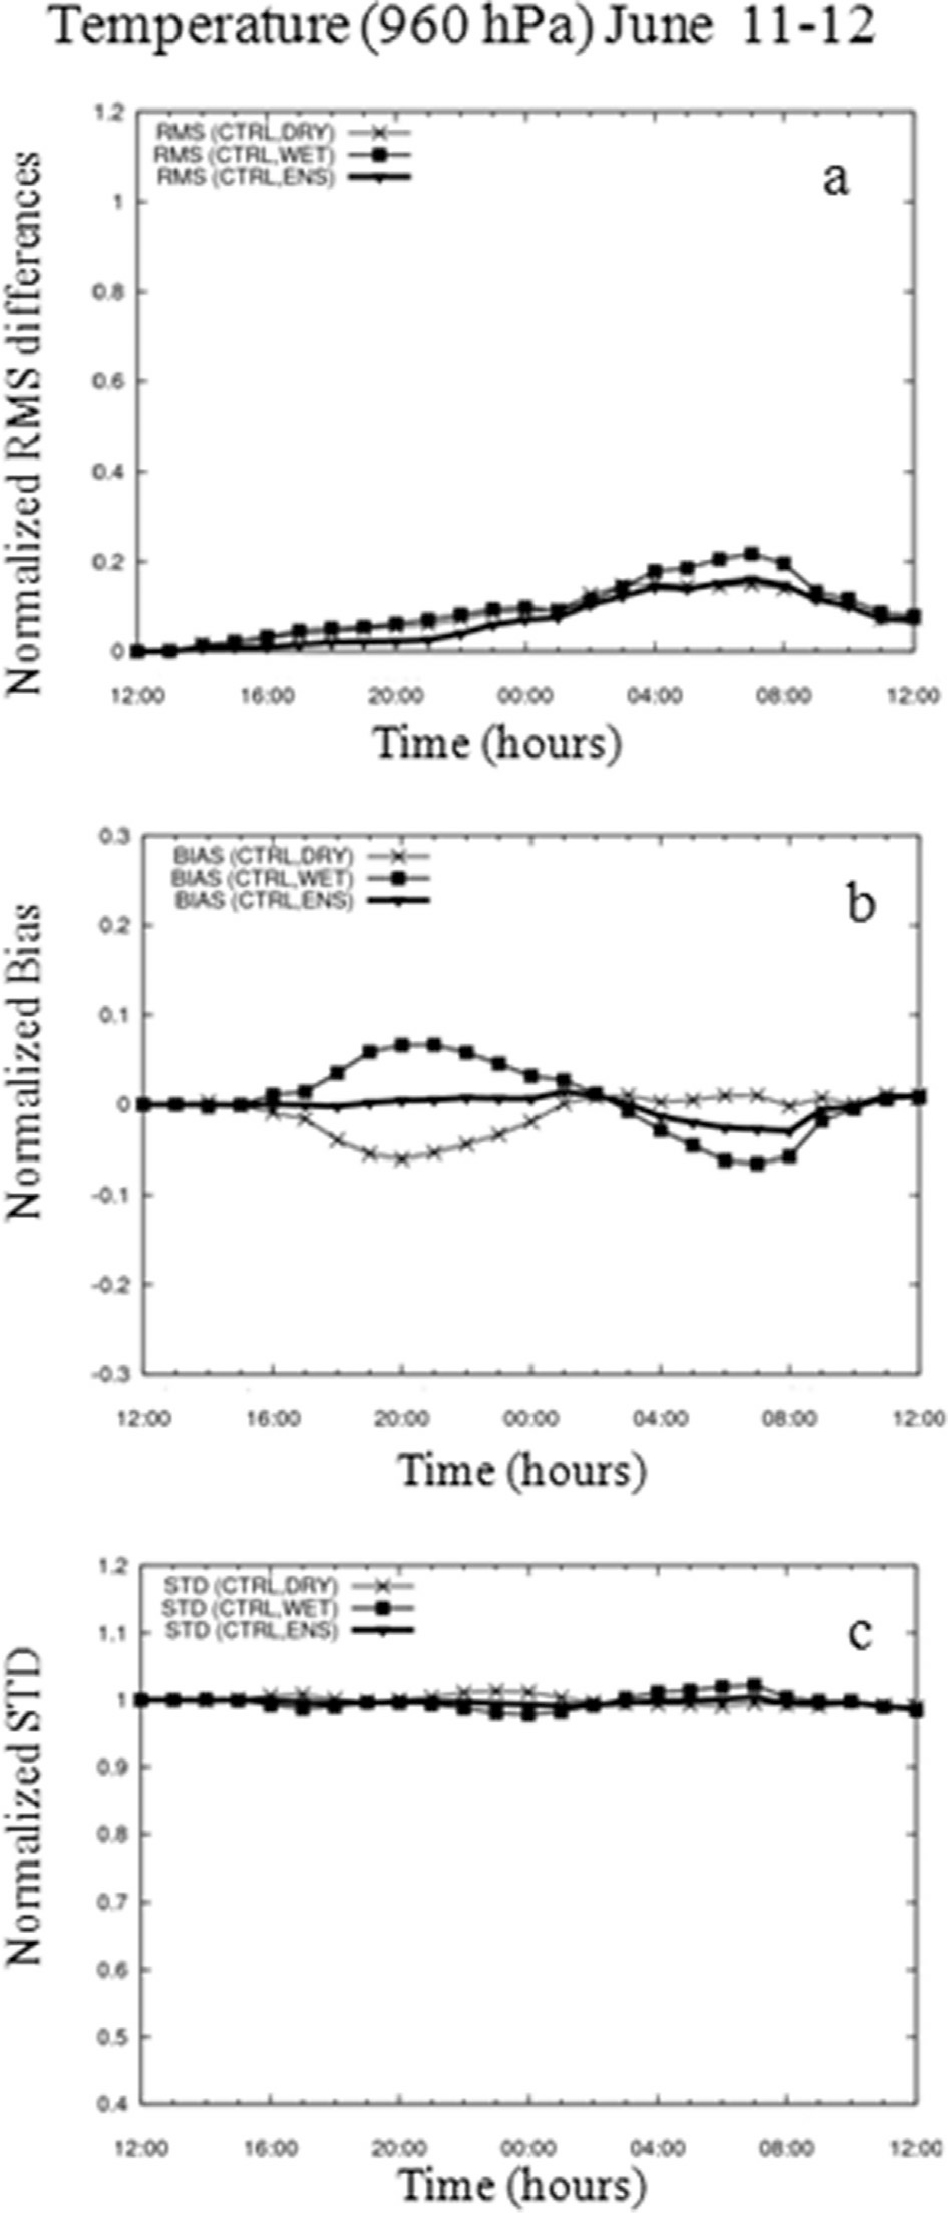
Fig. 6.
As in Fig. 4 but for vertical velocity at 960 hPa.
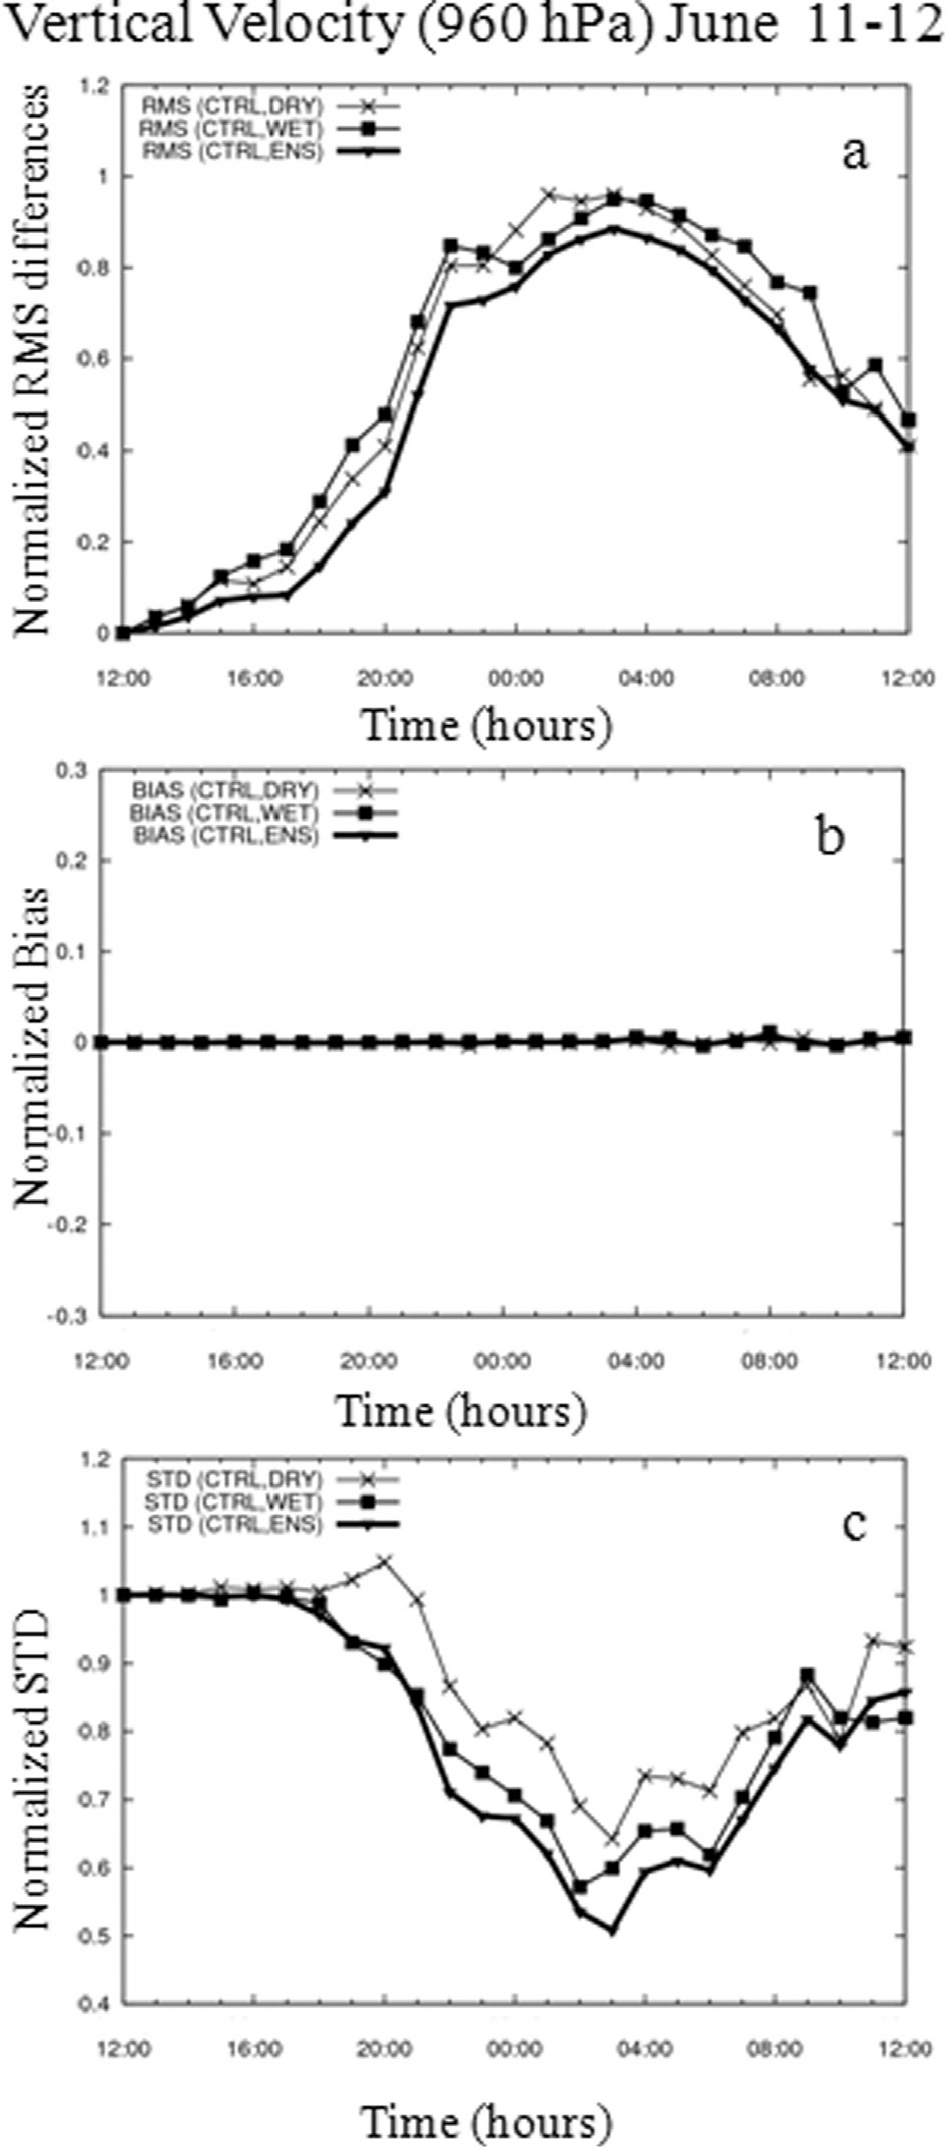
Fig. 7.
As in Fig. 2 (24-h accumulated precipitation and wind) but for the period of 22 June 1200 UTC through 23 June 1200 UTC.
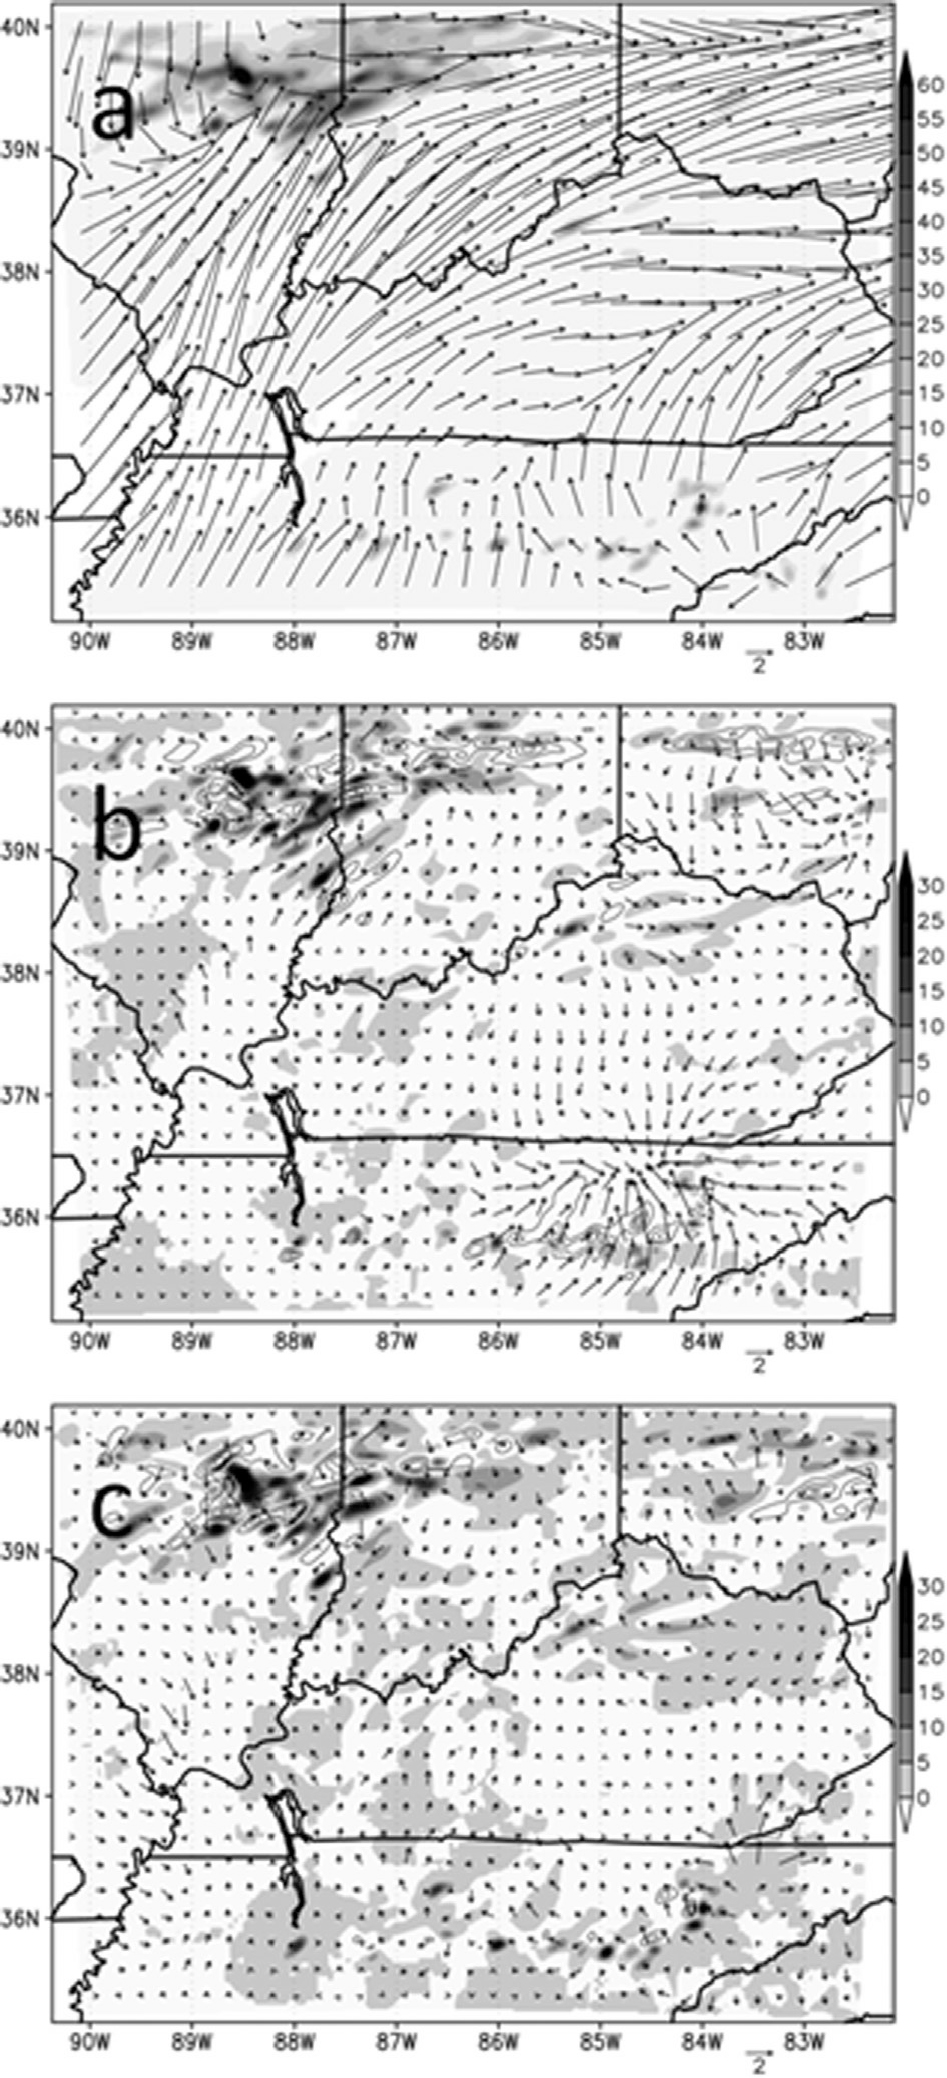
Fig. 8.
As in Fig. 3 but for 23 June 0400 UTC.
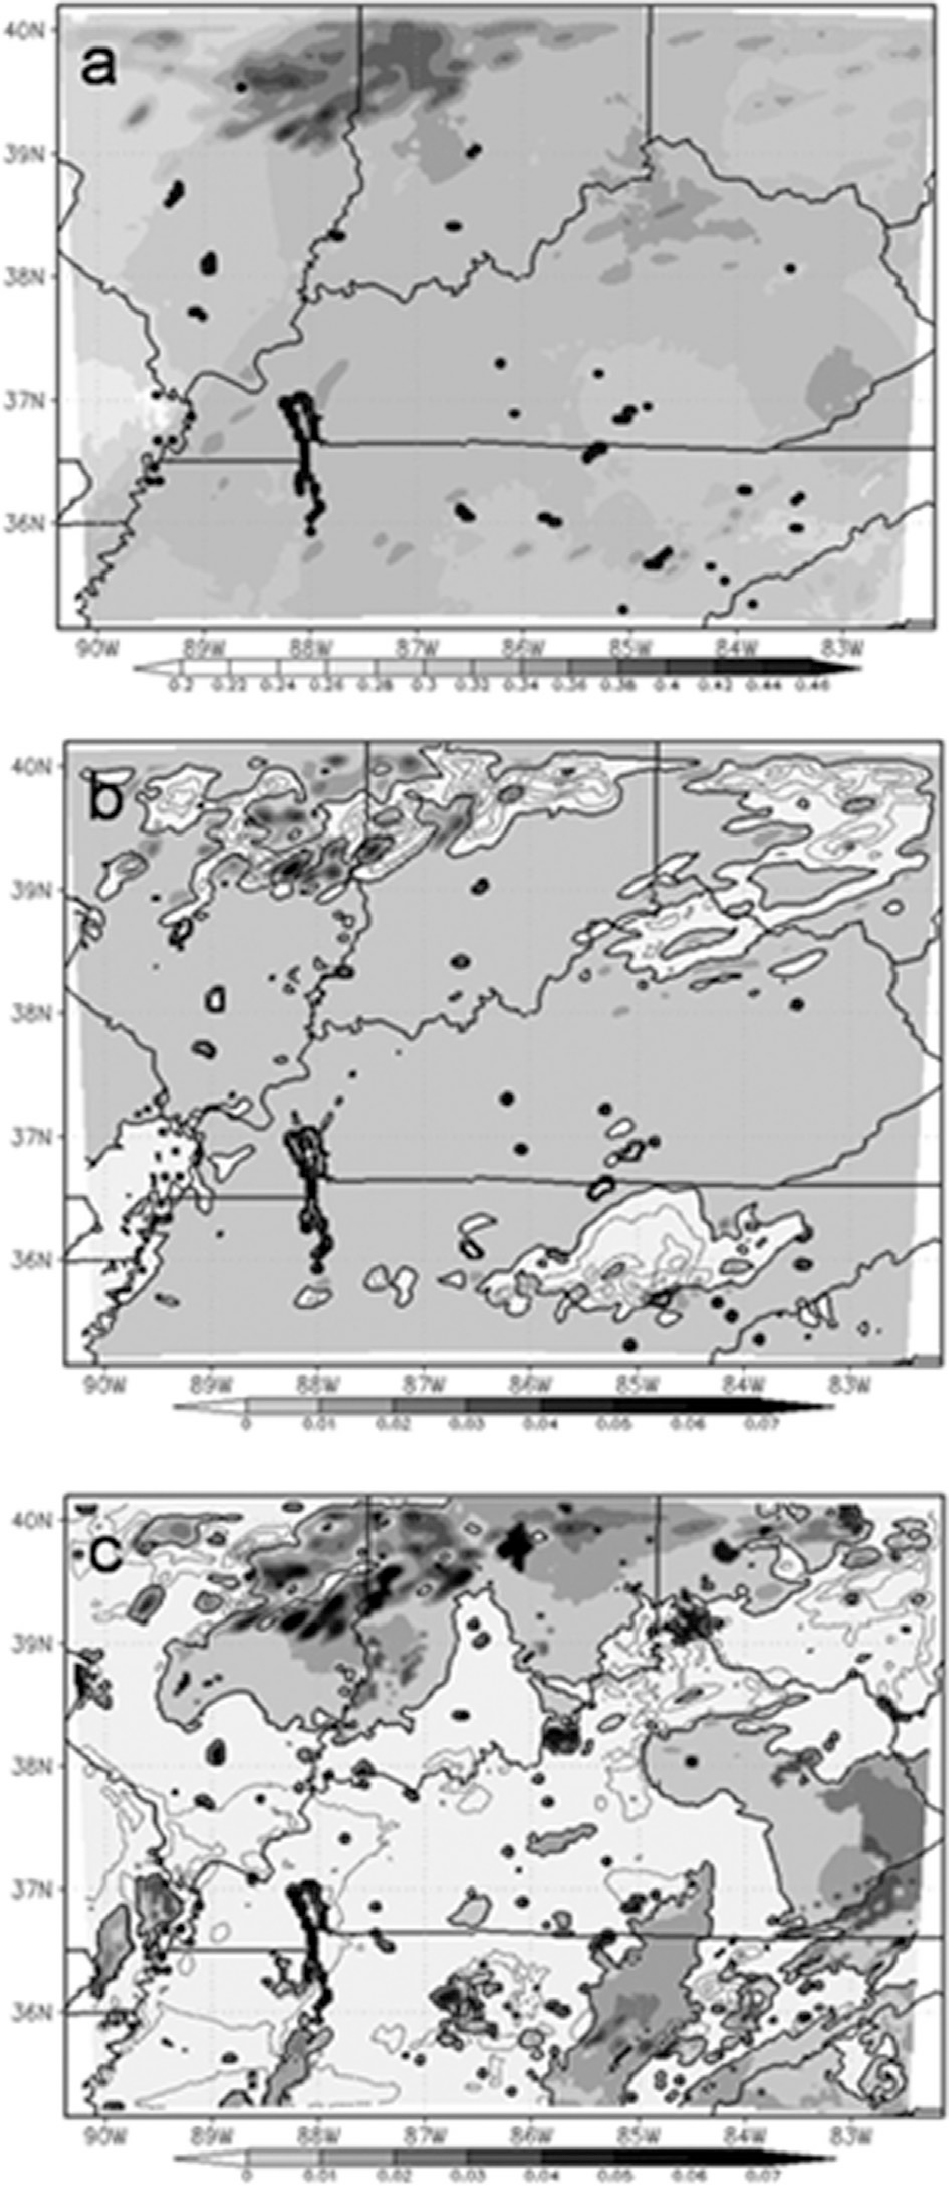
Fig. 9.
As in Fig. 4 but for relative humidity at 960 hPa for the period of 22 June 1200 UTC through 23 June 1200 UTC.
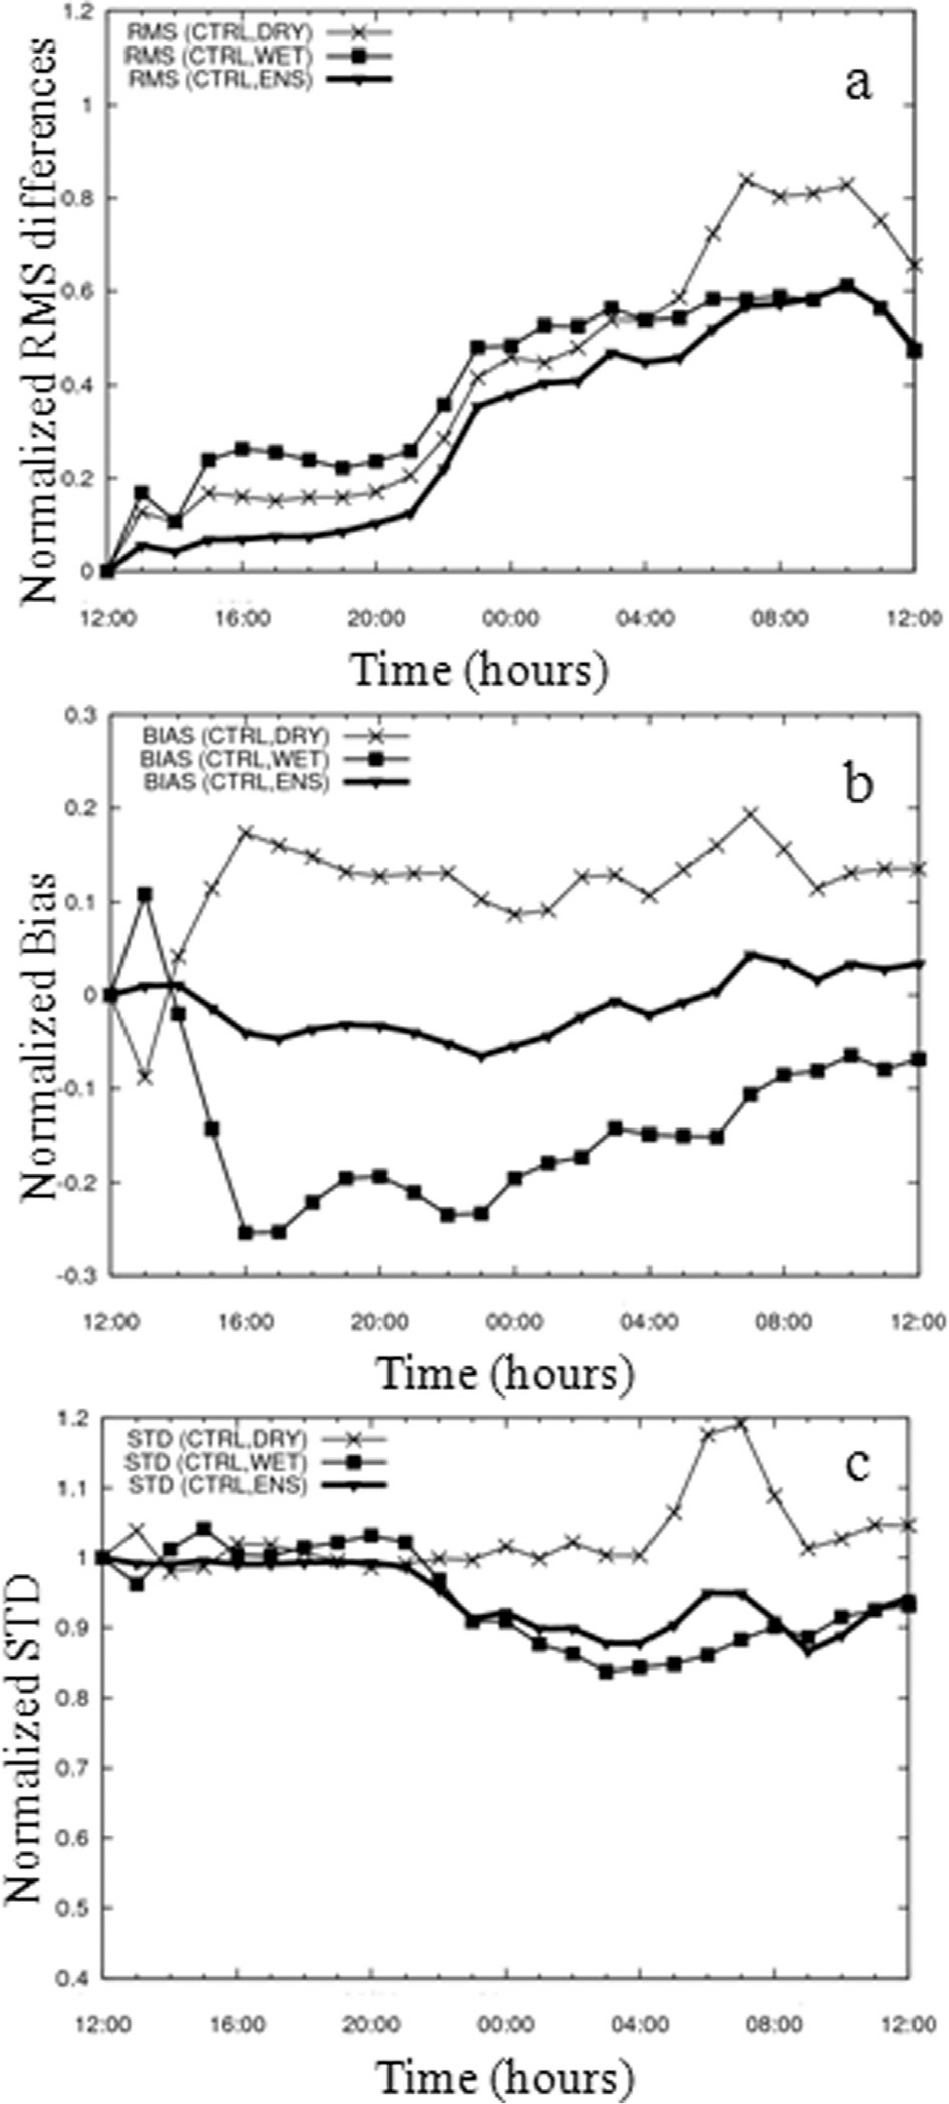
Fig. 10.
As in Fig. 4 but for temperature and for the period of 22 June 1200 UTC through 23 June 1200 UTC.
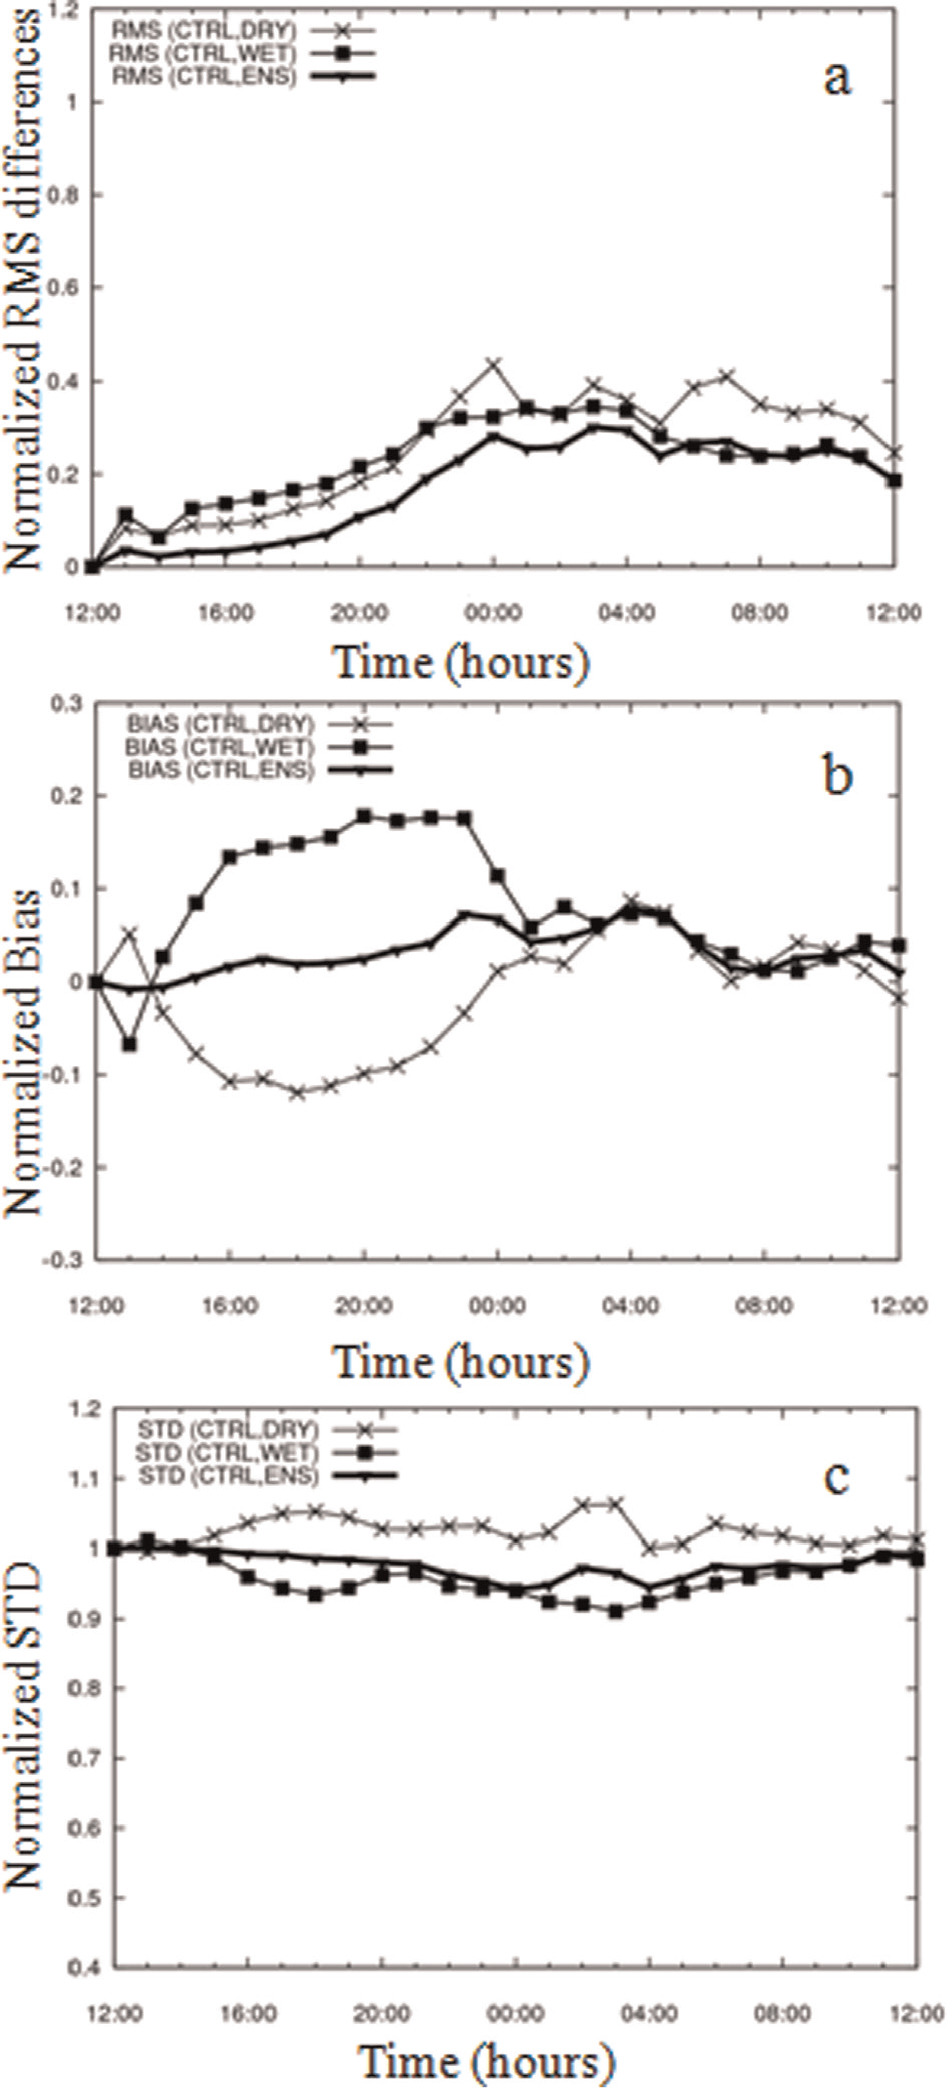
Fig. 11.
As in Fig. 4n but for vertical velocity and the period of 22 June 1200 UTC through 23 June 1200 UTC.
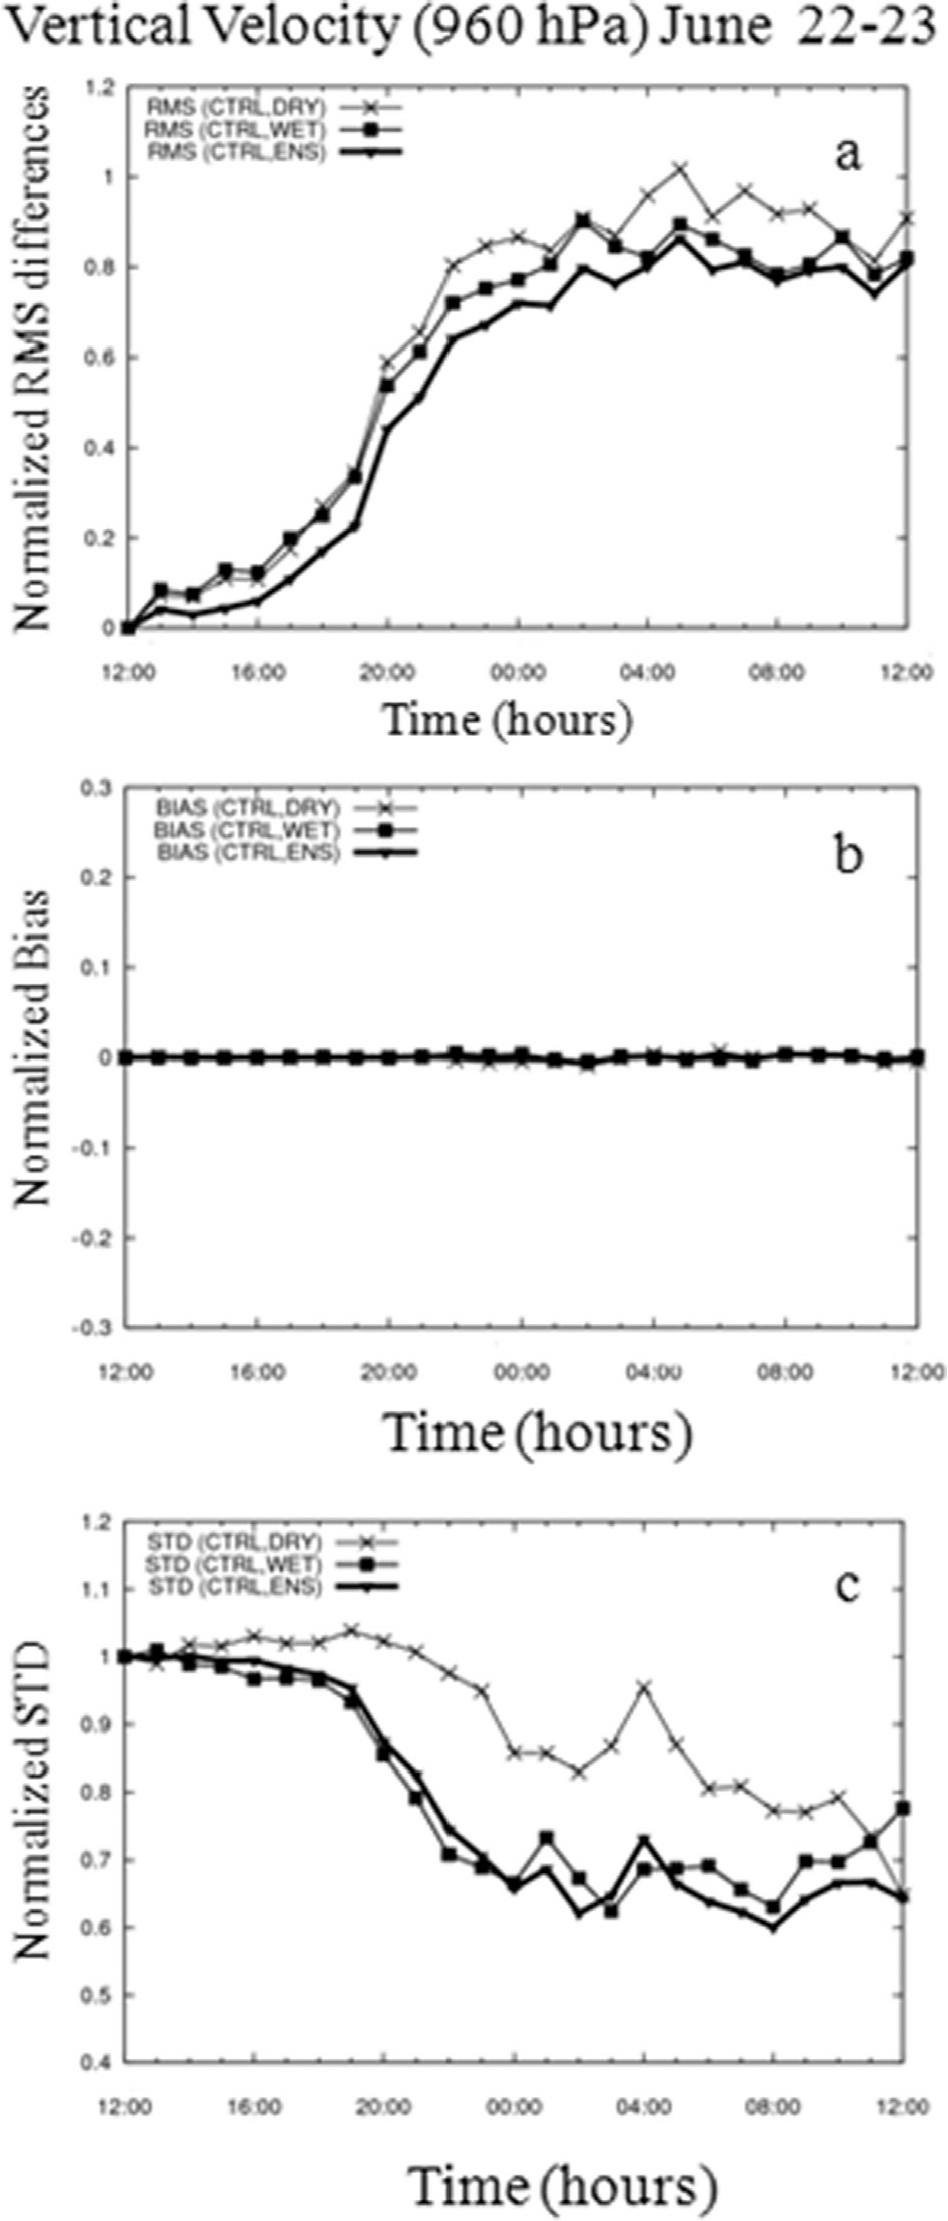
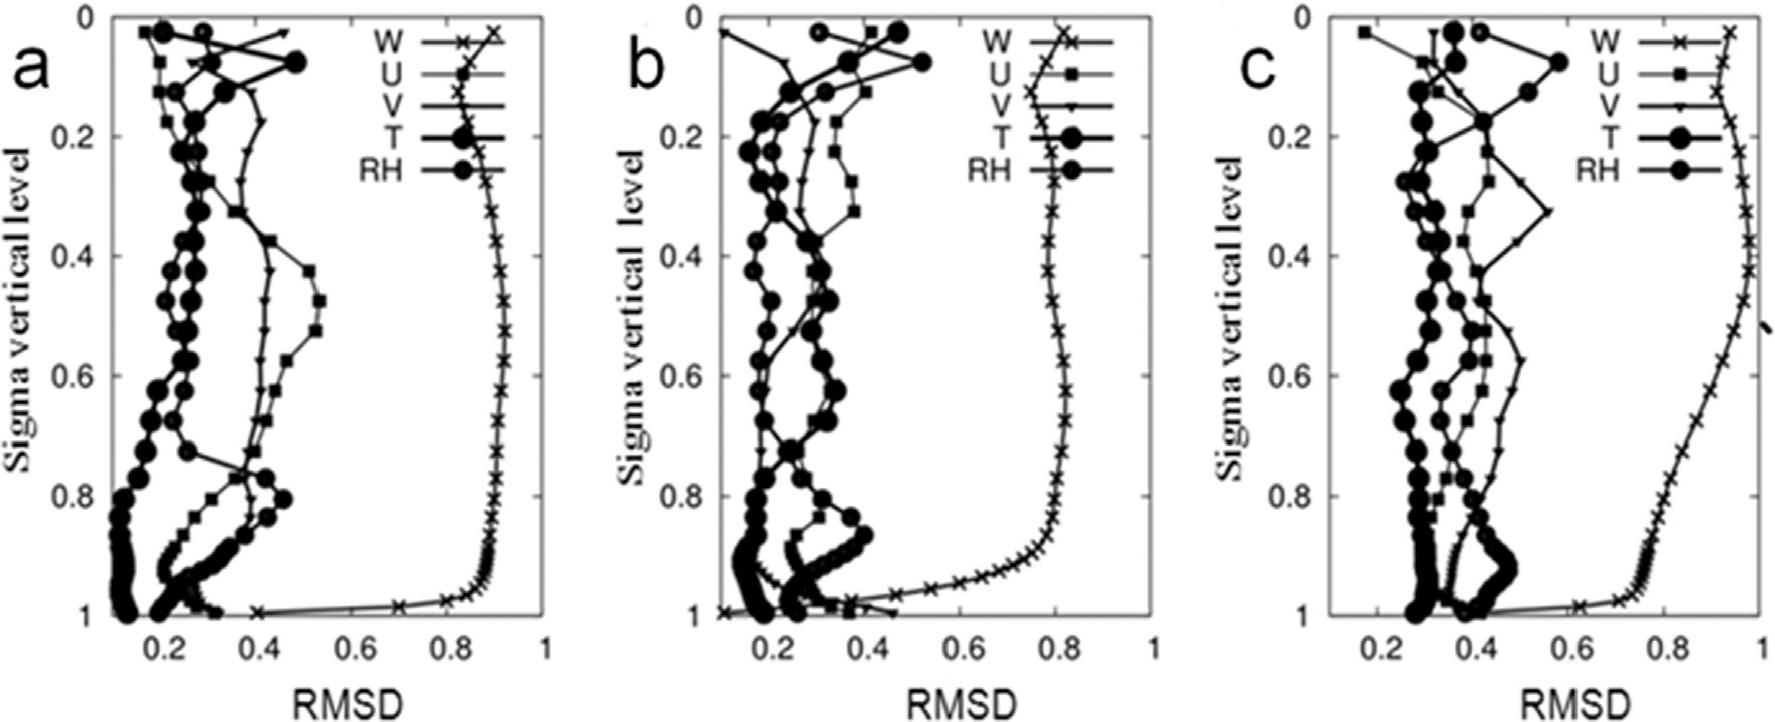
Fig. 12.
RMSD′ as function of the model vertical coordinate (sigma) for (a) 11 June 0400 UTC; (b) 17 June 0400 UTC and (c) 22 June 0400 UTC. Variables correspond to vertical velocity (W), zonal wind component (U), meridional wind component (V), temperature (T) and relative humidity (RH).