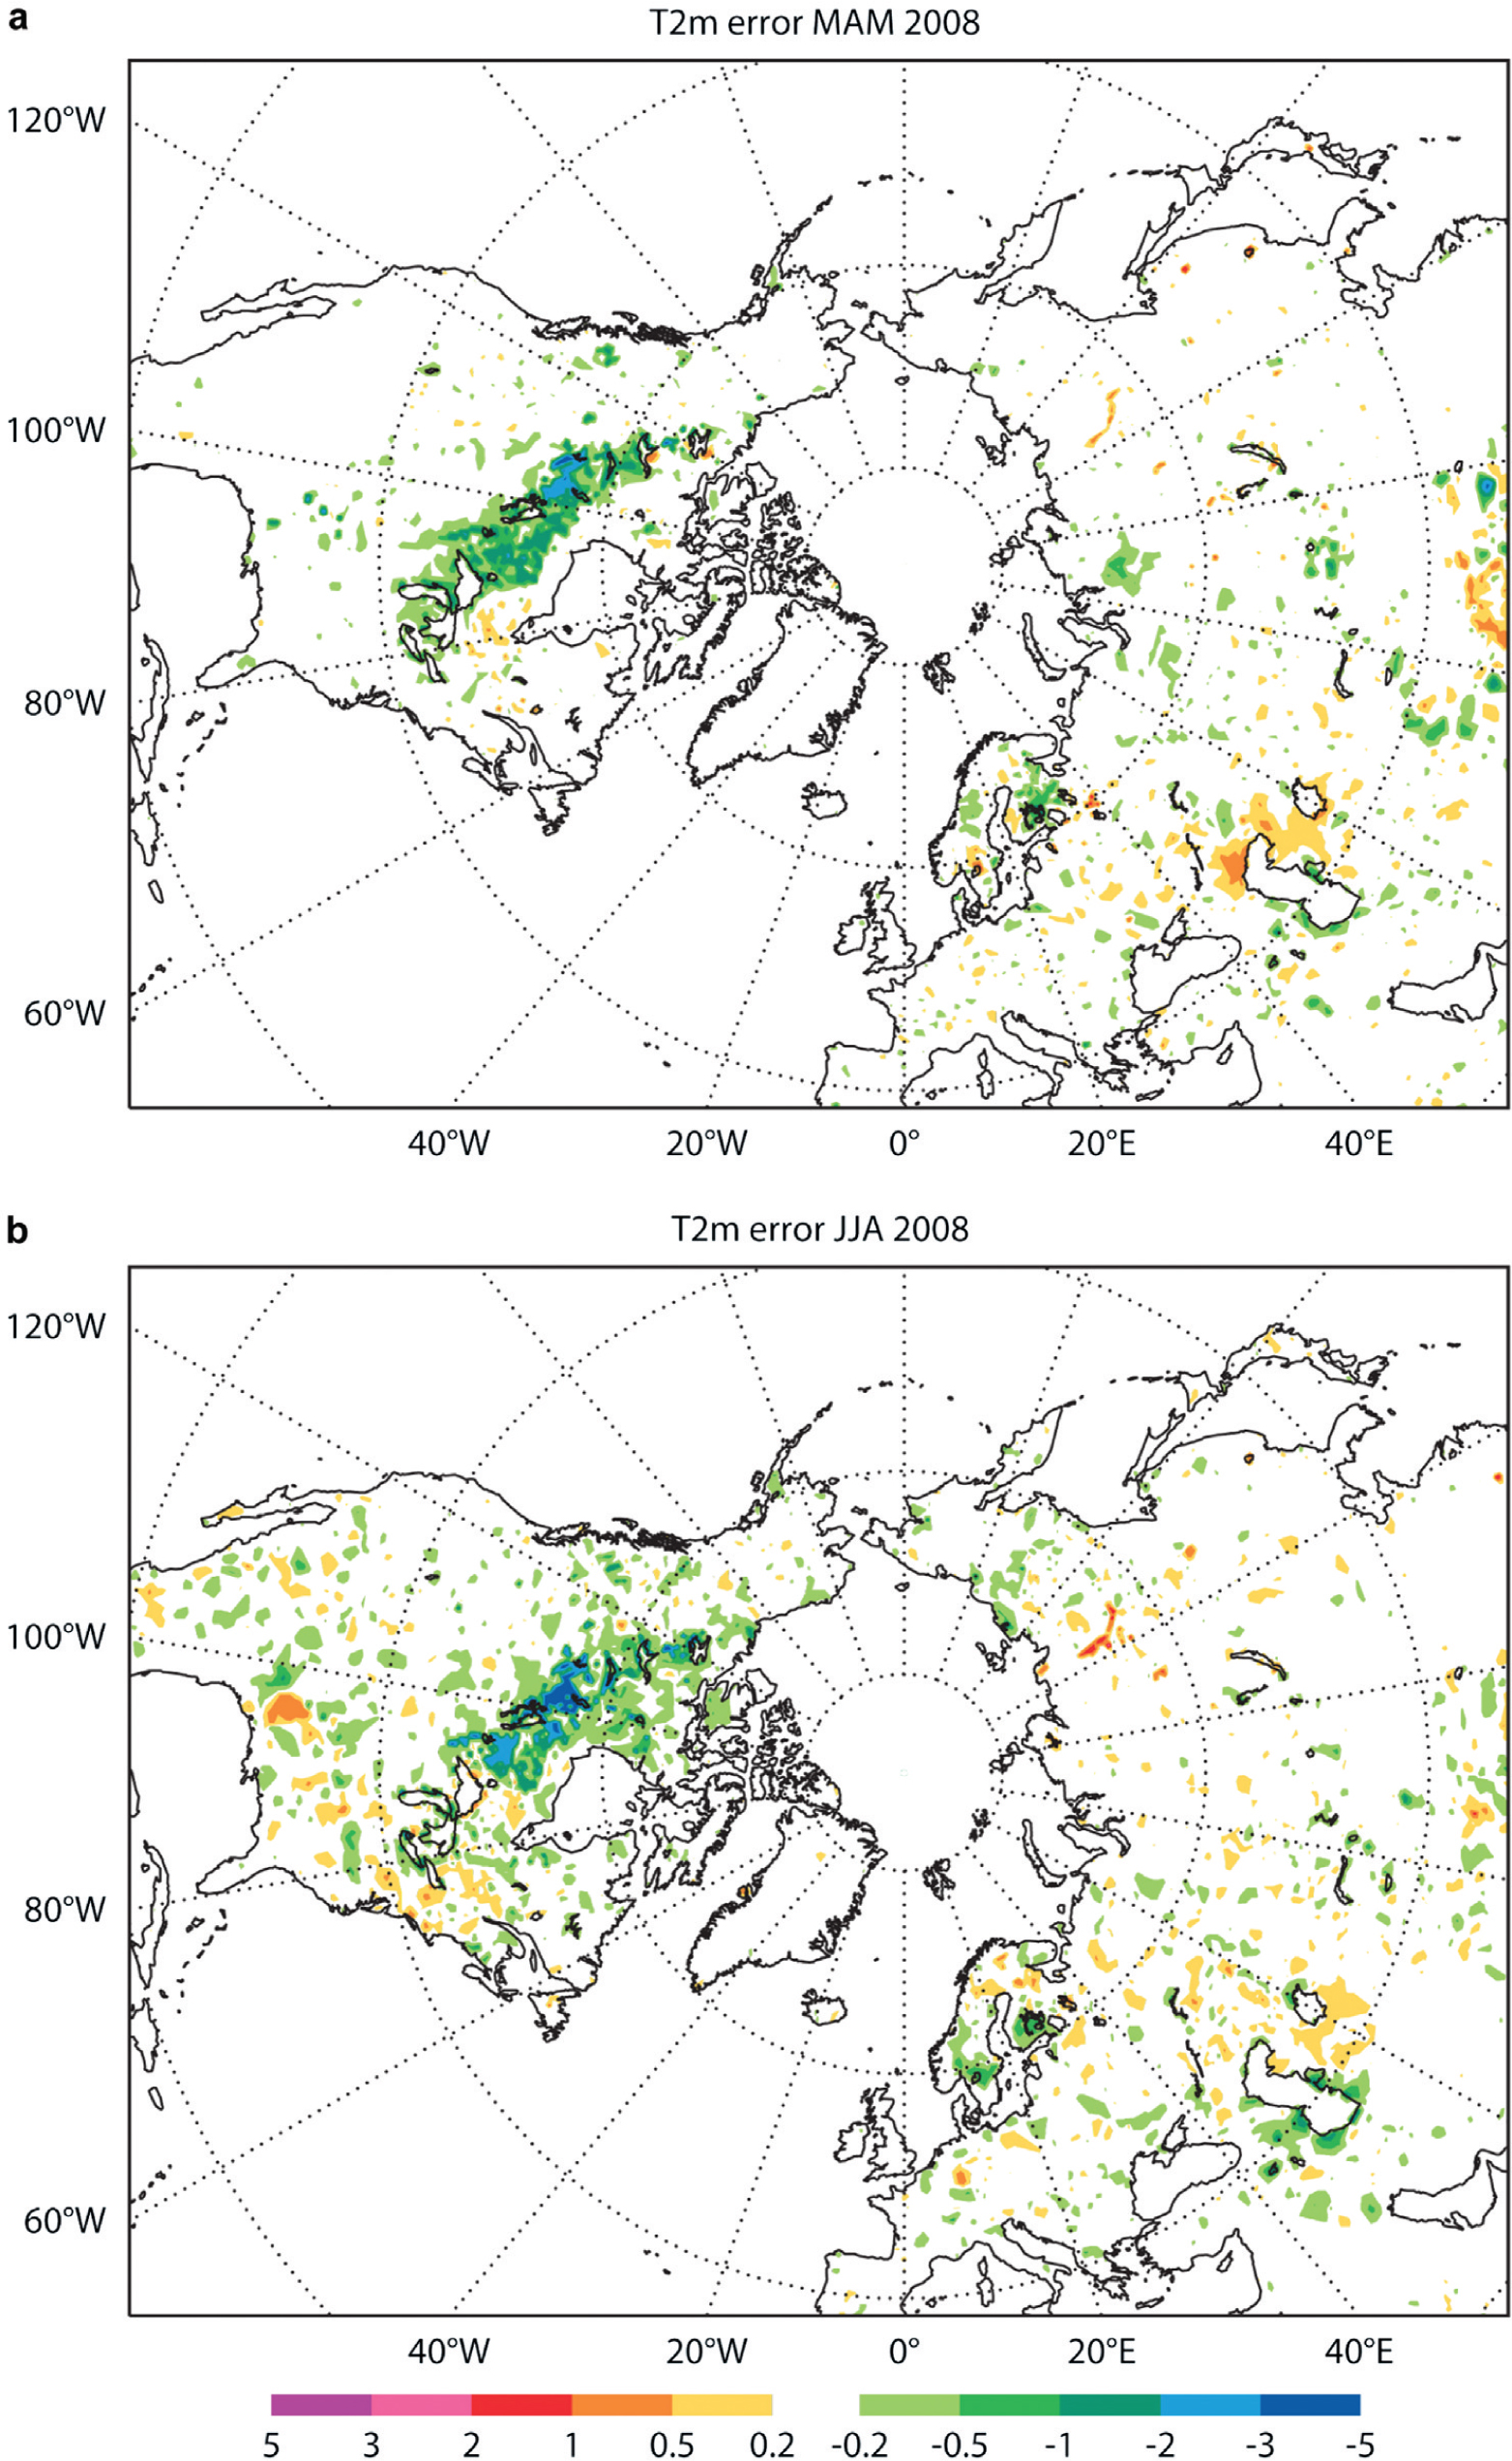
Fig. 1.
Lake cover fraction as provided by the GLCC land-cover map.

Fig. 2.
Global lake and oceans bathymetry (merged product described in the text).
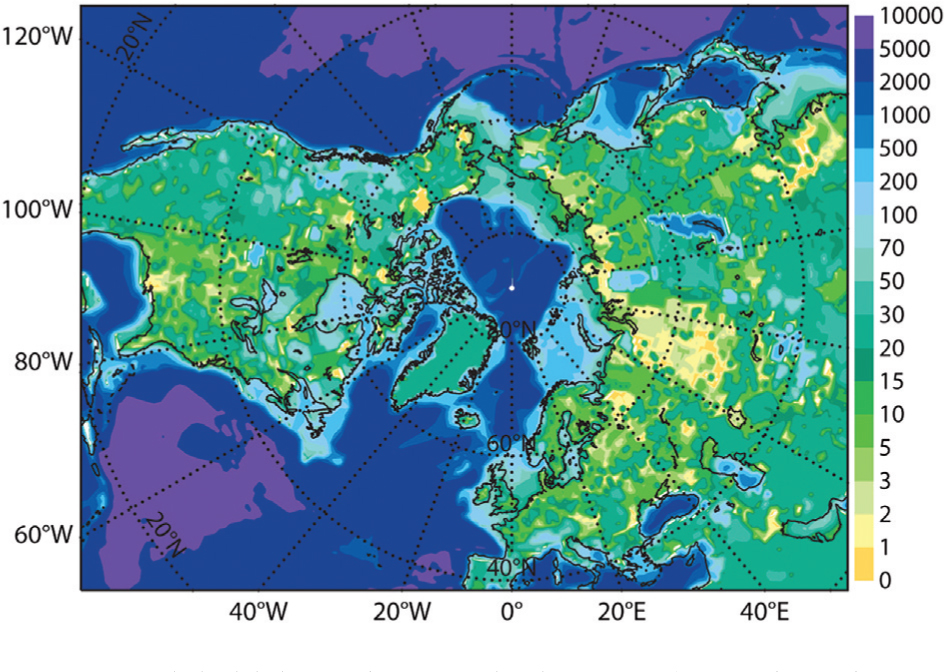
Fig. 3.
Climatological lake mixed-layer temperature [in K] in (a) winter (DJF), (b) spring (MAM), (c) summer (JJA), (d) autumn (SON) seasons as generated by the lake-planet simulations (1989–2009).

Fig. 4.
As in Fig. 3 but lake ice depth [in m].
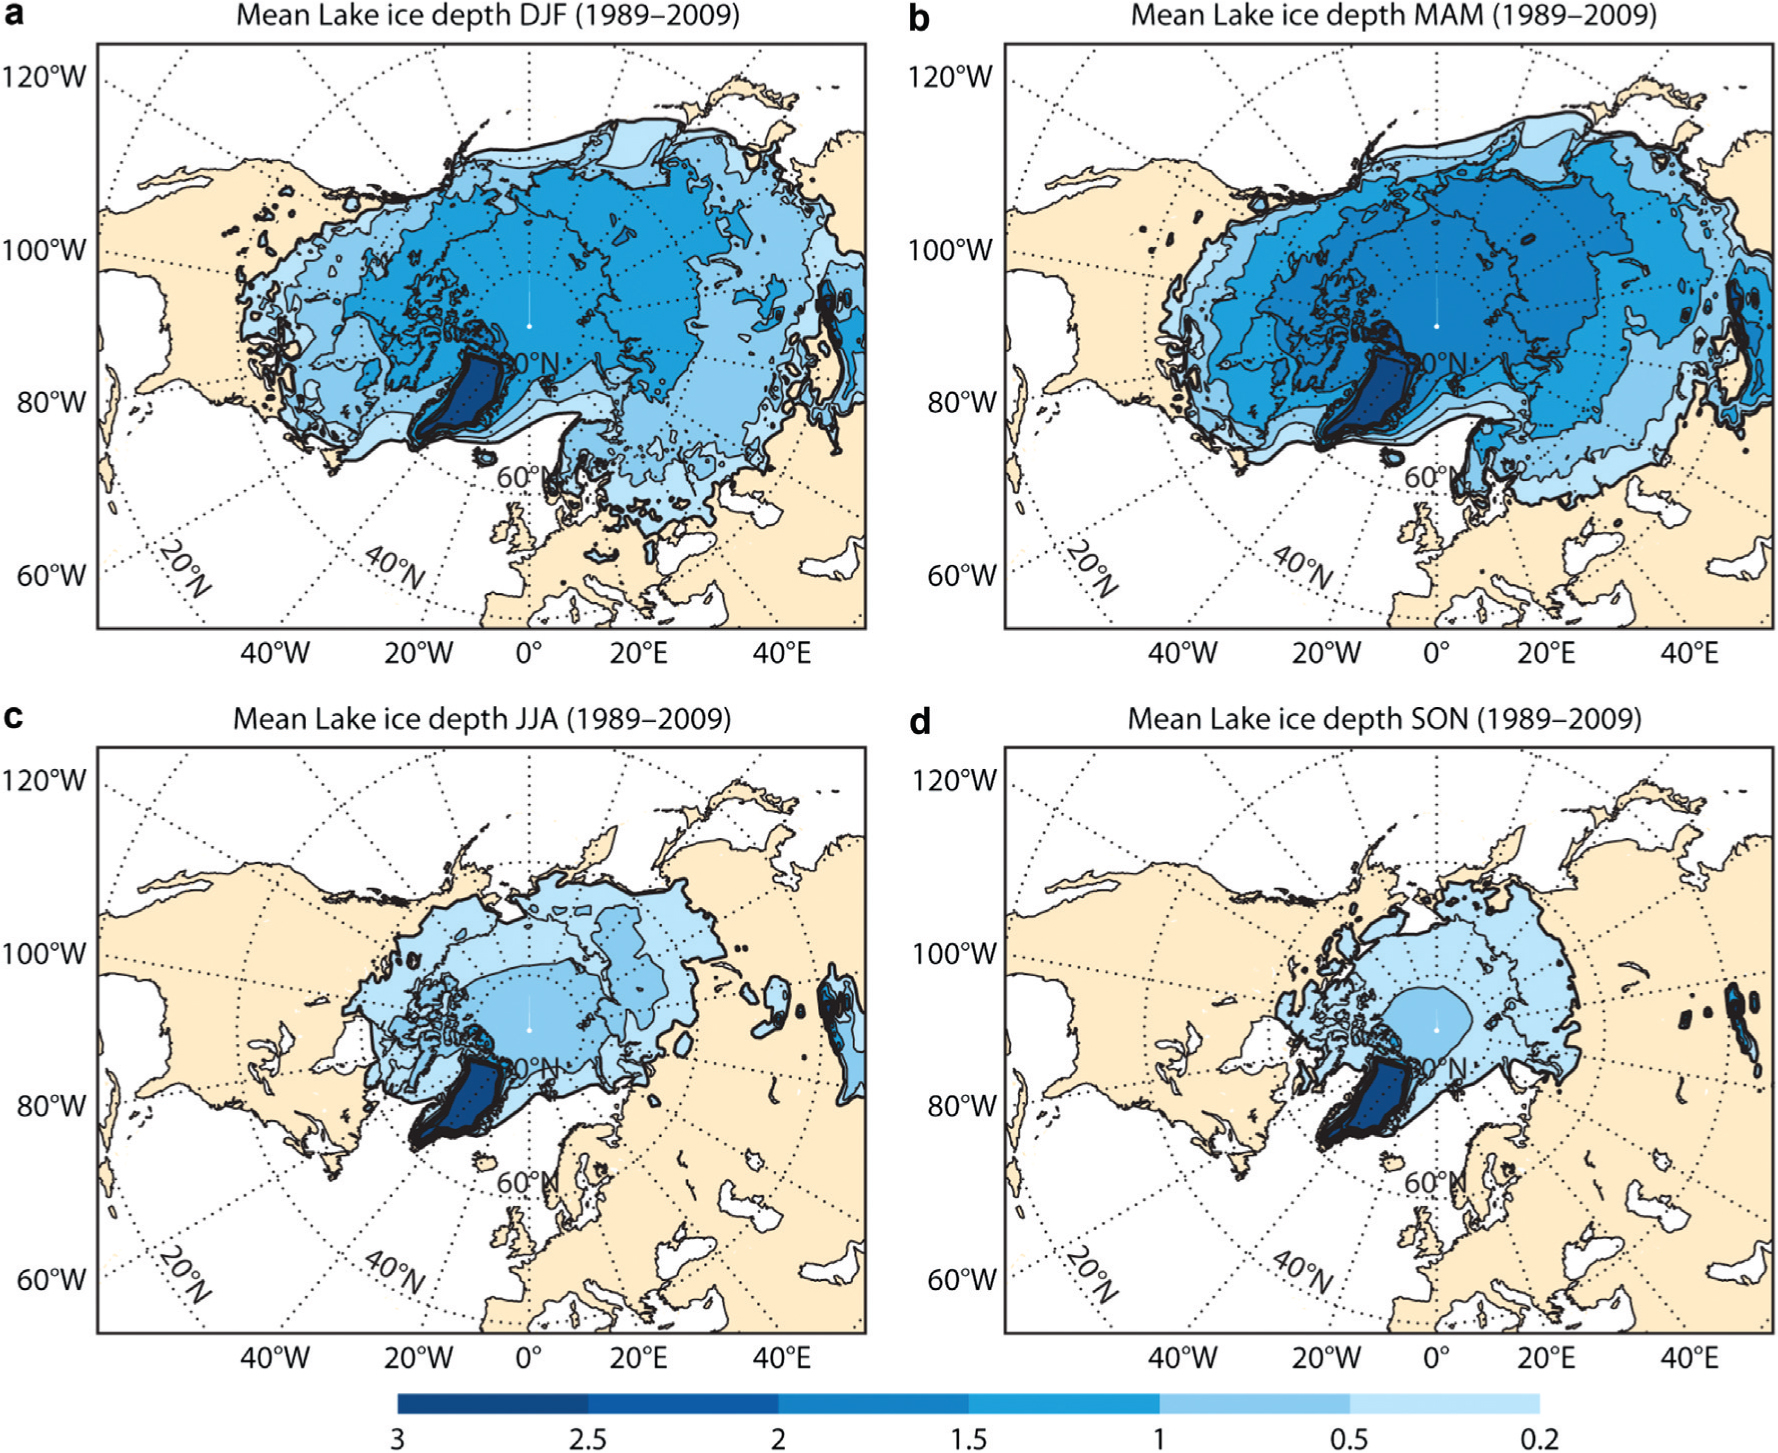
Fig. 5.
Comparison between the lake-planet mixed-layer temperature simulations and the MODIS LST during the period 2001–2008 over grid points where the model lake fraction is greater than 10%.

Fig. 6.
Comparison between the lake-planet ice simulation and IMS ice product: (a) ice formation day and (b) ice break-up day for three model ice-depth thresholds (1, 20 and 40 cm) are shown.
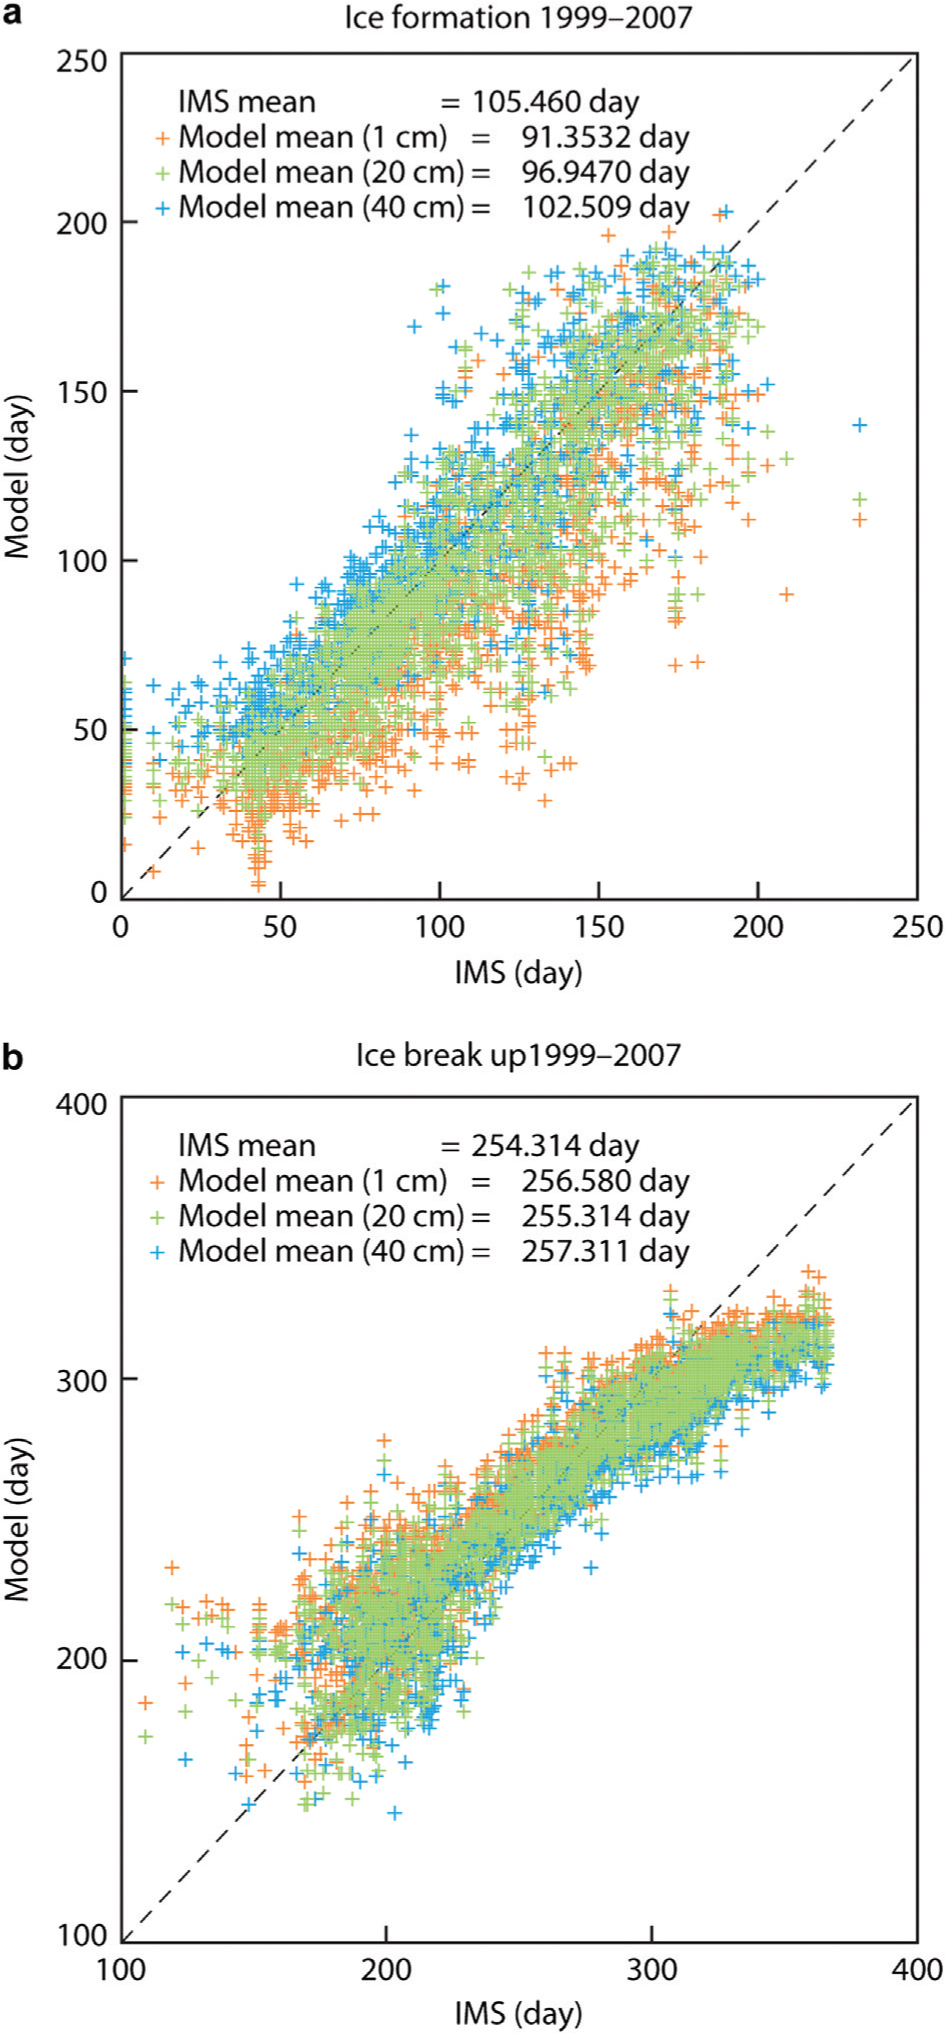
Fig. 7.
Sensitivity of 48-hour T2m forecasts (valid at 00 UTC) for LAKE compared with NOLAKE for (a) winter (DJF) and (b) autumn (SON). Negative values indicate cooling.
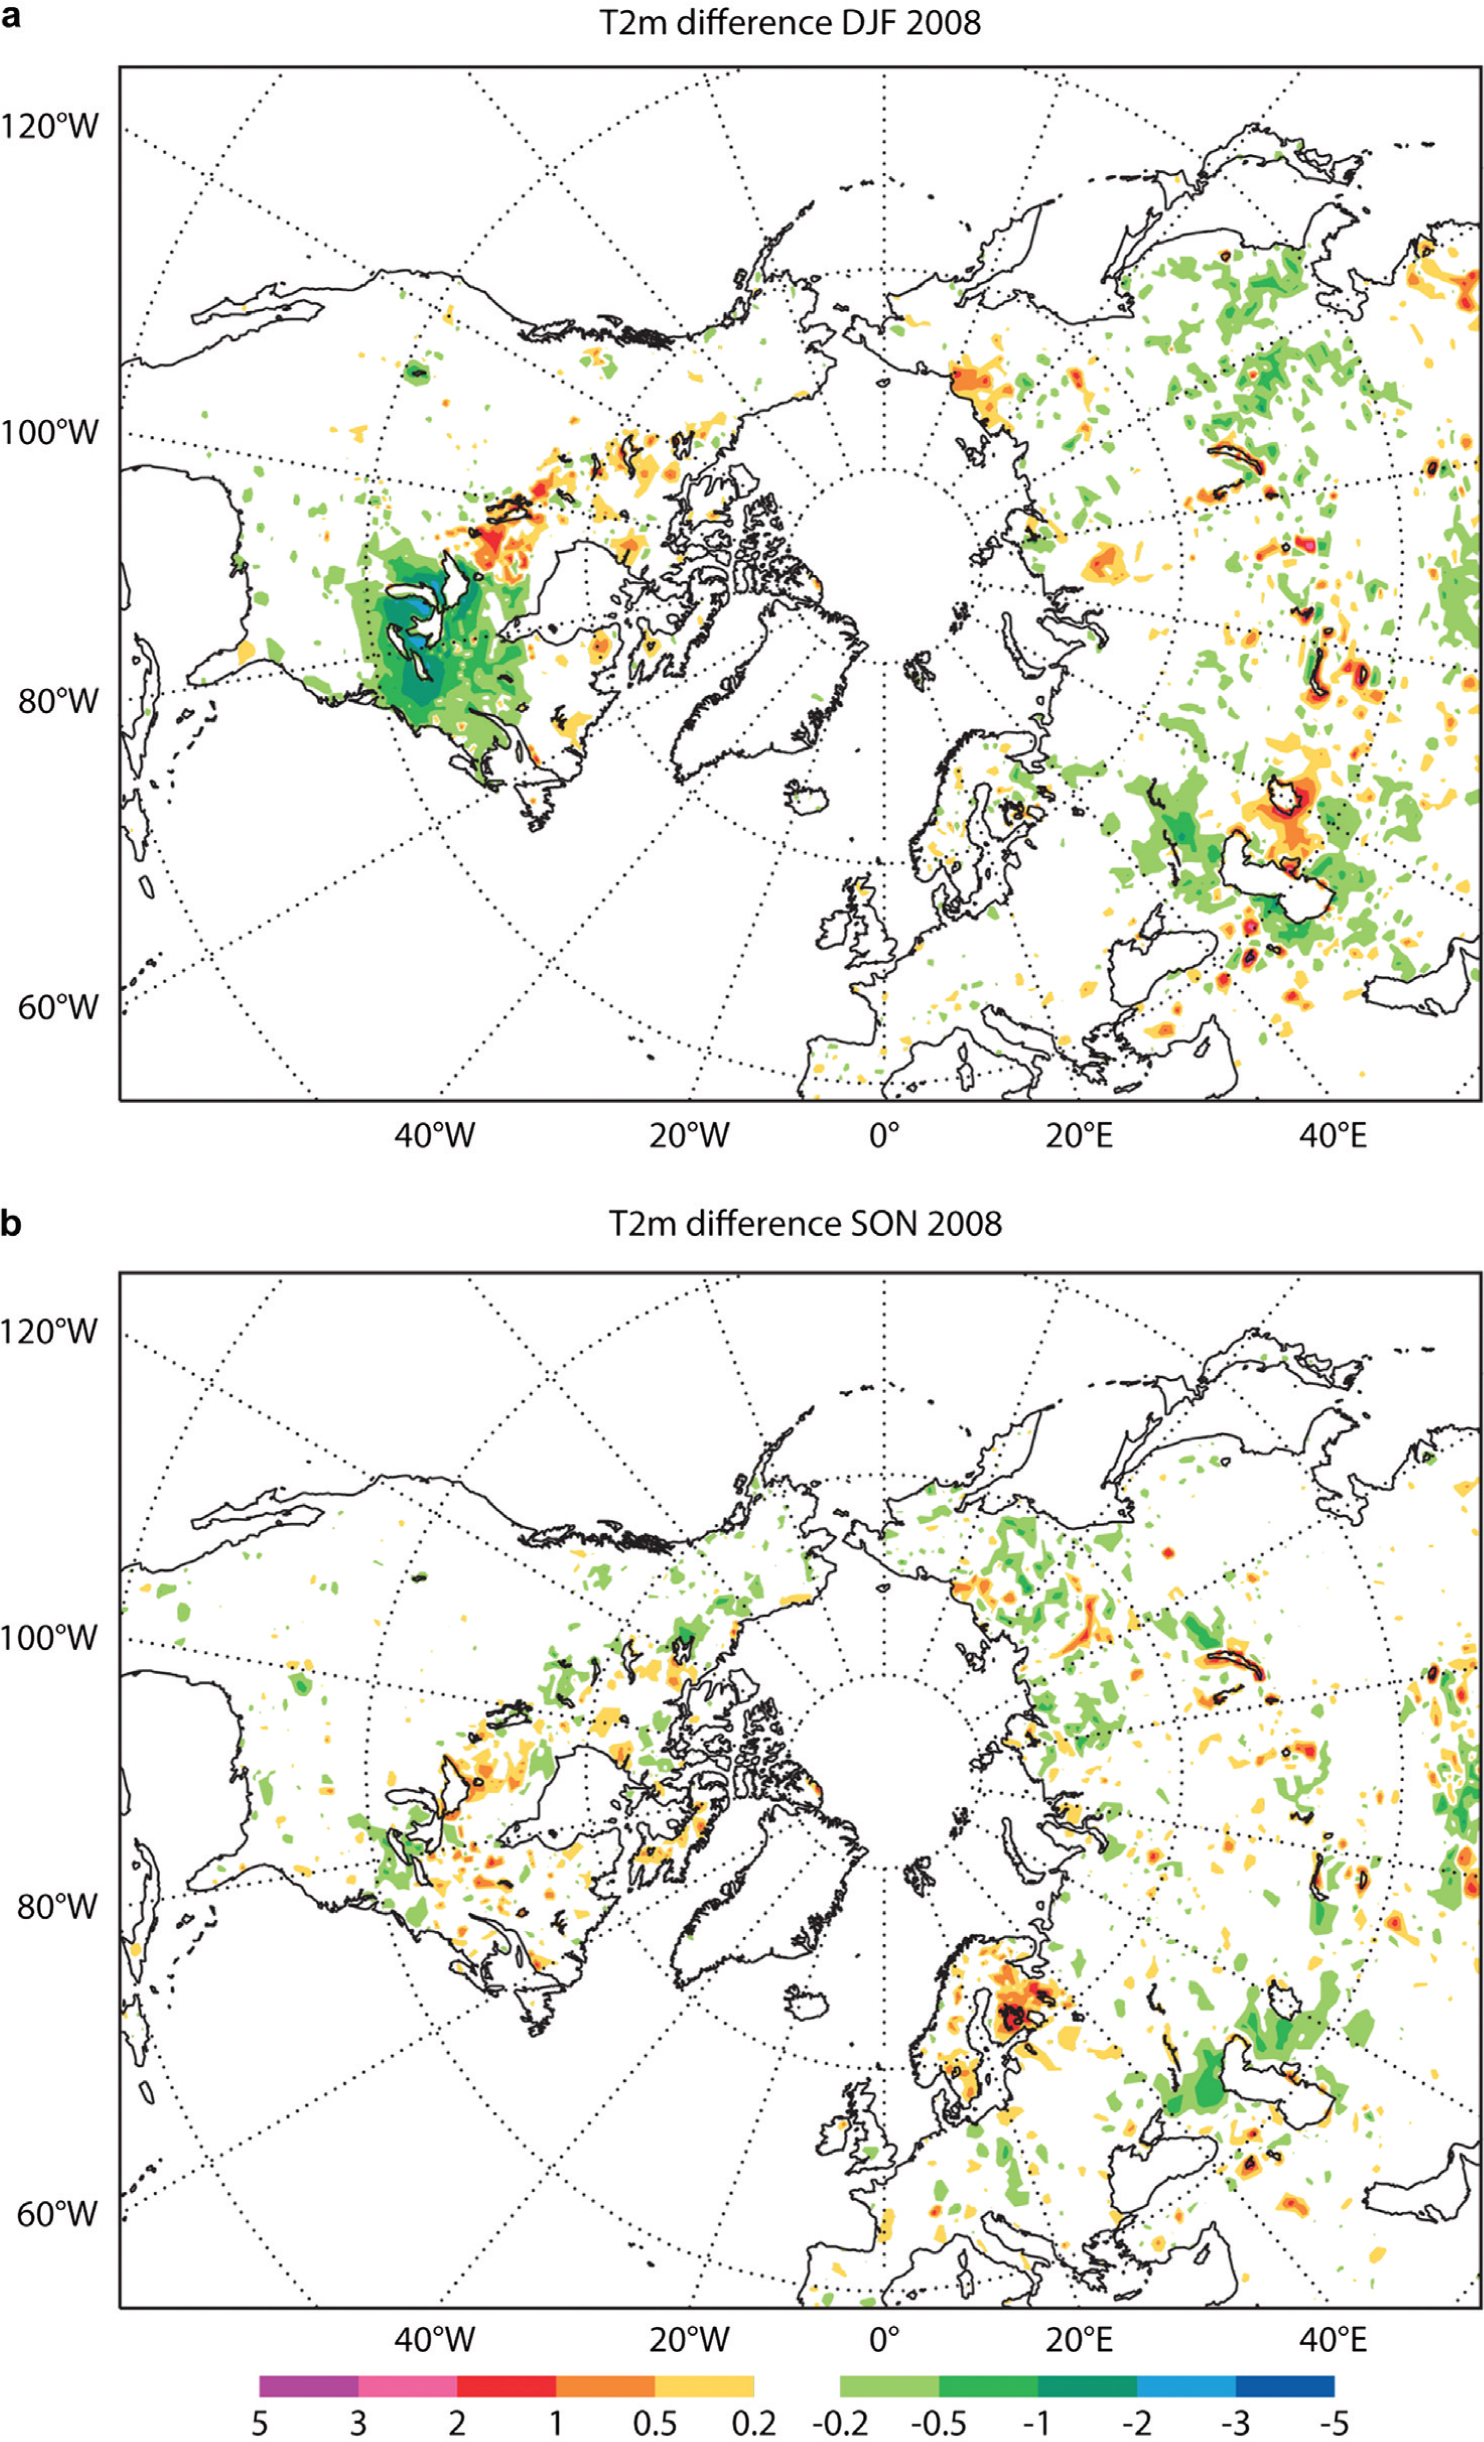
Fig. 8.
As in Fig. 7 but for (a) spring (MAM) and (b) summer (JJA).

Fig. 9.
Impact of 48-hour T2m forecasts (valid at 00 UTC) for LAKE compared with NOLAKE, verified against the ECMWF T2m analysis: Mean Absolute Error difference for (a) winter (DJF) and (b) autumn (SON). Negative values indicate an improvement (MAE reduction).
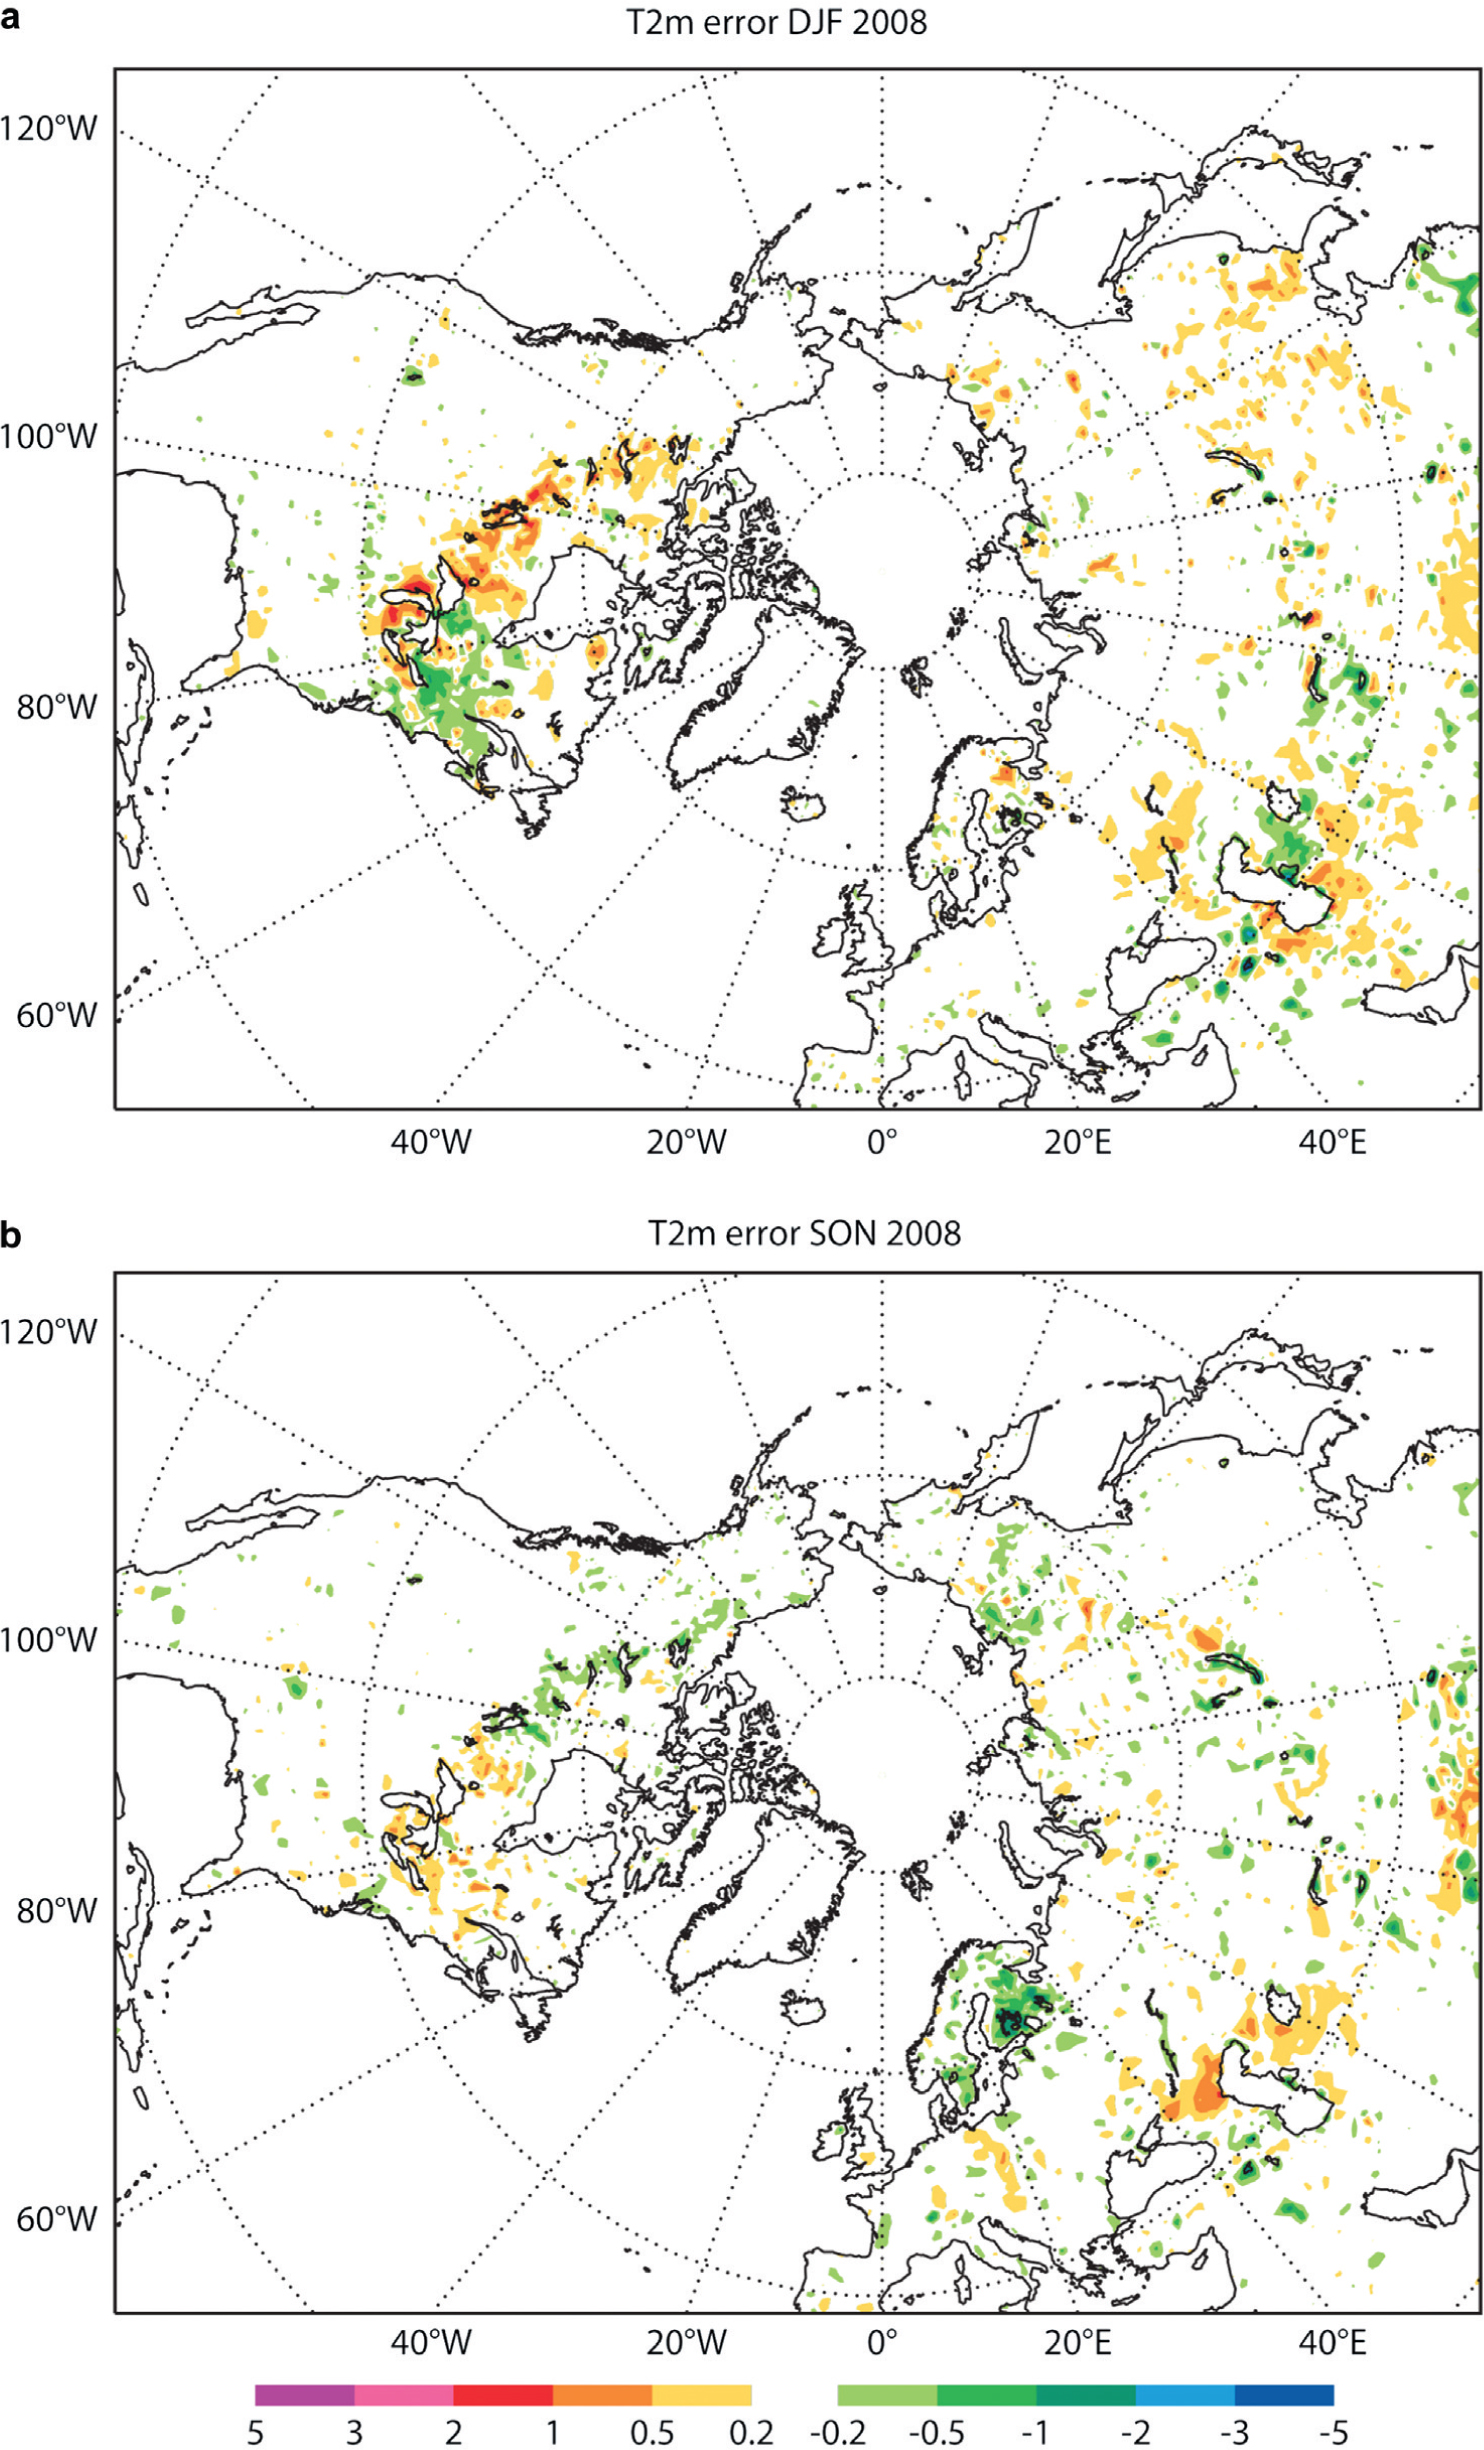
Fig. 10.
As in Fig. 9 but for (a) spring (MAM) and (b) summer (JJA).