Fig. 1.
(a) Frequency of HR over the Korean peninsula that occurred with the tropical cyclones (TCs) in each grid box. When multiple TCs are present, only the nearest TC is considered. (b) Geographical distribution of typhoon passage frequency for 1981–2009.
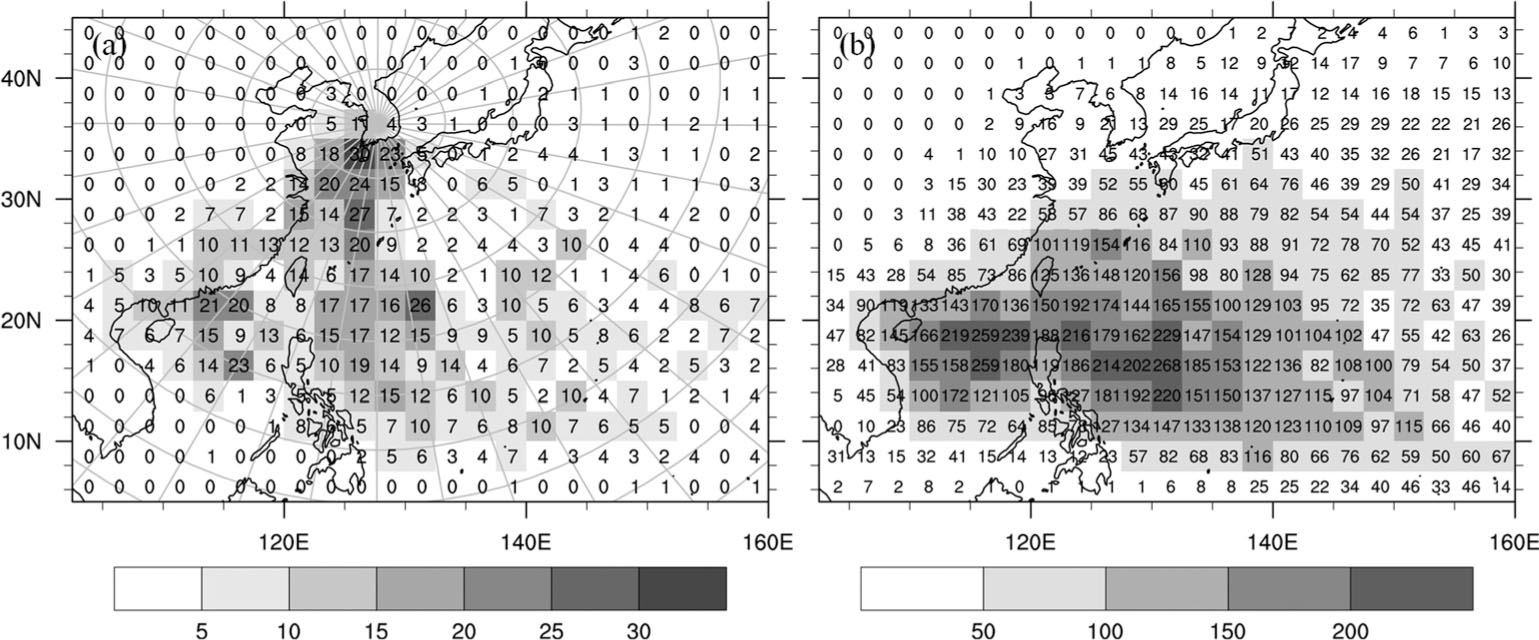
Fig. 2.
Mean annual amount of rainfall occurring with TCs (solid line) as a function of: (a) distance (every 100 km); and (b) direction (every 5°) of TC from the median station (36° 15′N, 127° 44′E) in South Korea for 1981–2009. Its accumulation with the distance or the direction is represented by the line of open circles. Dotted line is for the mean annual amount excluding the rainfall cases with TCs inside of the critical radius, which is defined in the text.
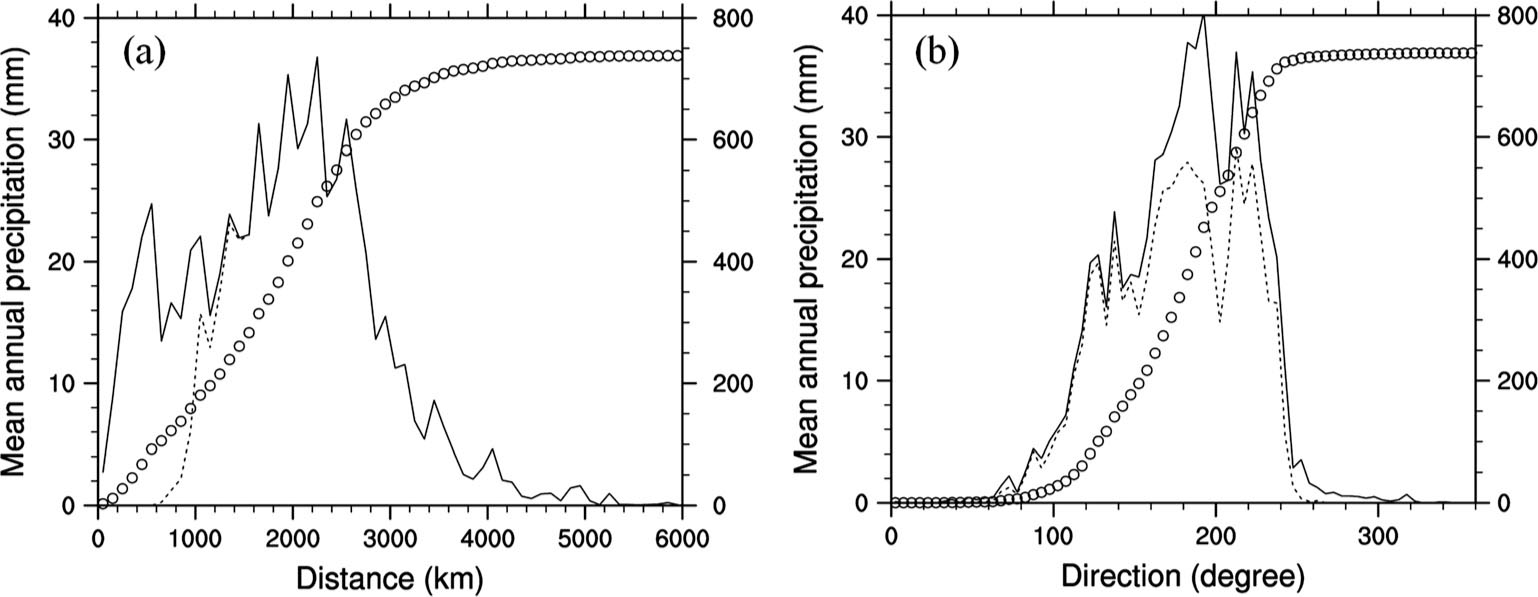
Fig. 3.
(a) Six-hour precipitation amount averaged over South Korea and over the events with TCs passing through 2.5°×2.5° grid; and (b) the percentage of TCs that were accompanied with HR over the Korean peninsula, among the whole TCs that were located within each grid for 29 yr (1981–2009). In (b), events of direct TC effect are excluded using the concept of critical radius of TC (explanation is given in the text), and the box region (20–30°N, 107.5–132.5°E) is the area of remote TC for composite analysis.
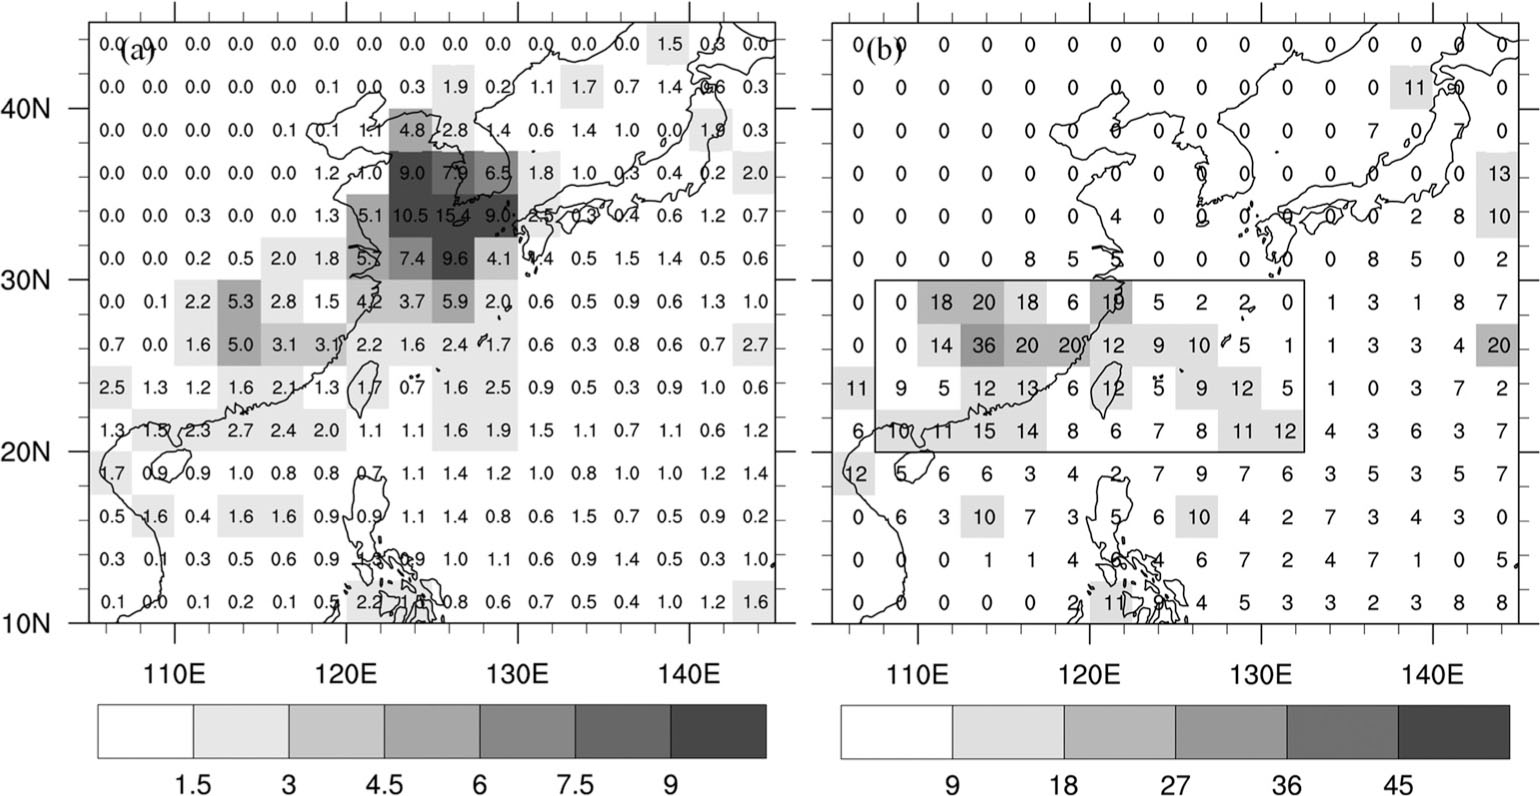
Fig. 4.
Locations and tracks of remote TCs at T− 0 for: (a) landfalling TCs over China (LT cases, closed circles); and (b) TCs over the ocean (OT cases, open circles). The box region (20–30°N, 107.5–132.5°E) is the area of remote TC for composite analysis. The line types indicate cyclone grade: tropical storm and typhoon (solid line), TD (dashed line) and extratropical cyclone (dotted line). A schematic of the critical radius in this study is included in (b). The critical radius is calculated as the sum of: (1) the longest radius of (30 knots) winds provided by RSMC; (2) the maximum distance from the radius to the rain fields induced by the TC itself; and (3) the 6-houlry moving distance of TCs.
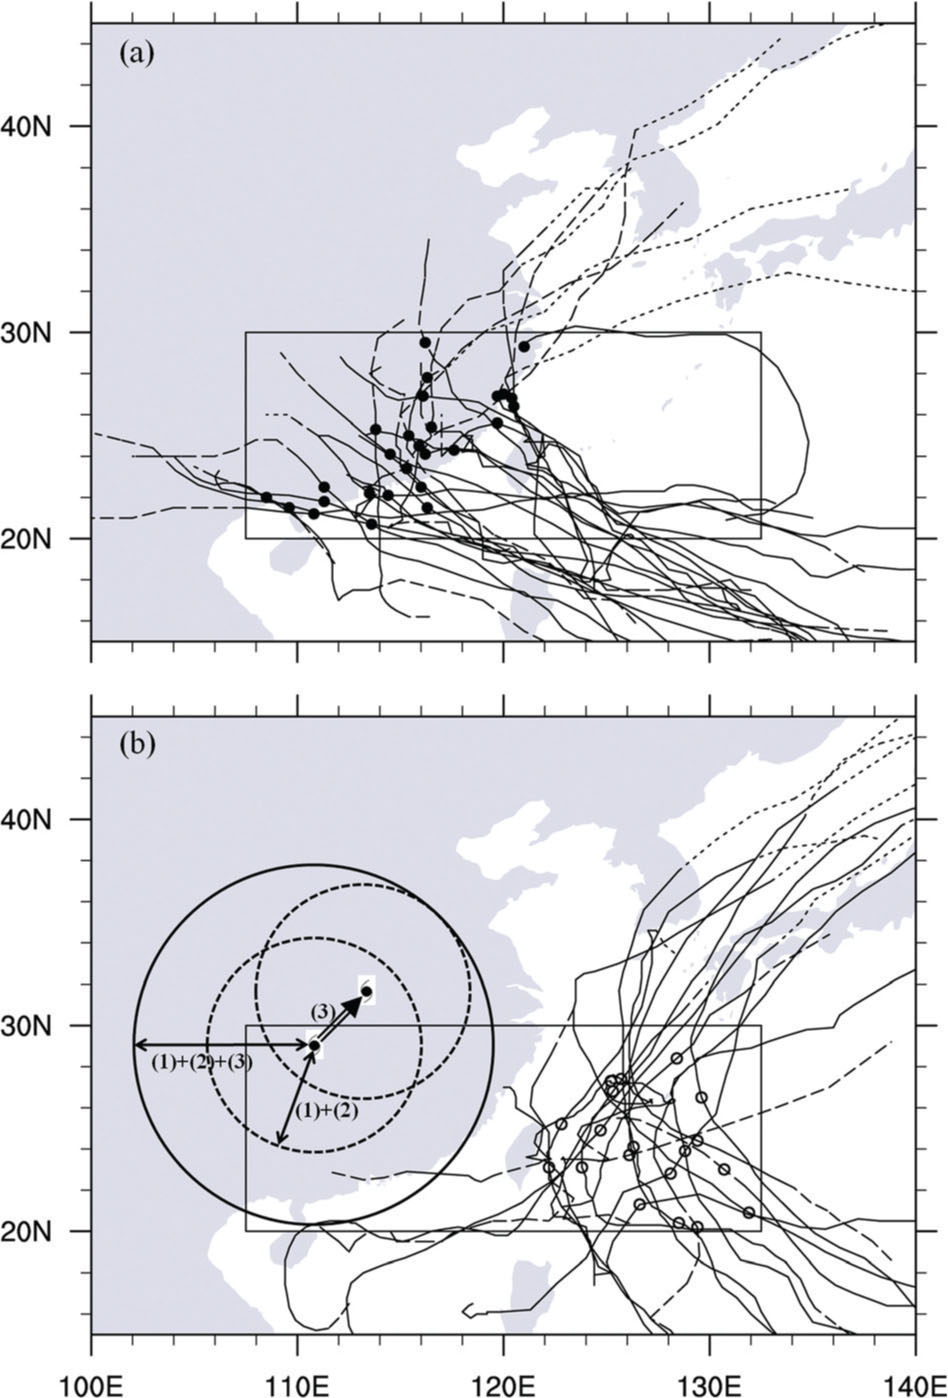
Table 1. Heavy rainfall events considered for the present composite analysis
[i] Notes: The name of remote TCs with international ID number, HR initiation date and time (UTC), the central pressure of remote TCs (P), the distance between remote TC and 6-hourly maximum rainfall station (D), 6- and 24-hourly maximum rainfall amount (mm) and maximum observational stations. The superscript alphabet (a) refers to HR events in which TCs pass through or close to the Korean peninsula since T + 24.
Fig. 5.
Histogram of: (a) the monthly frequency; (b) minimum surface pressure; and (c) intensity category of remote TCs which are related to HR over the Korean peninsula. (d) Station-averaged precipitation for each time since T− 0 over the Korean peninsula. In each diagram, whole HR cases is represented by white bars, landfalling TC cases (LT) by grey bars, and oceanic TC cases (OT) by black bars. In (d), EL and EO are the same as LT and OT, respectively, except that TCs which approach the Korean peninsula are excluded. Intensity categories TD, TS, STS, and TY indicate tropical depression, tropical storm, severe tropical storm, and typhoon, respectively.
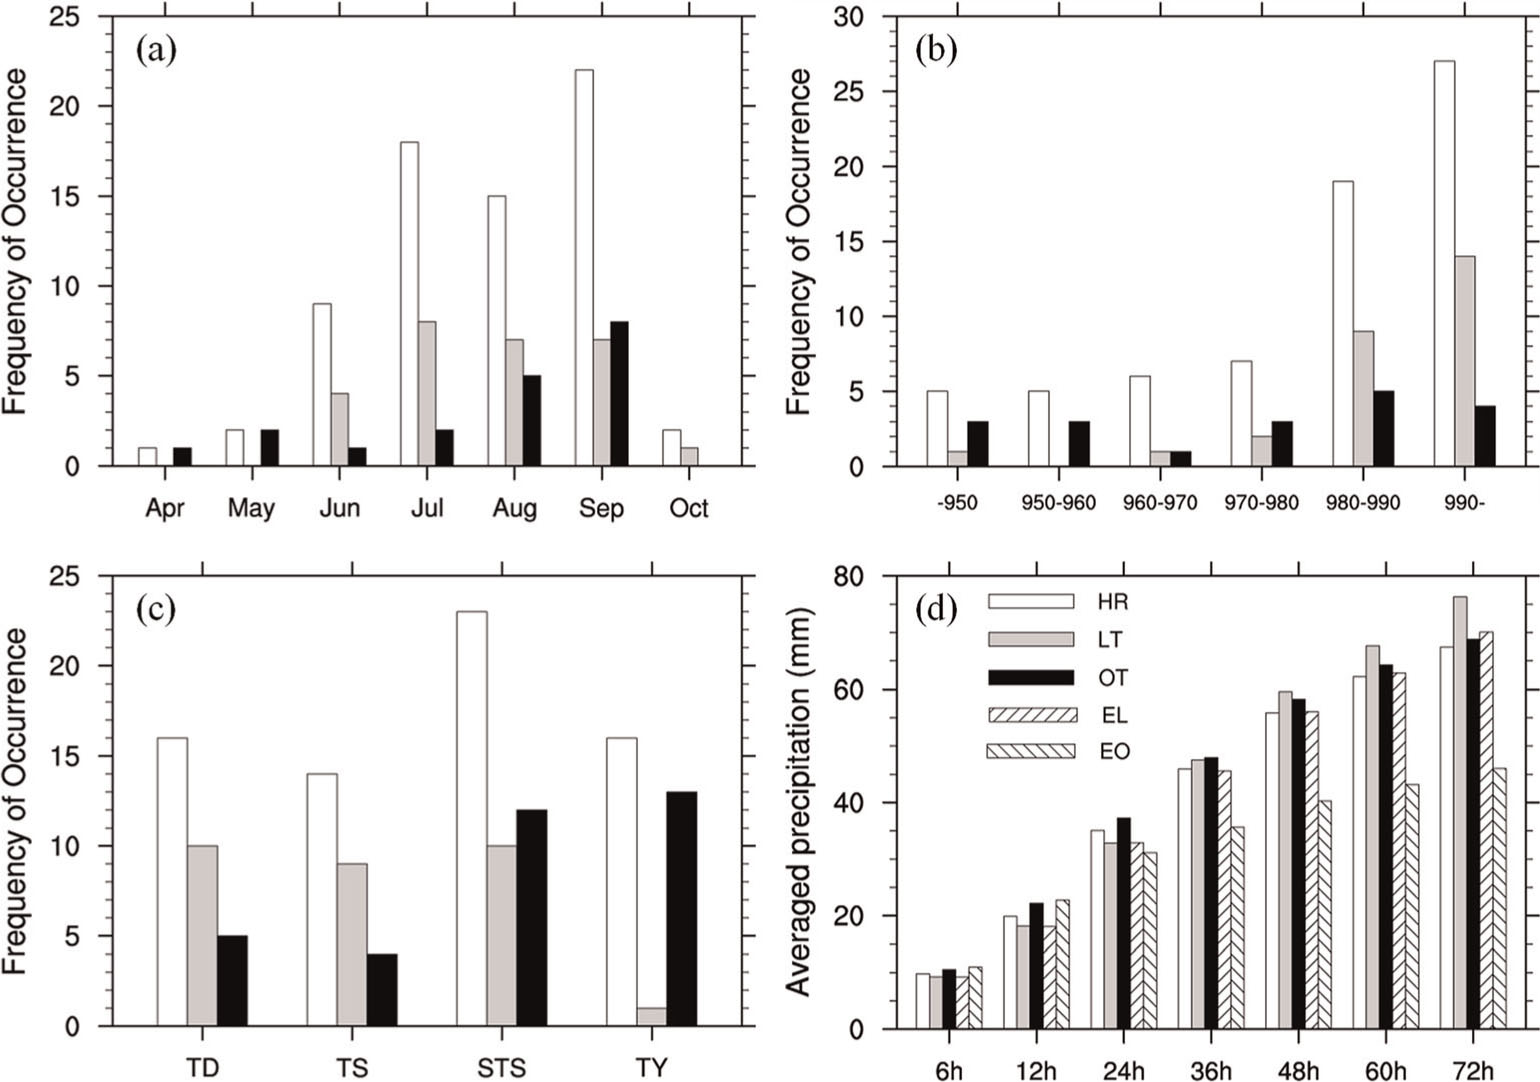
Fig. 6.
Composite maps for T− 0 for 69 HR cases (left panels) and 103 NR cases (right panels): (a, c) wind fields (wind barb), geopotential height (every 30 m, solid lines) at 850 hPa, and CIMFC (every 0.1×10⁻⁴ from 0 g kg−1 s−1, shaded); and (b, d) wind vectors at 850 hPa, isotachs for 200 hPa (every five from 35 m s−1, dashed) and 850 hPa (every 2.5 from 10 m s−1, solid lines), and vertical pressure velocity at 500 hPa (every −0.05 from −0.05 Pa s−1, shaded).
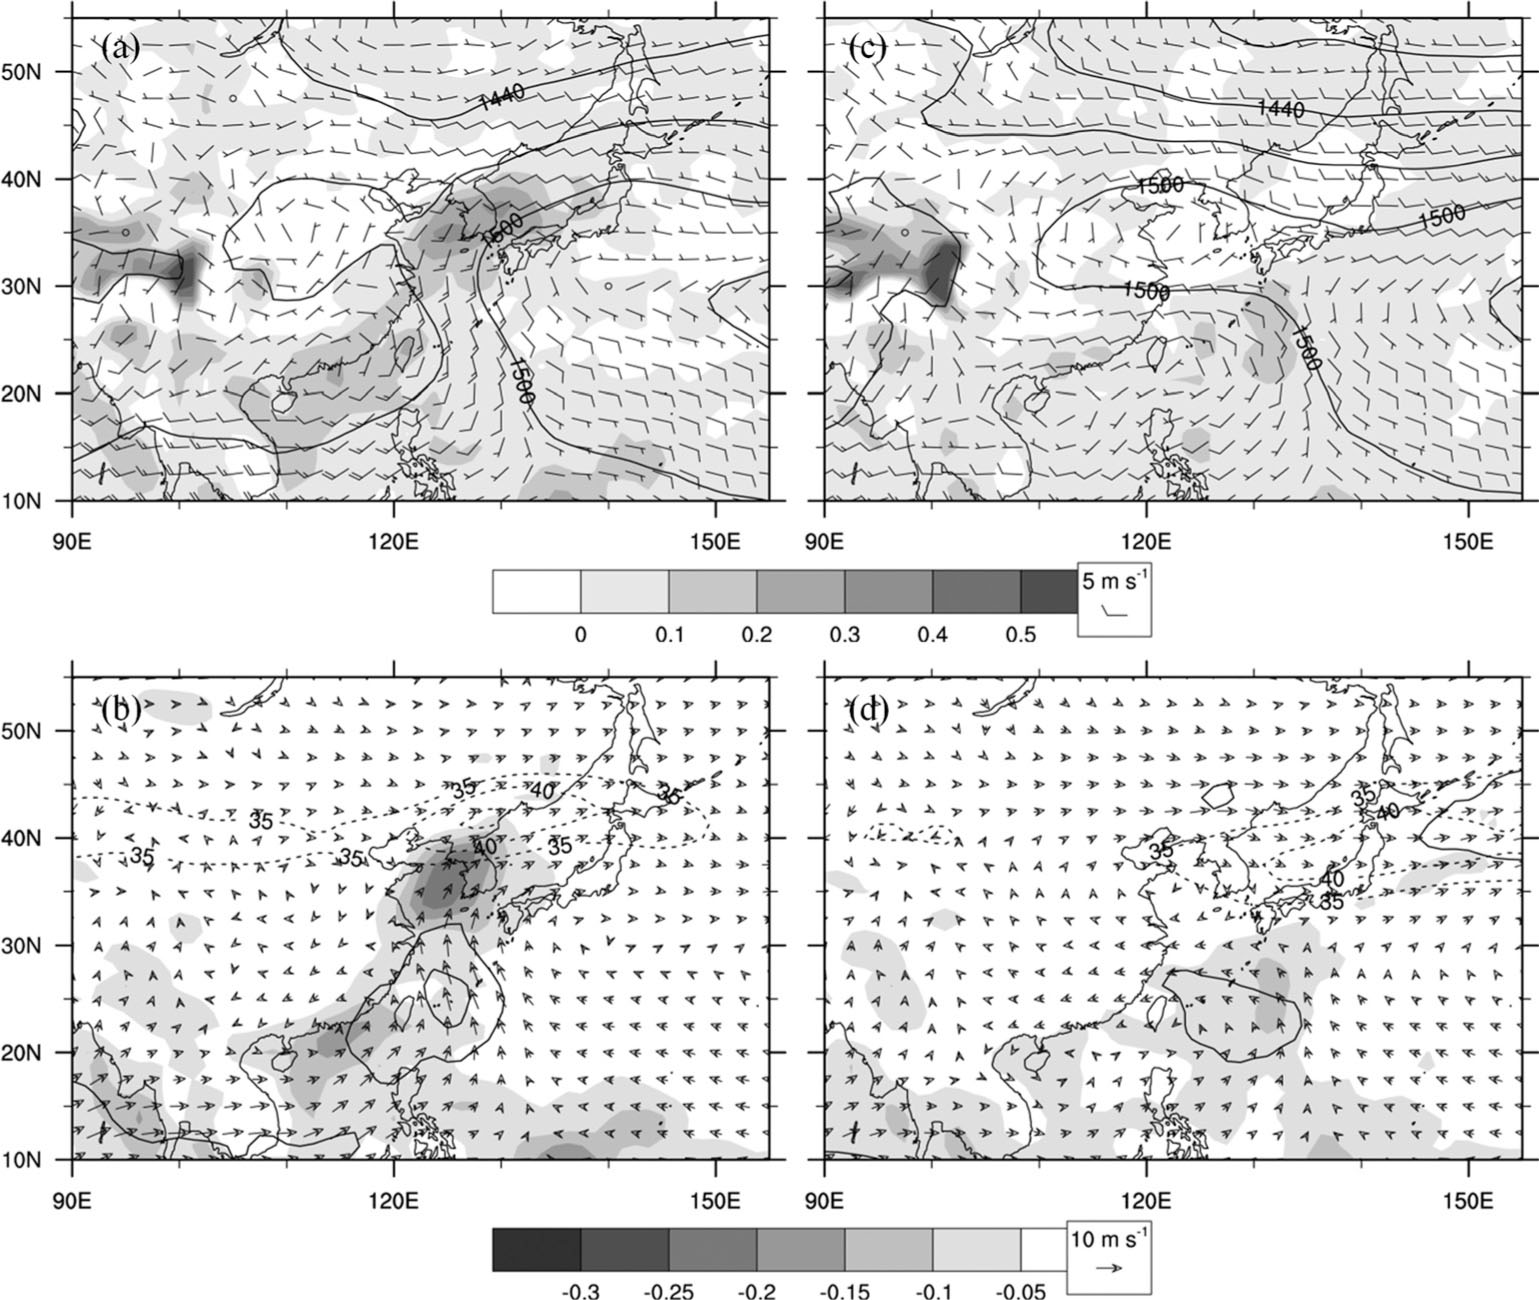
Fig. 7.
Composite map of sea level pressure (every 2 hPa, solid lines), wind fields at 1000 hPa (wind barb), column-integrated MFC (every 0.1×10⁻⁴ from 0 g kg−1 s−1, shaded) for LT composite (left panels) and OT composite (right panels) at: (a, e) T− 24; (b, f) T− 0; (c, g) T + 24; and (d, h) T + 48. TC symbols indicate TC locations.
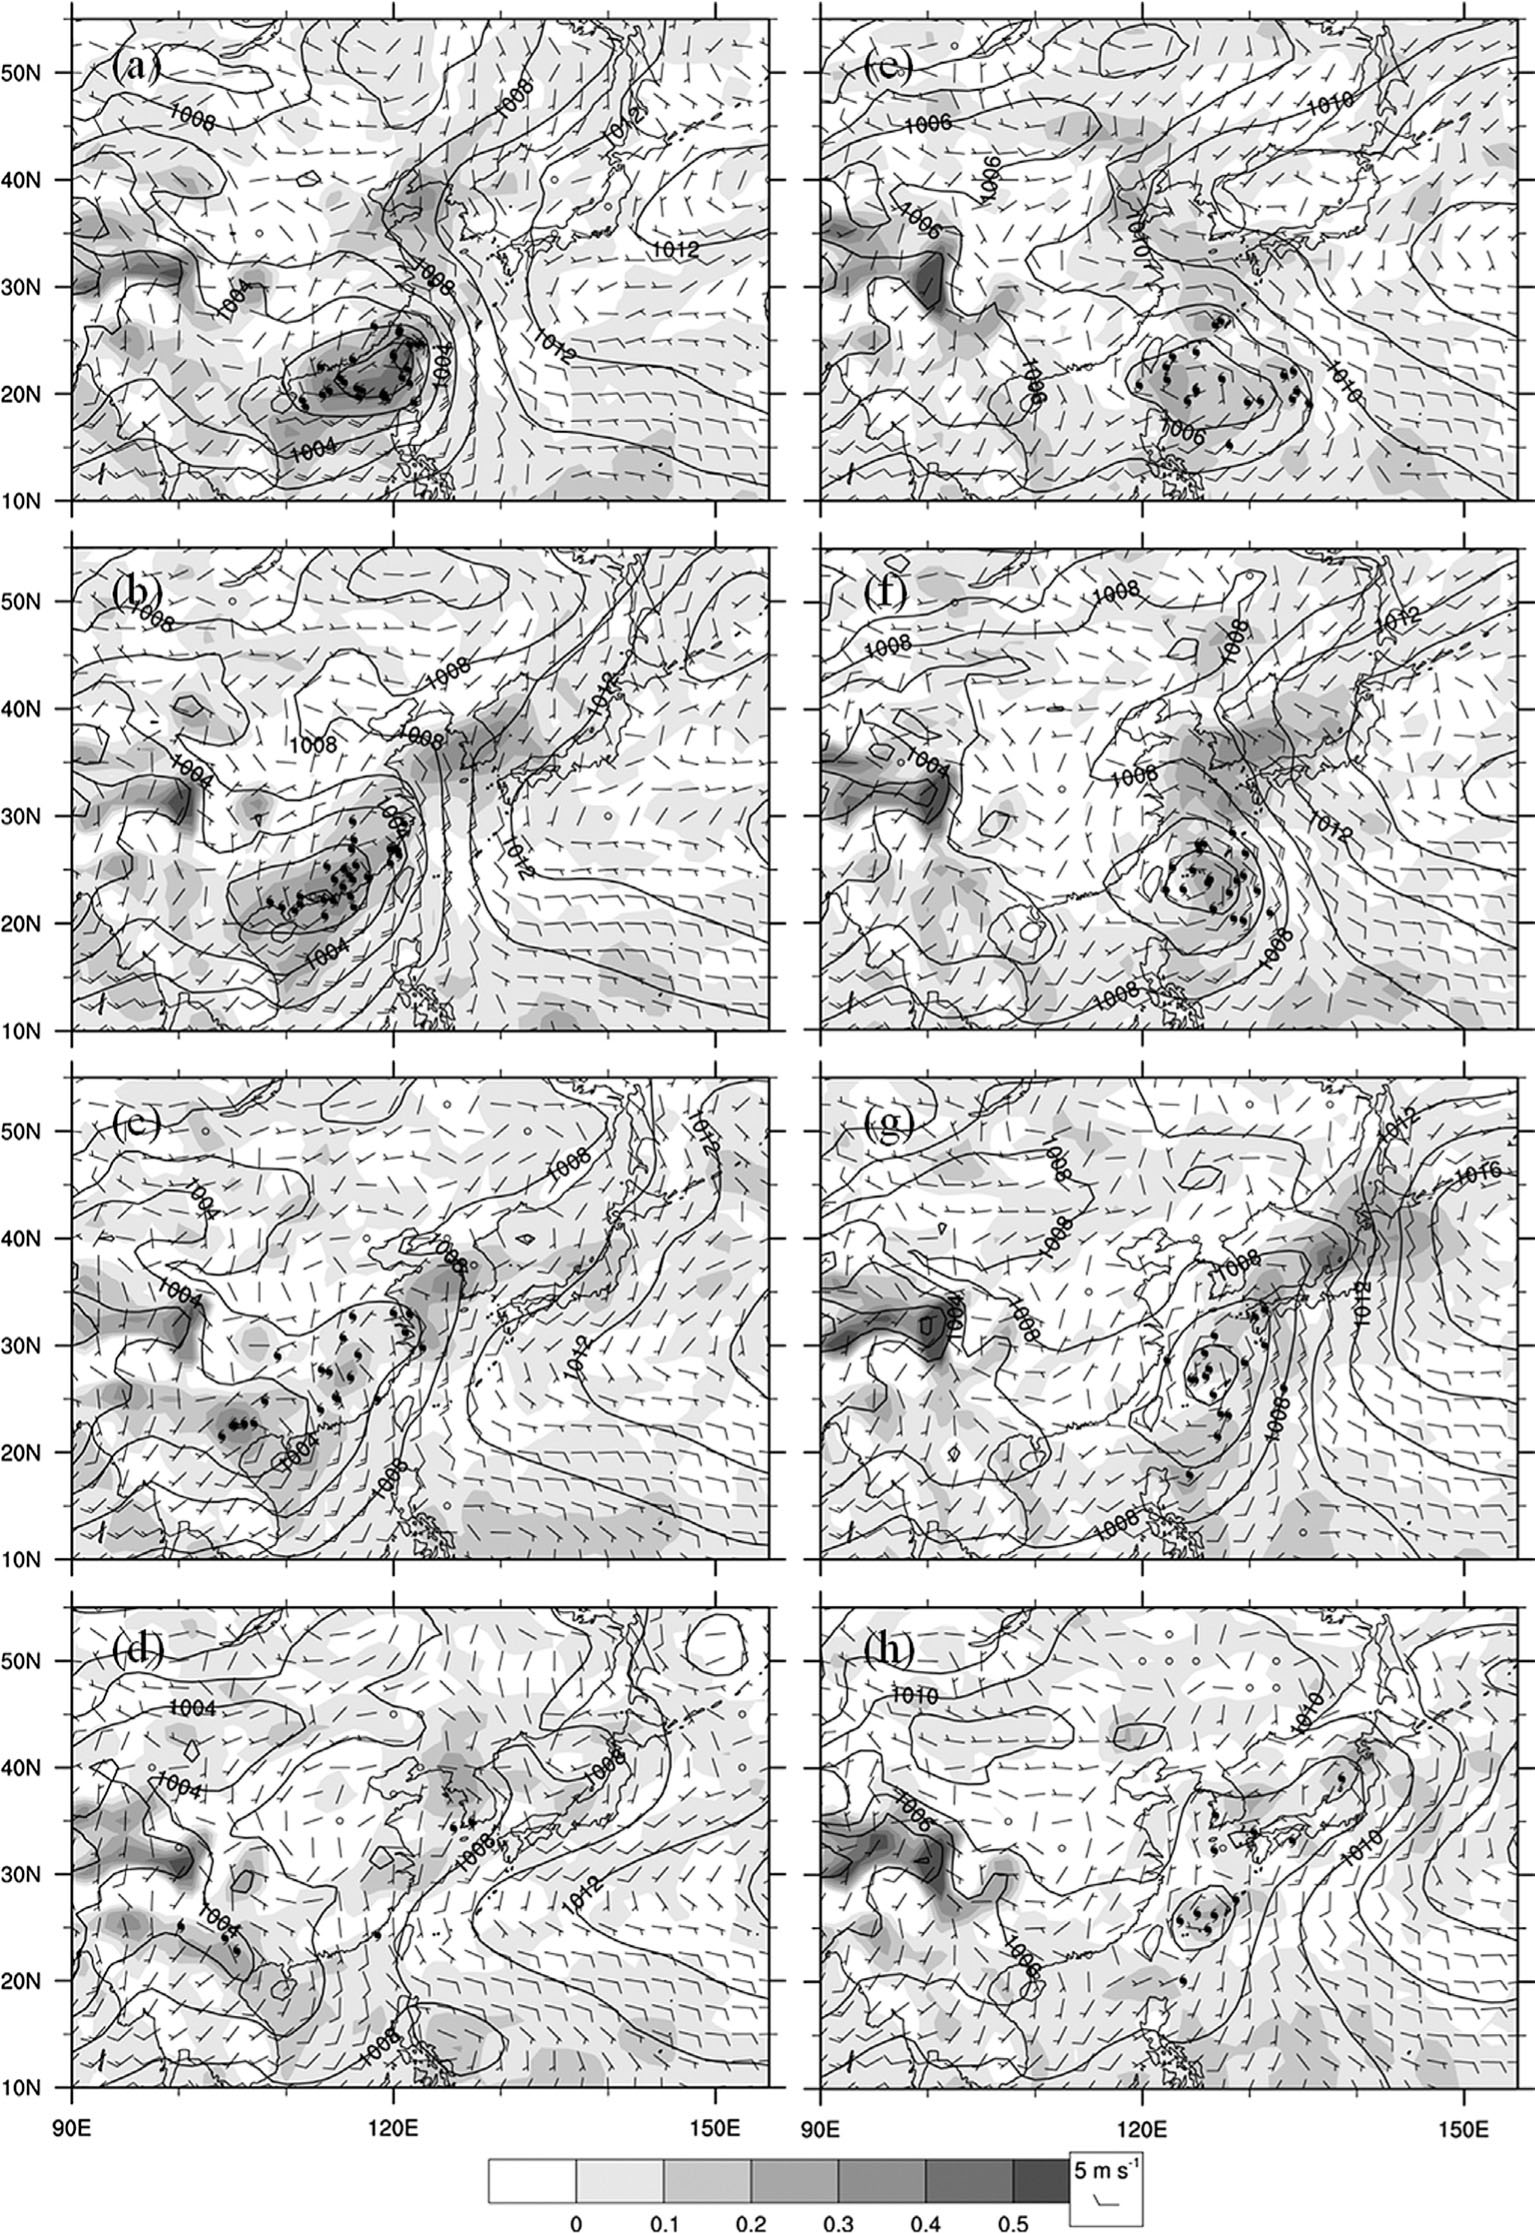
Fig. 8.
Composite of geopotential height (every 15 m, solid), equivalent potential temperature (every 4 K, shaded), and horizontal divergence (every 2×10⁻⁶ s−1 from −2×10⁻⁶ s−1 to −10×10−6 s−1, dashed) at 850 hPa for LT (left panels) and OT (right panels) at: (a, e) T− 48; (b, f) T− 24; (c, g) T− 0; and (d, h) T + 24.
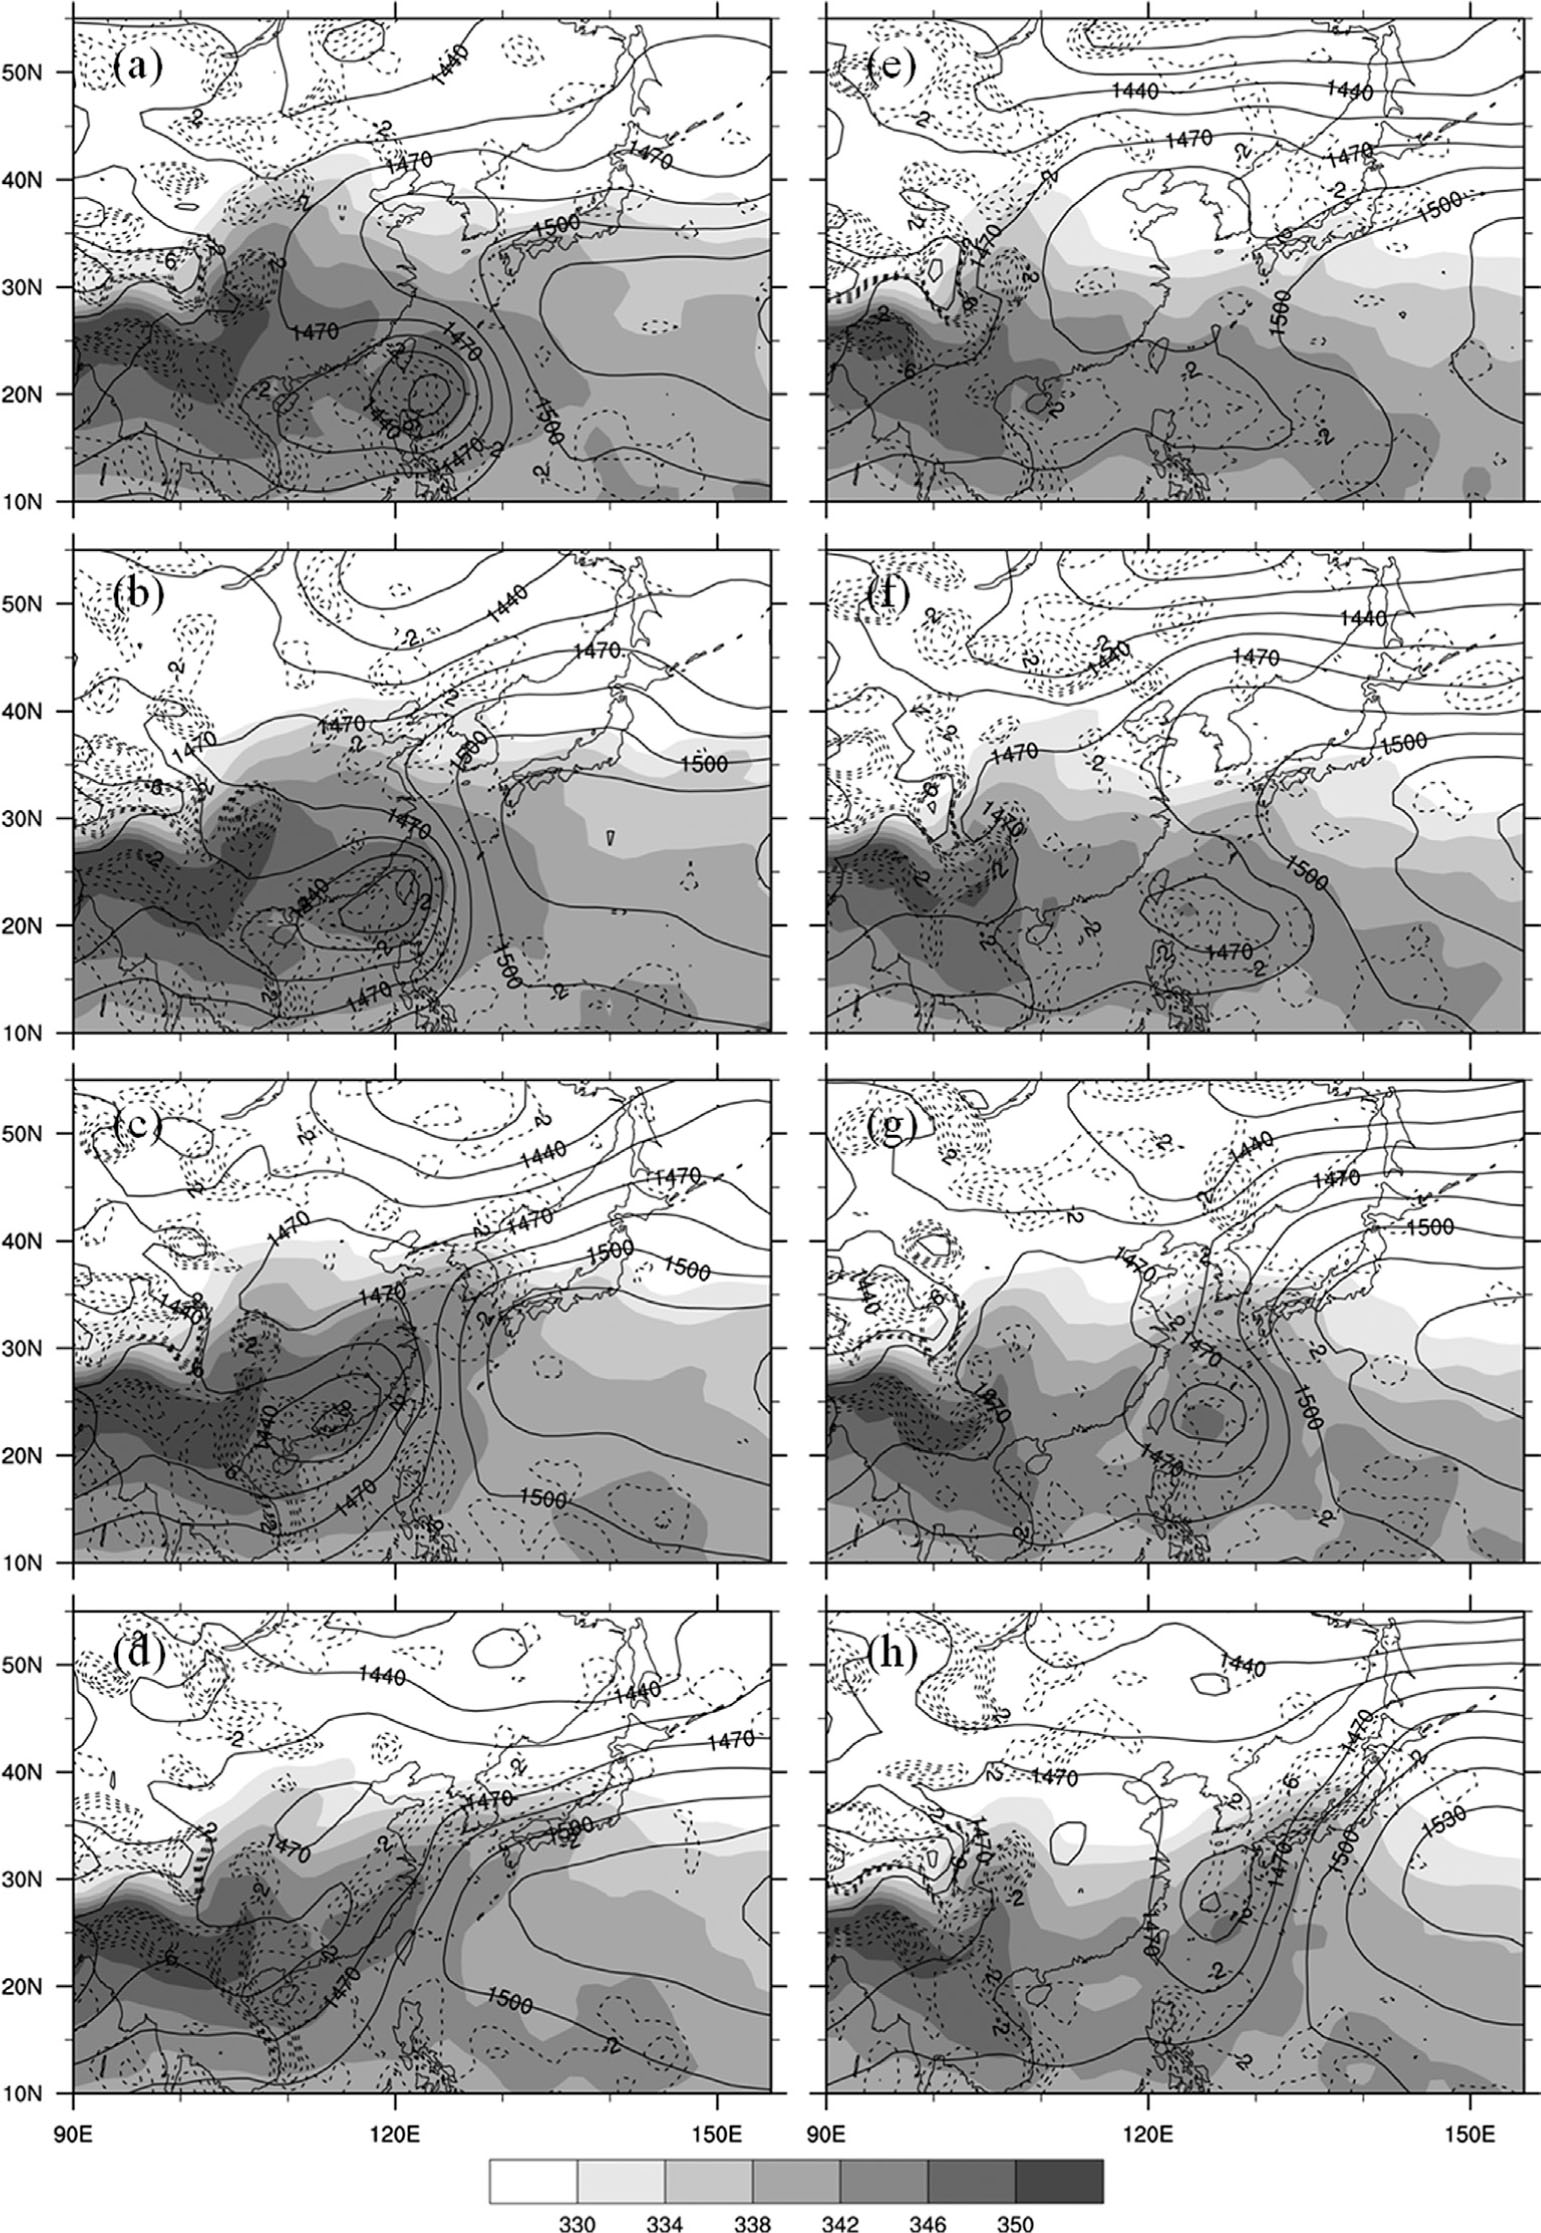
Fig. 9.
Composite of wind vectors at 850 hPa, isotachs for 200 hPa (every five from 35 m s−1, dashed lines), 850 hPa (every 2.5 from 10 m s−1, solid lines) and vertical pressure velocity at 500 hPa (every −0.05 from −0.05 Pa s−1, shaded) for LT (left panels) and OT (right panels) at: (a, e) T− 48; (b, f) T− 24; (c, g) T− 0; and (d, h) T + 24.
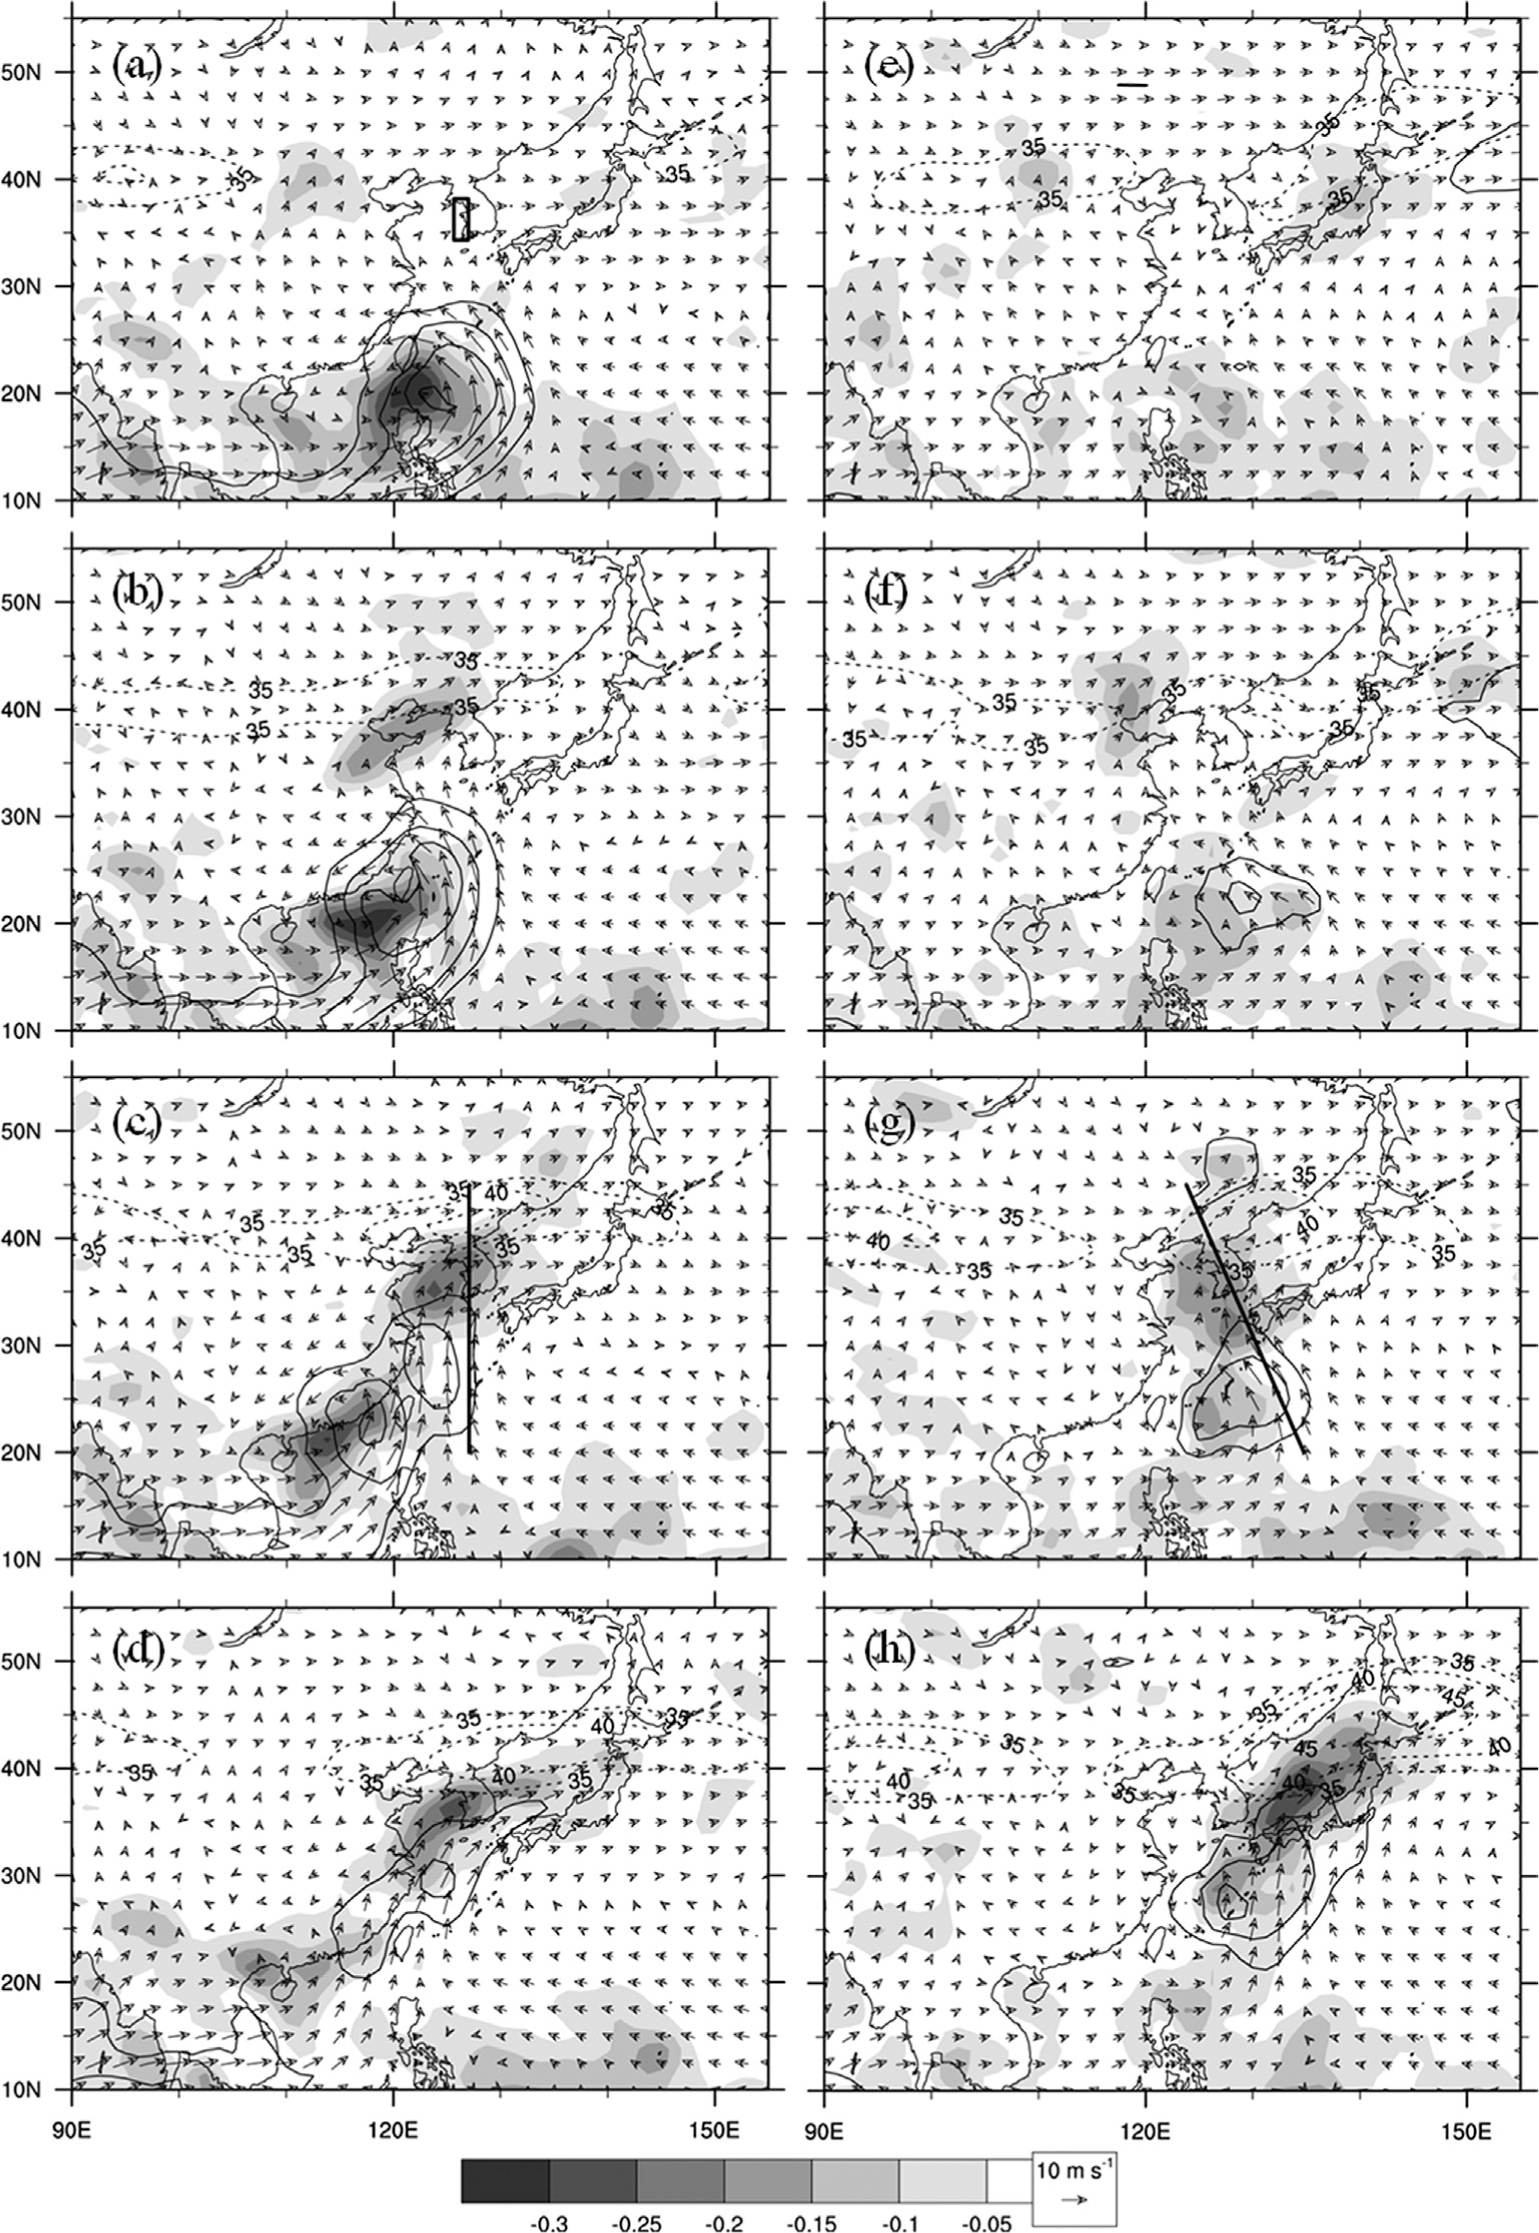
Fig. 10.
Vertical cross sections of equivalent potential temperature (every 5 K, shaded), vertical pressure velocity (every −0.05 from −0.05 Pa s−1, dashed lines), the total wind speed (every five from 30 m s−1, solid lines), and horizontal flow in the plane of the cross section (arrows in m s−1) at T− 0 for: (a) LT composite; and (b) OT composite. Each cross-section orientation is marked in Fig. 9c, g, respectively. Triangles indicate the location of the southern coast line of the Korean peninsula.
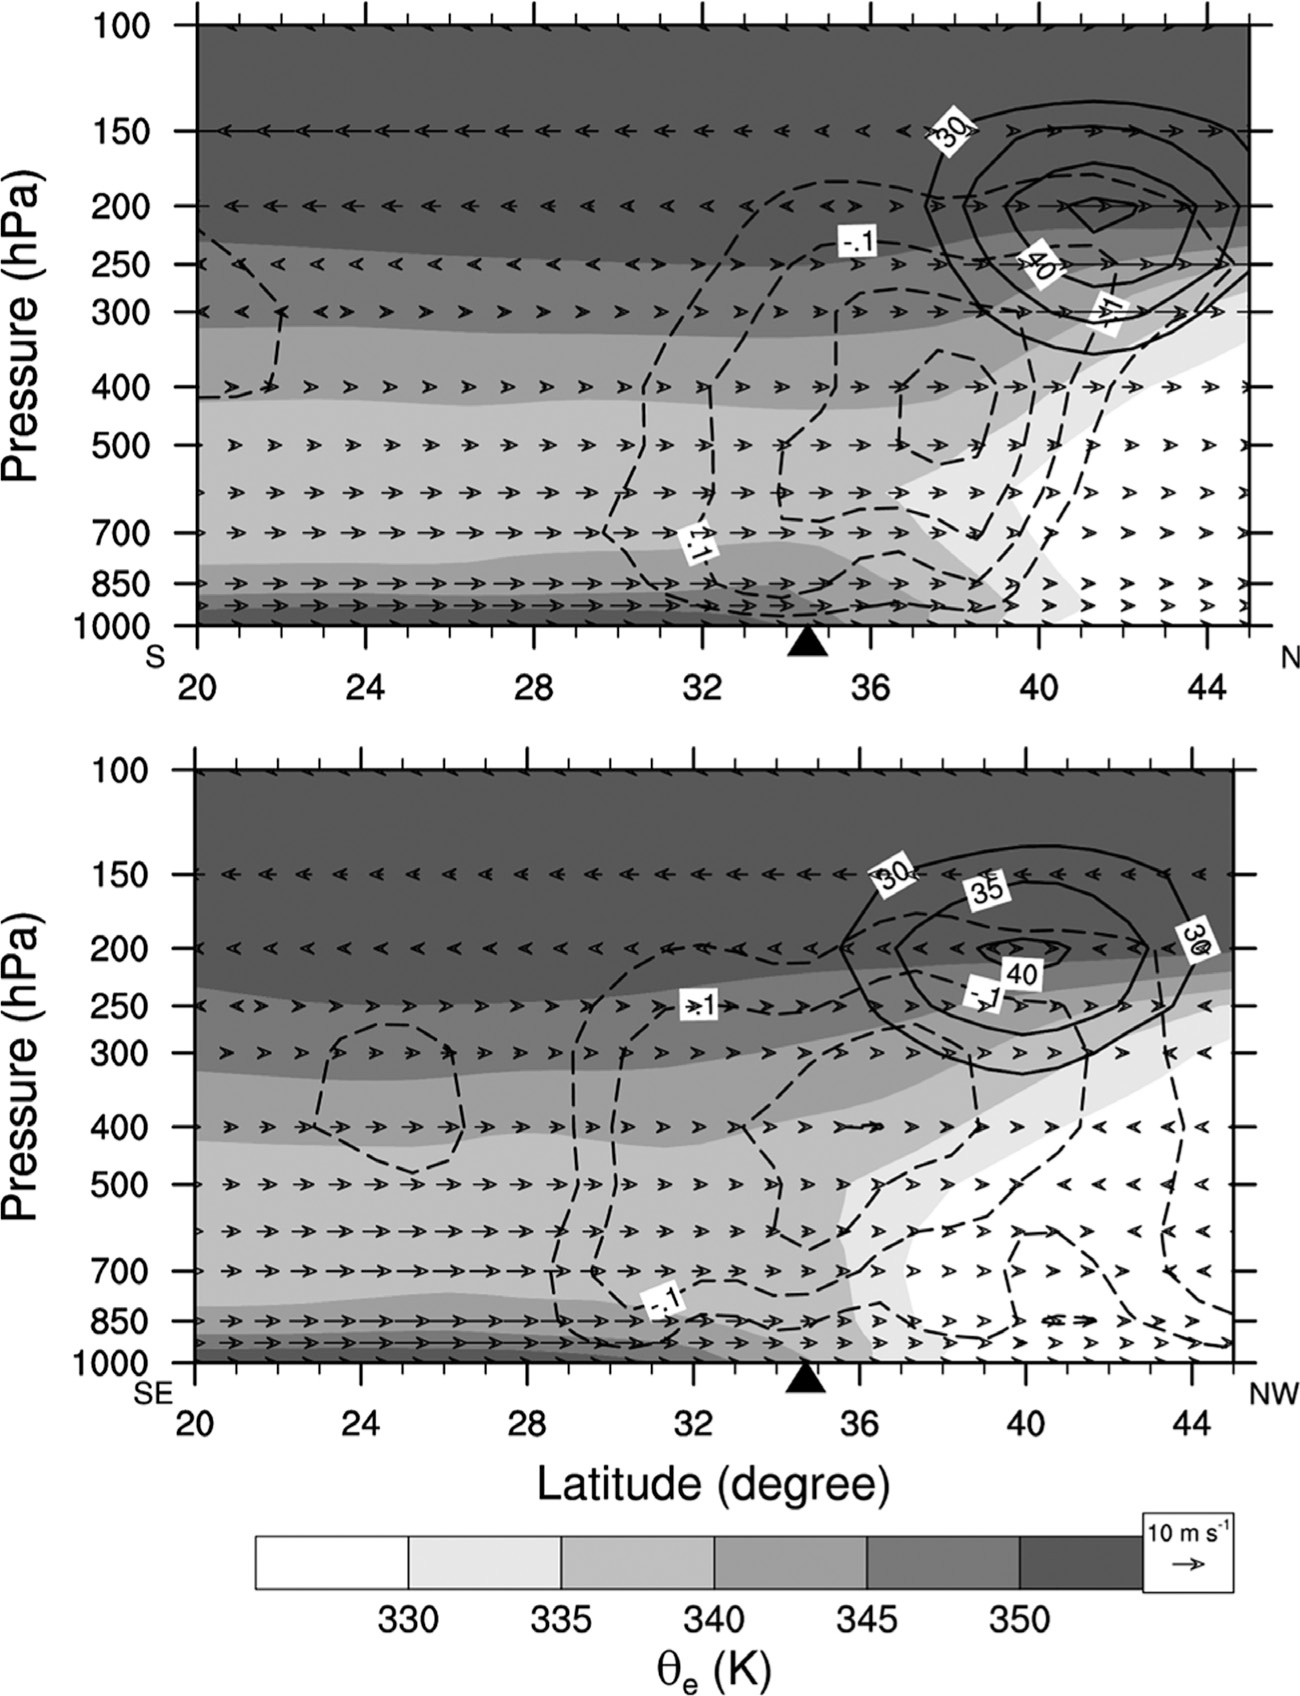
Fig. 11.
Time series of the equivalent potential temperature difference between 500 and 850 hPa (θediff = θe500–θe850, solid lines) and CIMFC (dashed lines) for LT (open circle) and OT (blackened circle). These values are the average over grids in the box shown in Fig. 9a.
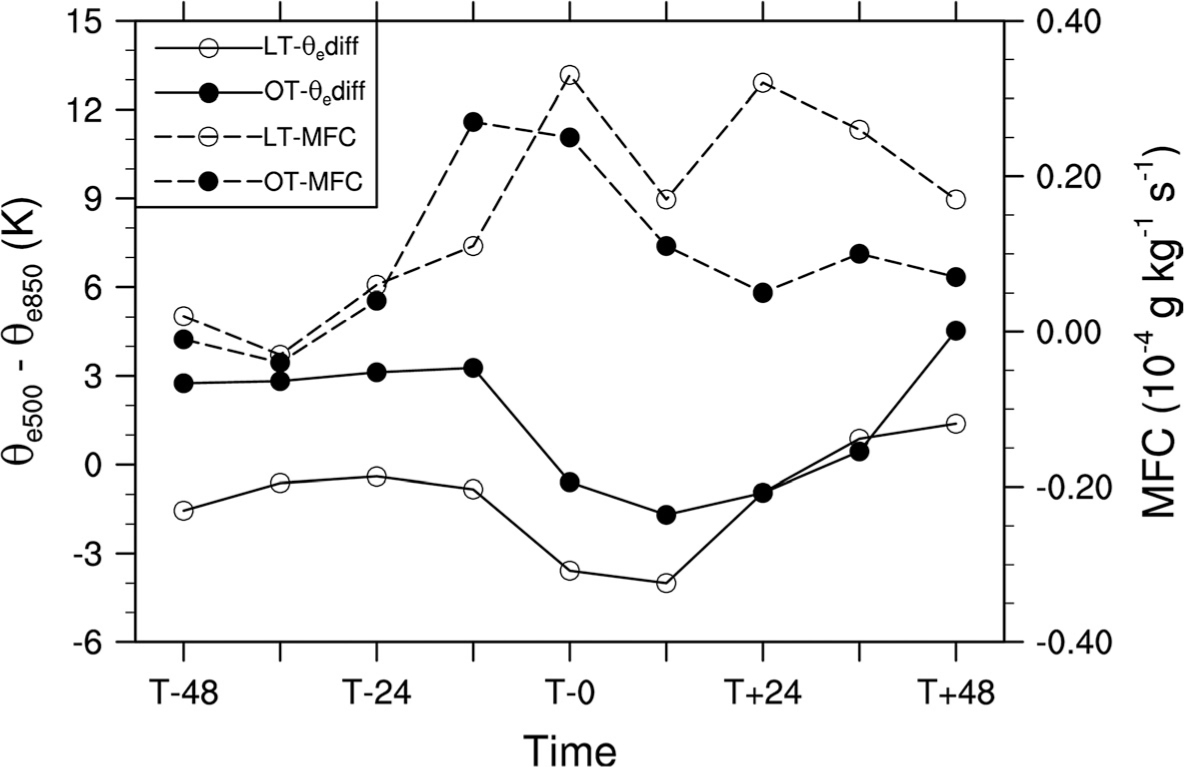
Fig. 12.
Composite of sea level pressure (every 2 hPa, solid lines), 1000–500 hPa thickness (every 30 m, dashed lines), and divergence of Q-vector (every 0.1×10⁻¹² Pa m−2 s−1, shaded) at 700 hPa for LT (left panels) and OT (right panels) at: (a, c) T− 0; and (b, d) T + 24.
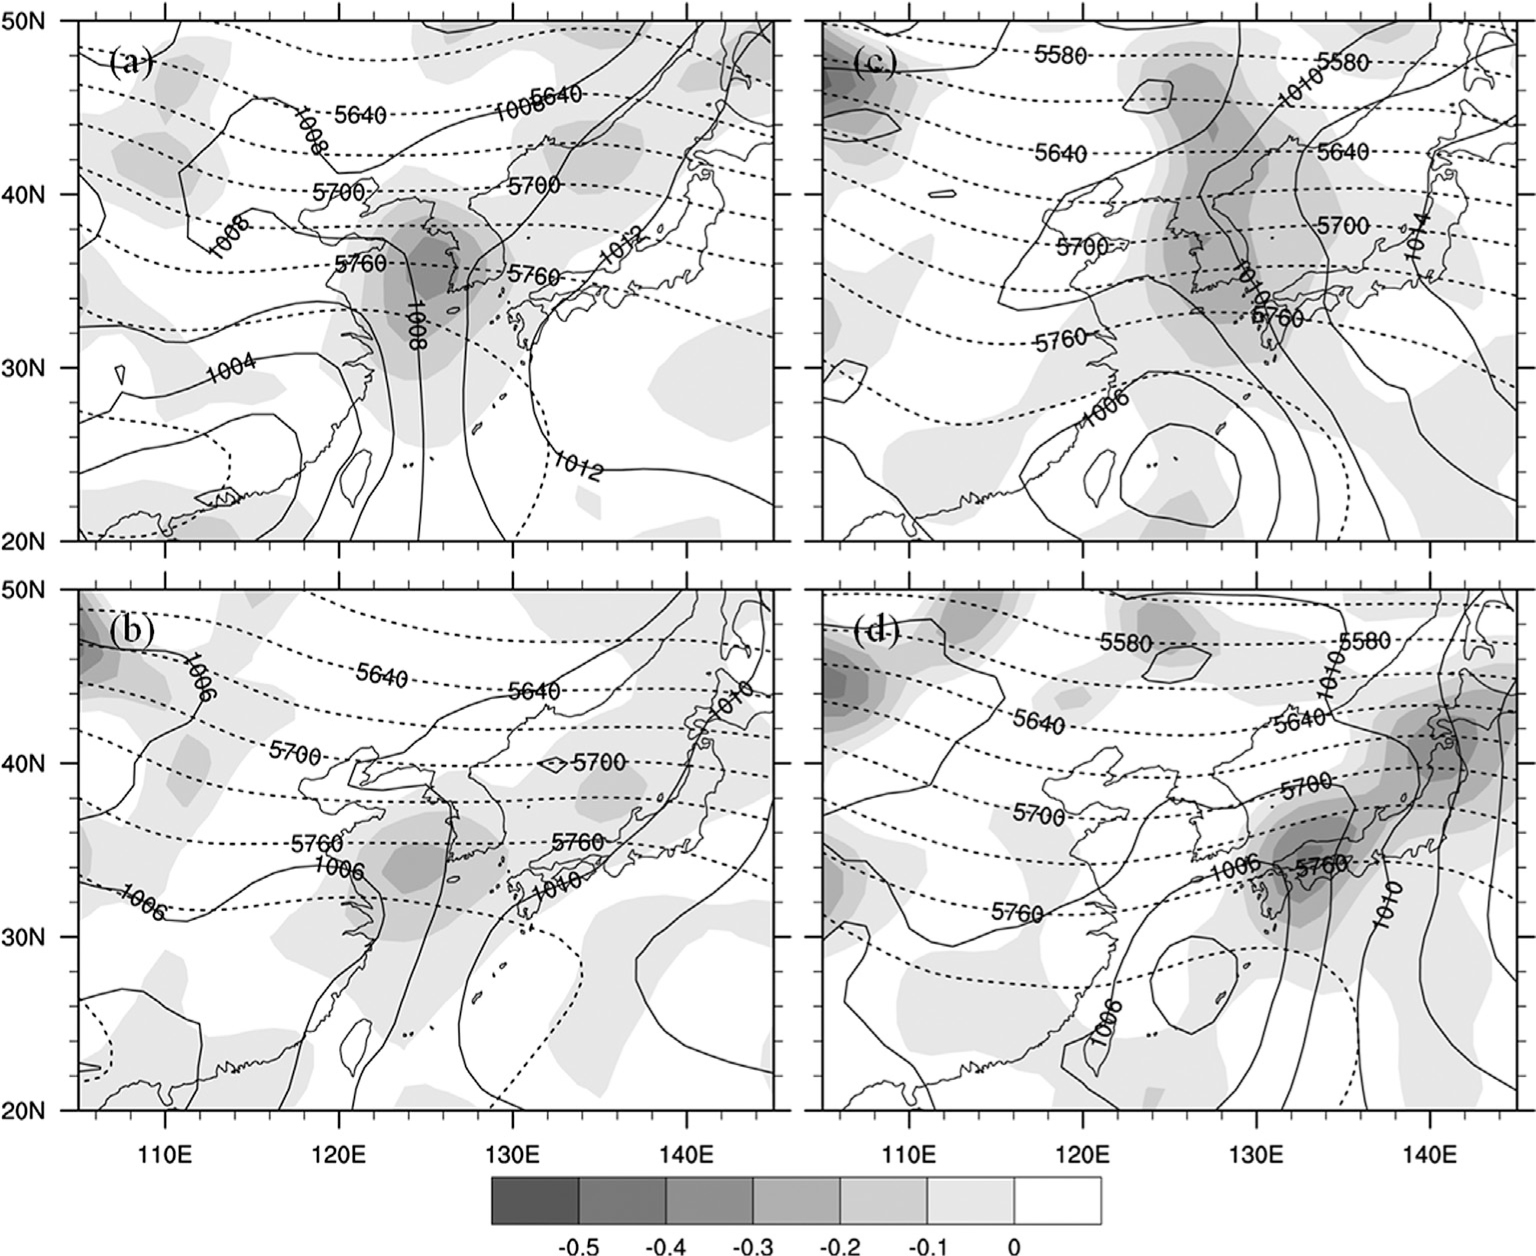
Fig. 13.
Composite of geopotential height (every 20 m, solid), equivalent potential temperature (every 5 K, dashed), and Petterssen frontogenesis (every 0.05 K [100 km]−1 [3 h]−1, shaded] at 925 hPa for LT (left panels) and OT (right panels) at: (a, c) T− 0; and (c, d) T + 24.
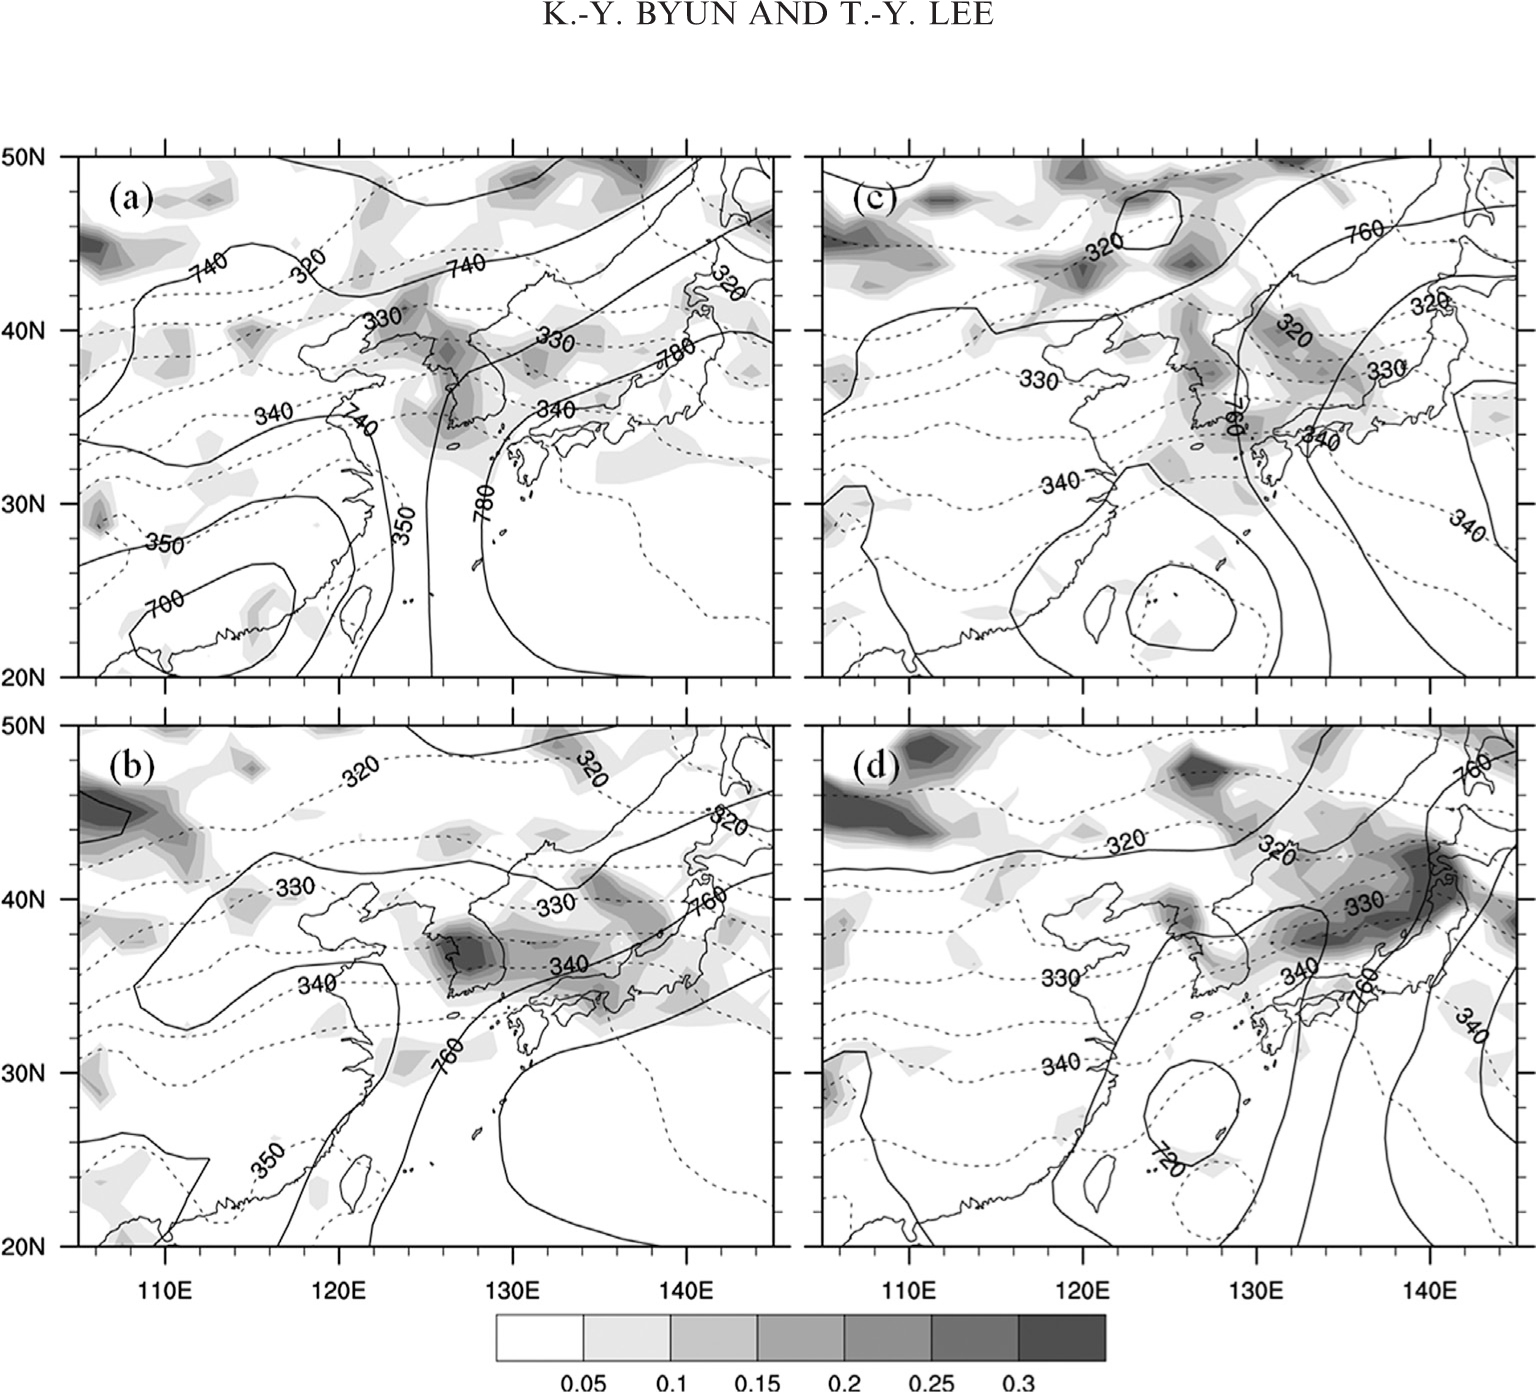
Fig. 14.
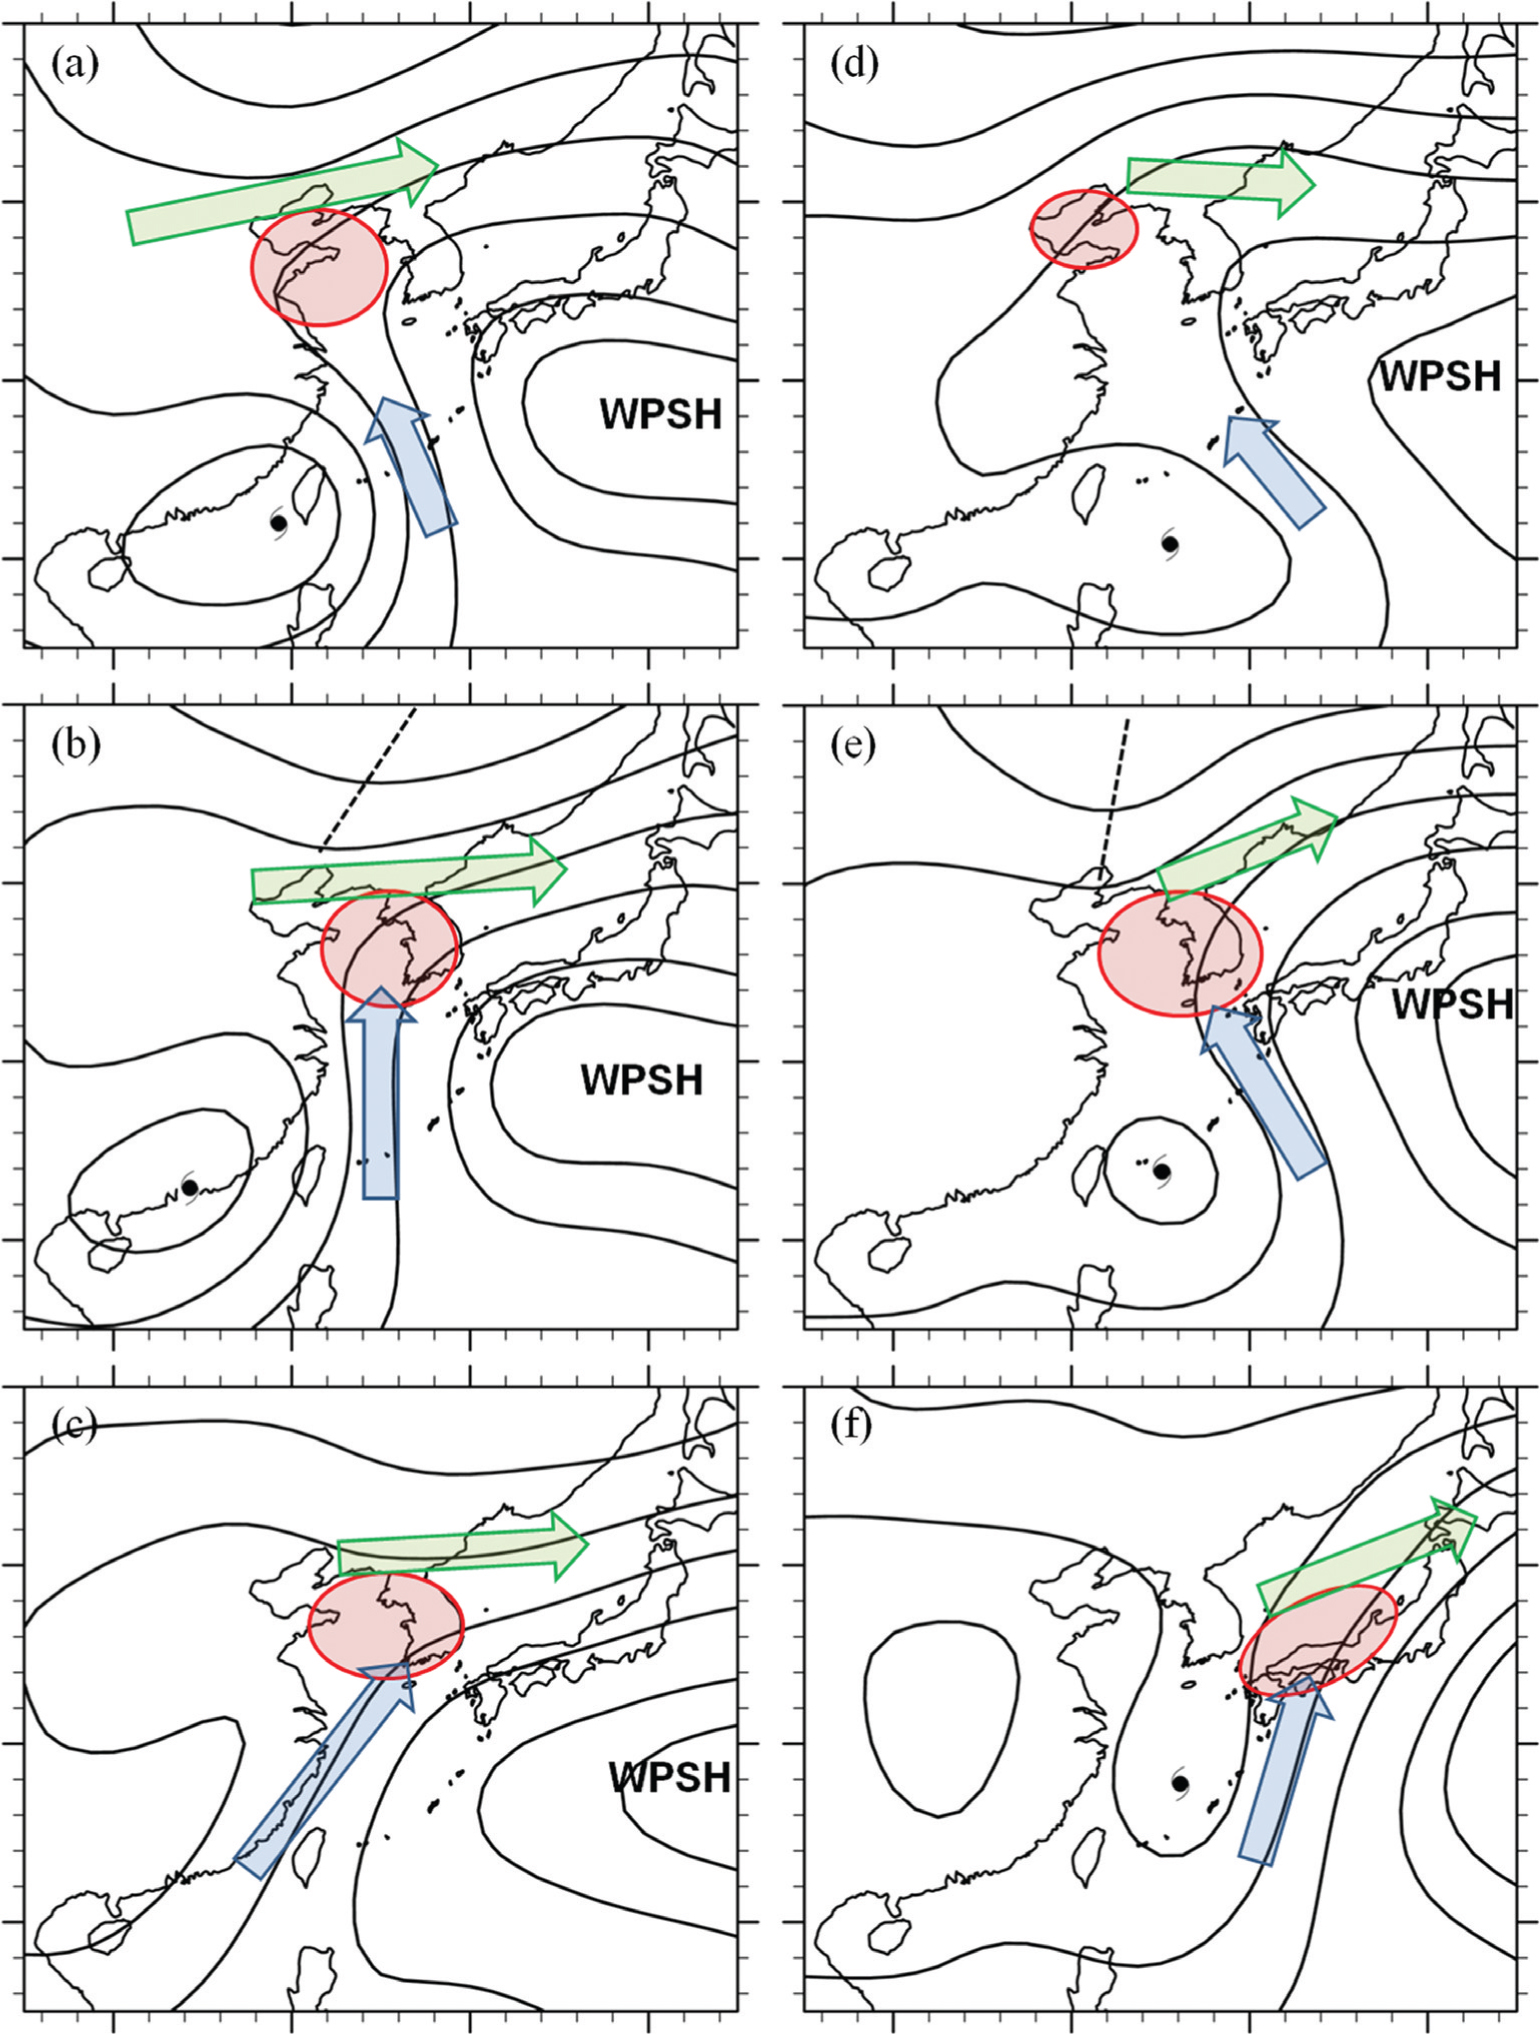
Conceptual models of synoptic-scale environment associated with HR over the Korean peninsula occurring with remote TCs for LT (left panels) and OT (right panels) at: (a, d) T− 24; (b, e) T− 0; and (c, f) T + 24. The symbols indicate smoothed 850 hPa geopotential height (black line), LLJ (blue arrow), ULJ (green arrow), low-level convergence and high-CIMFC (red area), and synoptic-scale trough (dashed line).