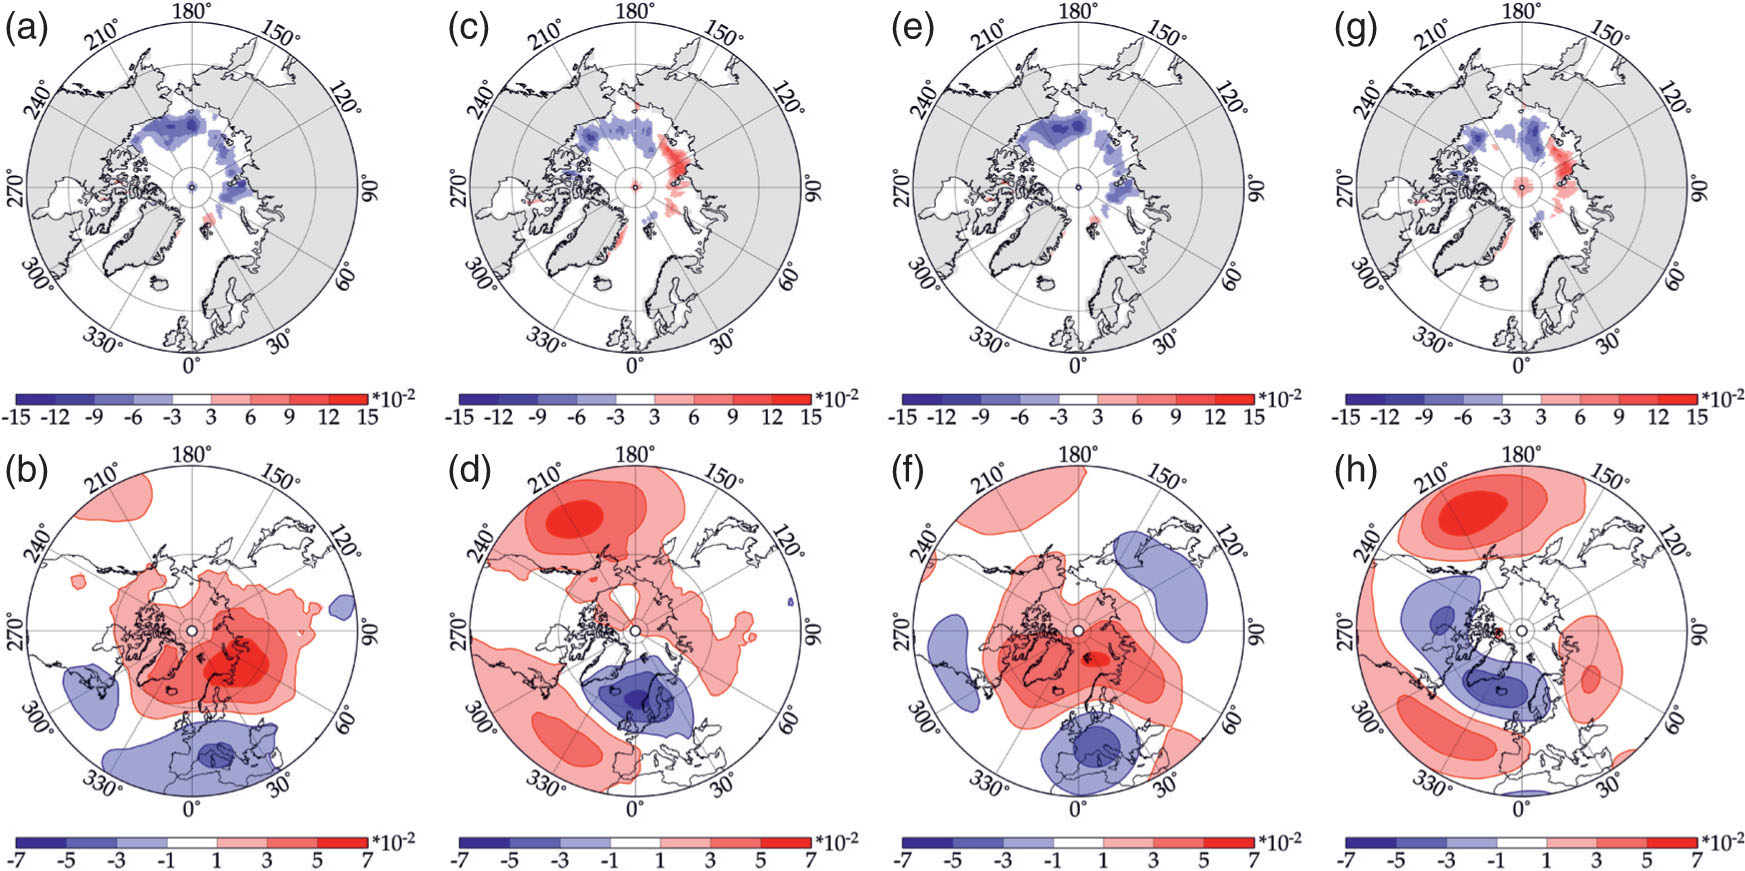
Fig. 1.
Standard deviation of late summer HadISST1 sea ice concentration August/September (2001–2010) and the Siberian domain (blue) used in correlations of atmospheric variables with sea ice concentration.
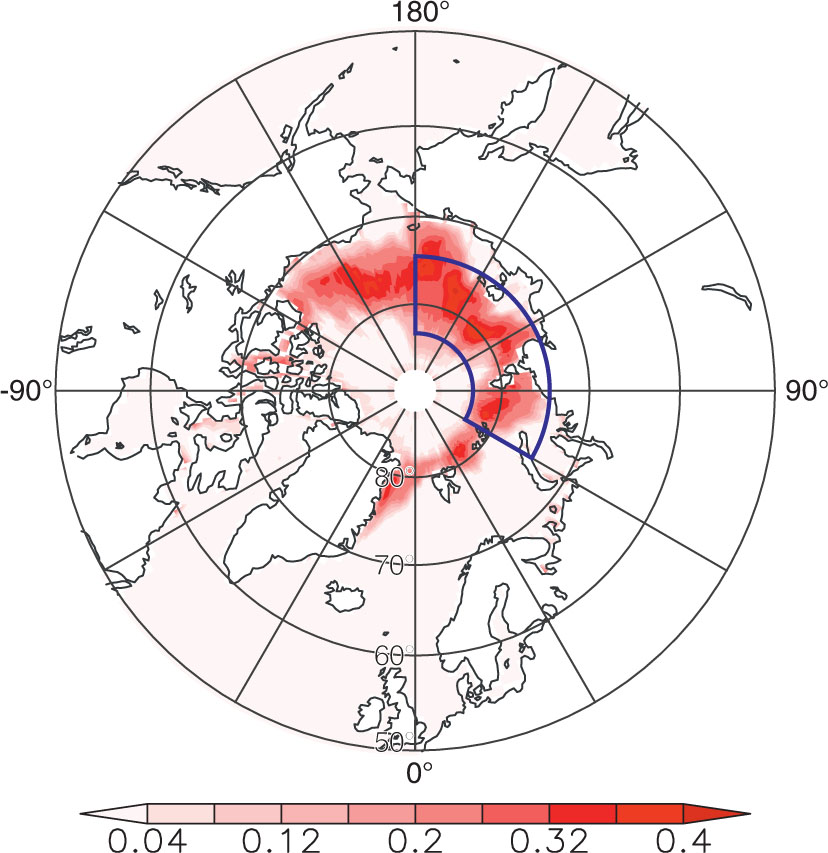
Fig. 2.
(a) ERA-Interim 500 hPa geopotential height differences (103 gpm) between low (2001–2010) and high (1990–2000) ice phases for winter (DJF), (b) same for mean sea level pressure (hPa). Statistical significance with a 90% confidence level is delineated by black contour.
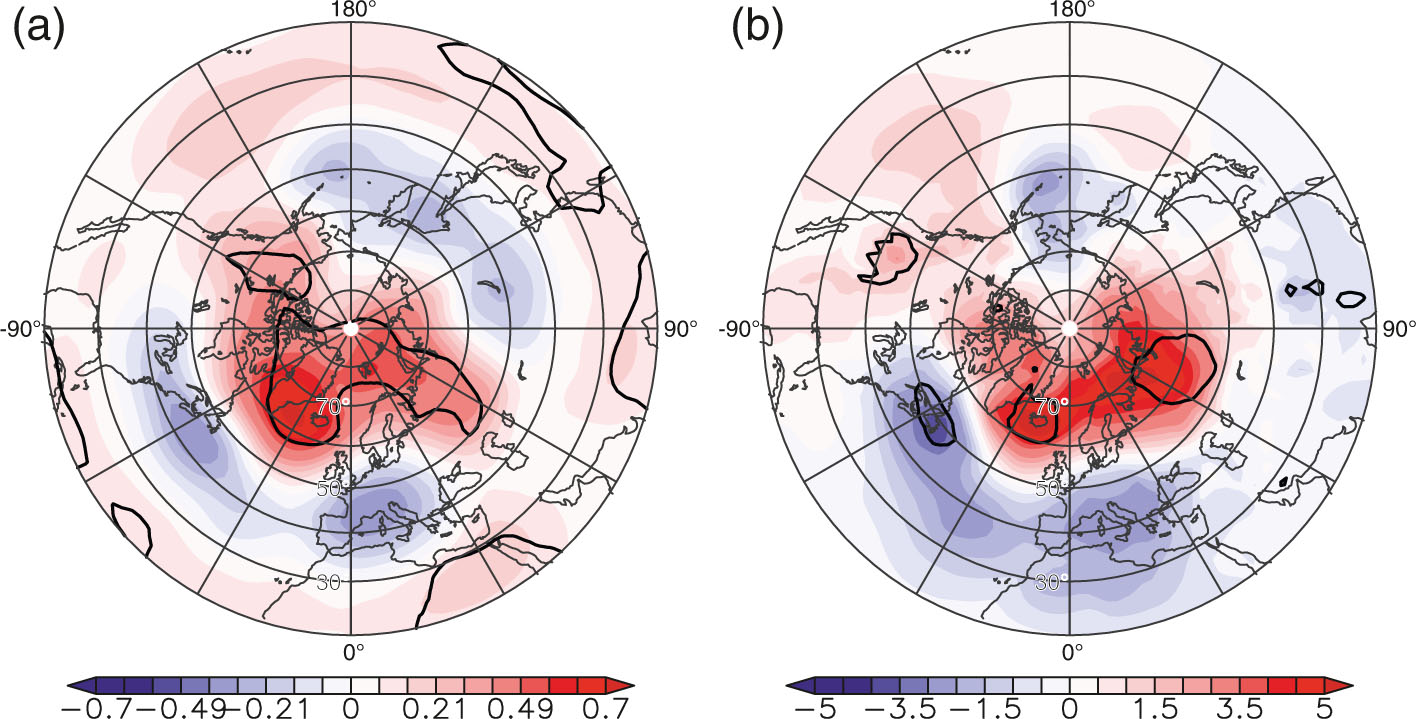
Fig. 3.
First (a, b and e, f) and second pair (c, d and g, h) of coupled patterns obtained by the maximum covariance analysis (MCA) of HadISST1 sea ice concentration in August/September with ERA-Interim sea level pressure and 500 hPa geopotential height fields in autumn (SON) 1989–2010. Upper row displays the sea ice concentration anomaly maps. Lower row contains the corresponding anomaly maps for mean sea level pressure (b, d) and 500 hPa geopotential heights (f, h).
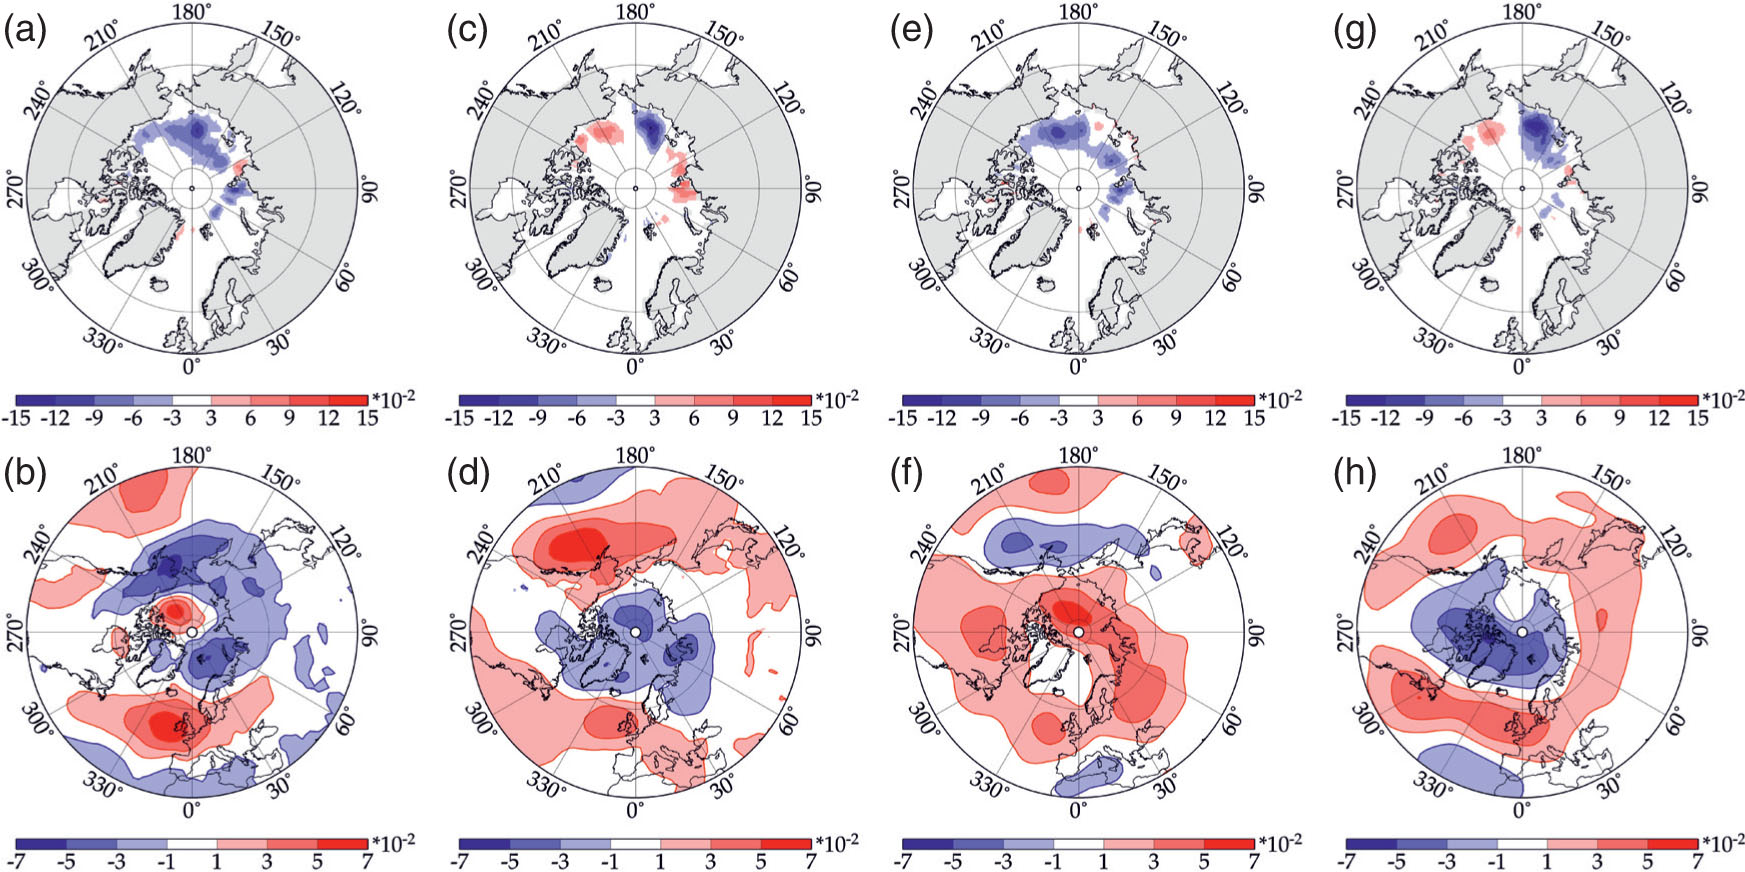
Fig. 4.
Height–time cross sections of ERA-Interim data averaged over the Siberian domain. (a–c) static stability (10–3 km–1), (d–f) Eady growth rates (day–1) and (g–i) meridional heat flux (Kms–1) on baroclinic time scales (2.5–6 days) for September–December for (a, d, g) 1989–1999, (b, e, h) 2000–2009 and (c, f, i) as difference of 2000–2009 minus 1989–1999. Statistical significance with a 90% confidence level is delineated by black contour.
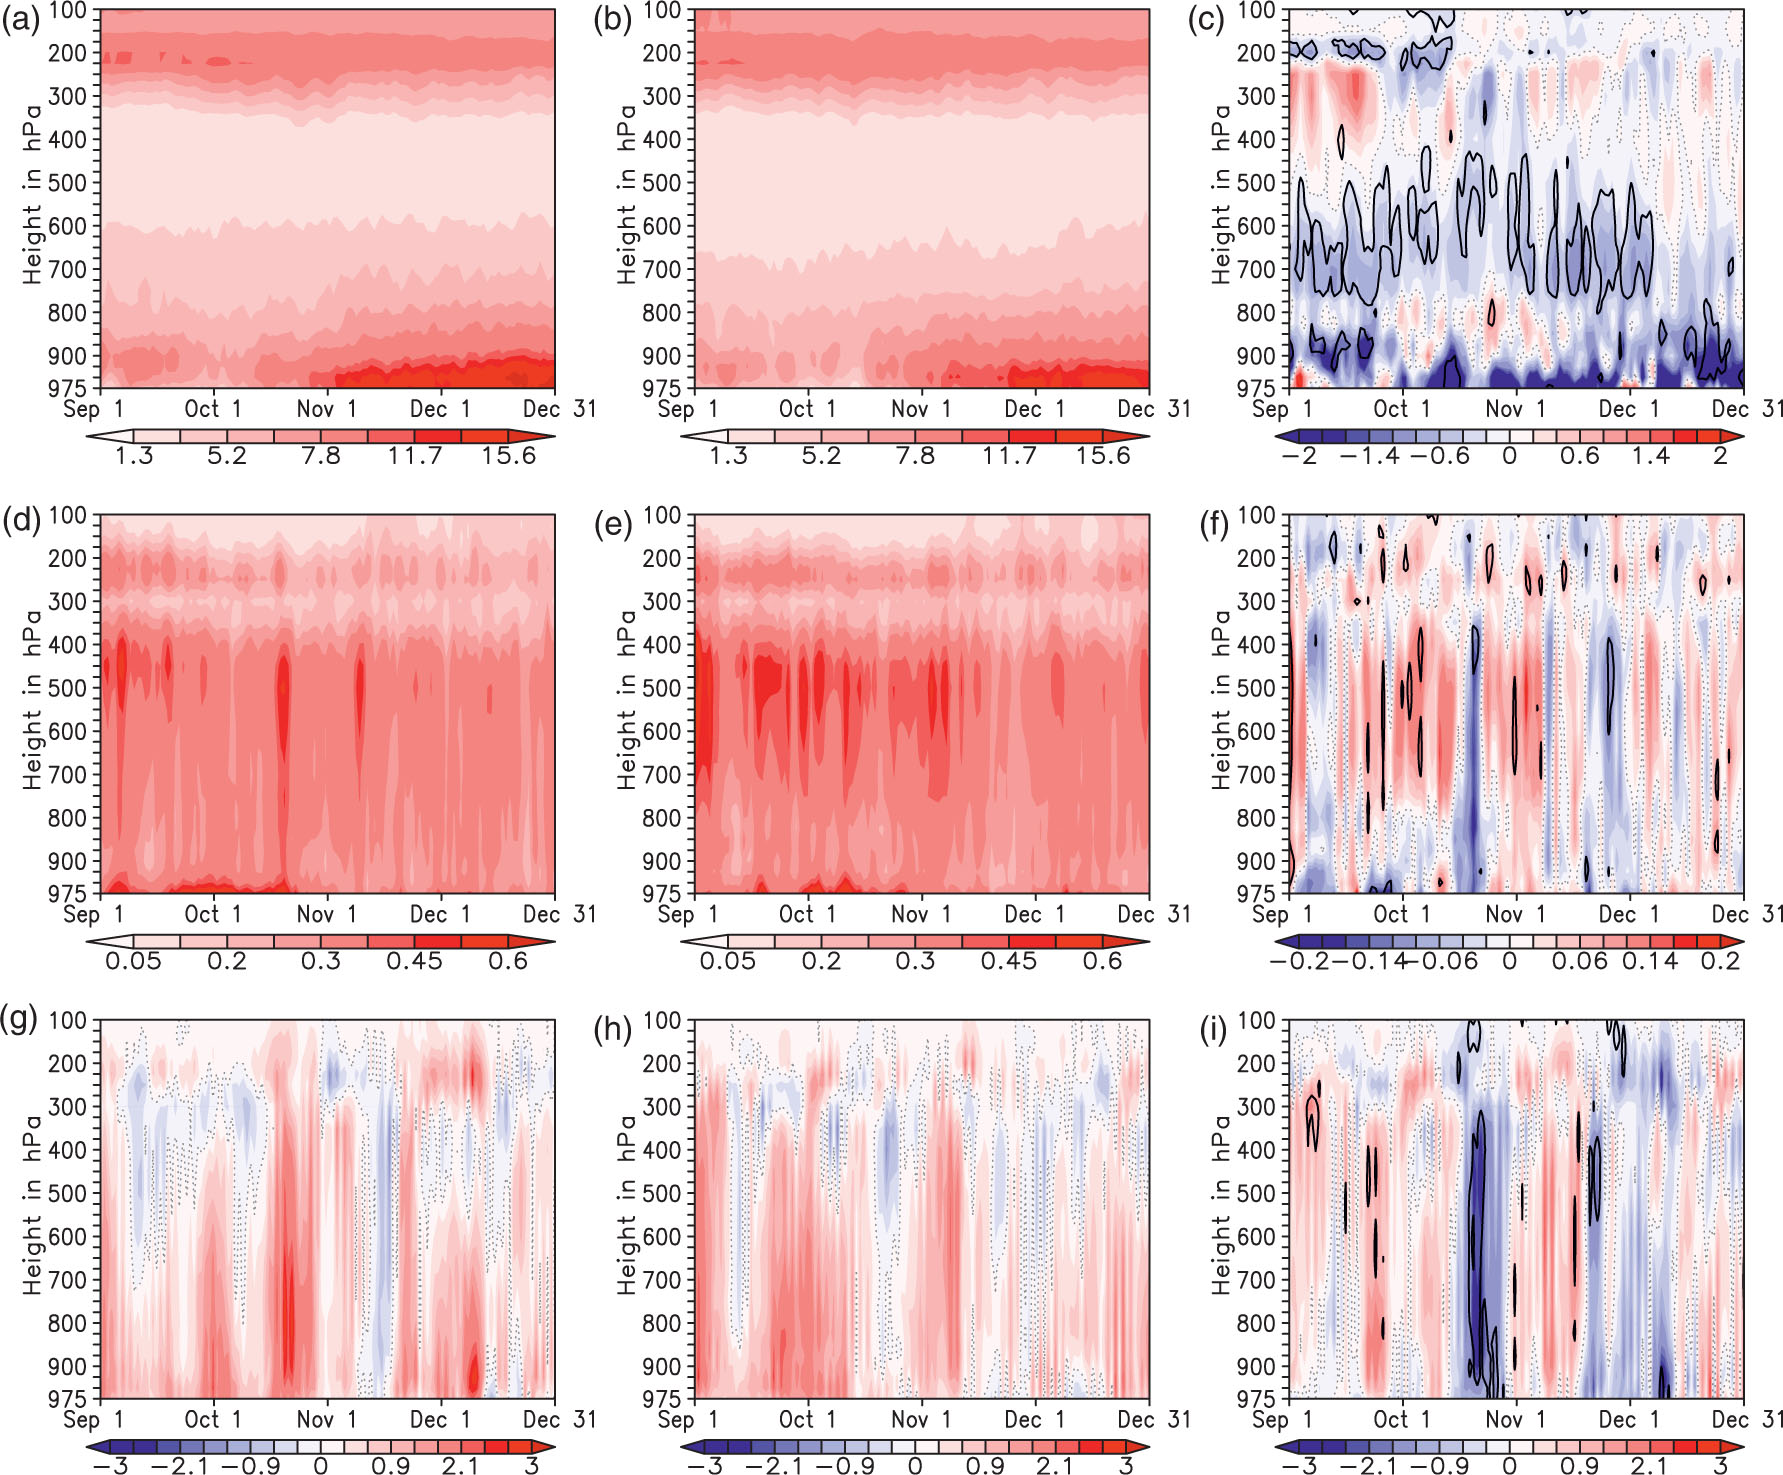
Fig. 5.
Correlation coefficients of winter (DJF) 2001–2010 atmospheric ERA-Interim data with preceding late summer (AS) HadISST1 sea ice concentration in the Siberian domain. Zonally averaged (a) temperature, (b) vertical static stability and (c) Eady growth rates. Statistical significance with a 90% confidence level is delineated by black contour.
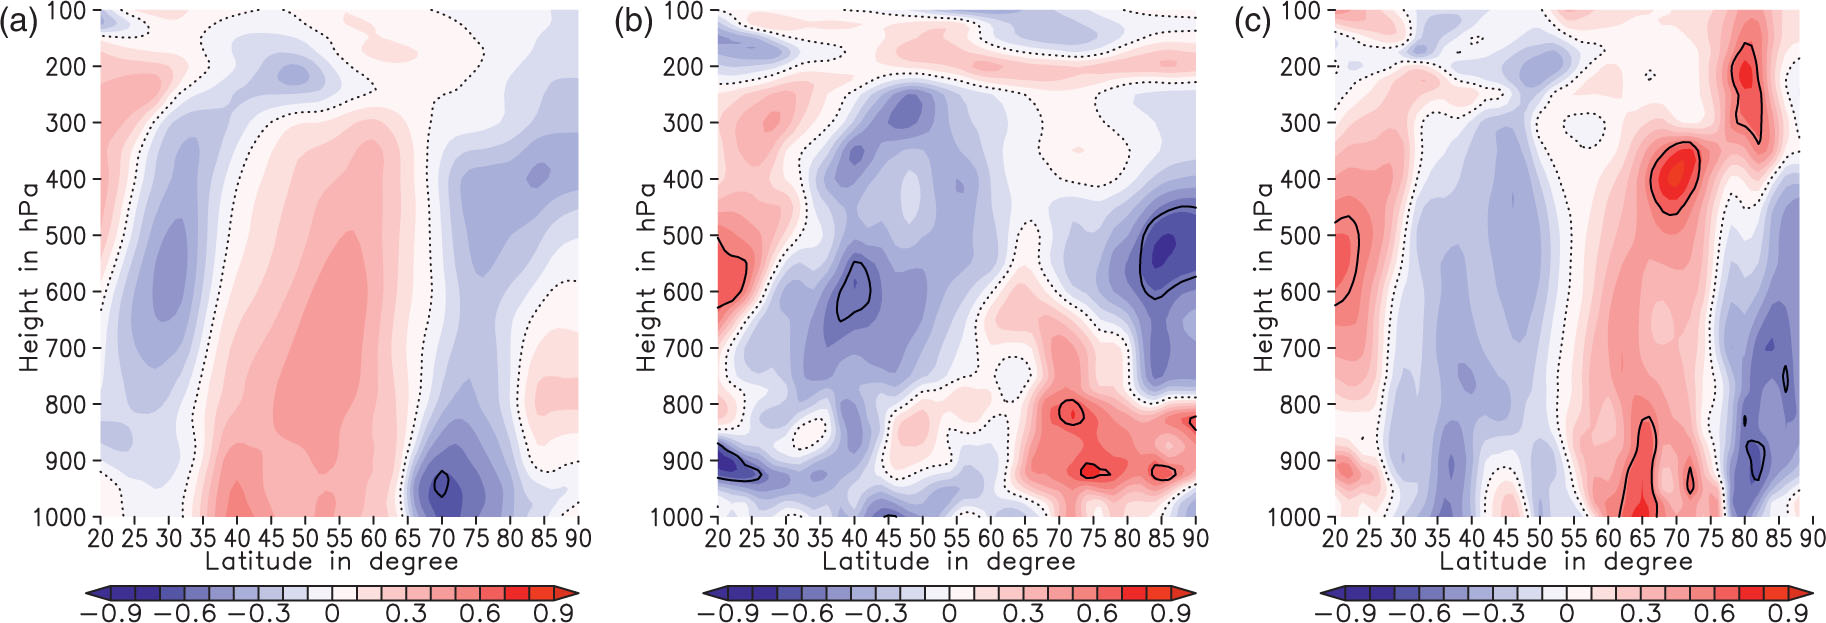
Fig. 6.
Correlation coefficients of winter (DJF) ERA-Interim transient meridional heat fluxes with preceding late summer (AS) HadISST1 sea ice concentration in the Siberian domain. (a) Baroclinic scales (2.5–6 days) 1990–2000, (b) planetary scales (10–90 days) 1990–2000, (c) baroclinic scales (2.5–6 days) 2001–2010 and (d) planetary scales (10–90 days) 2001–2010. Statistical significance with a 90% confidence level is delineated by black contour.
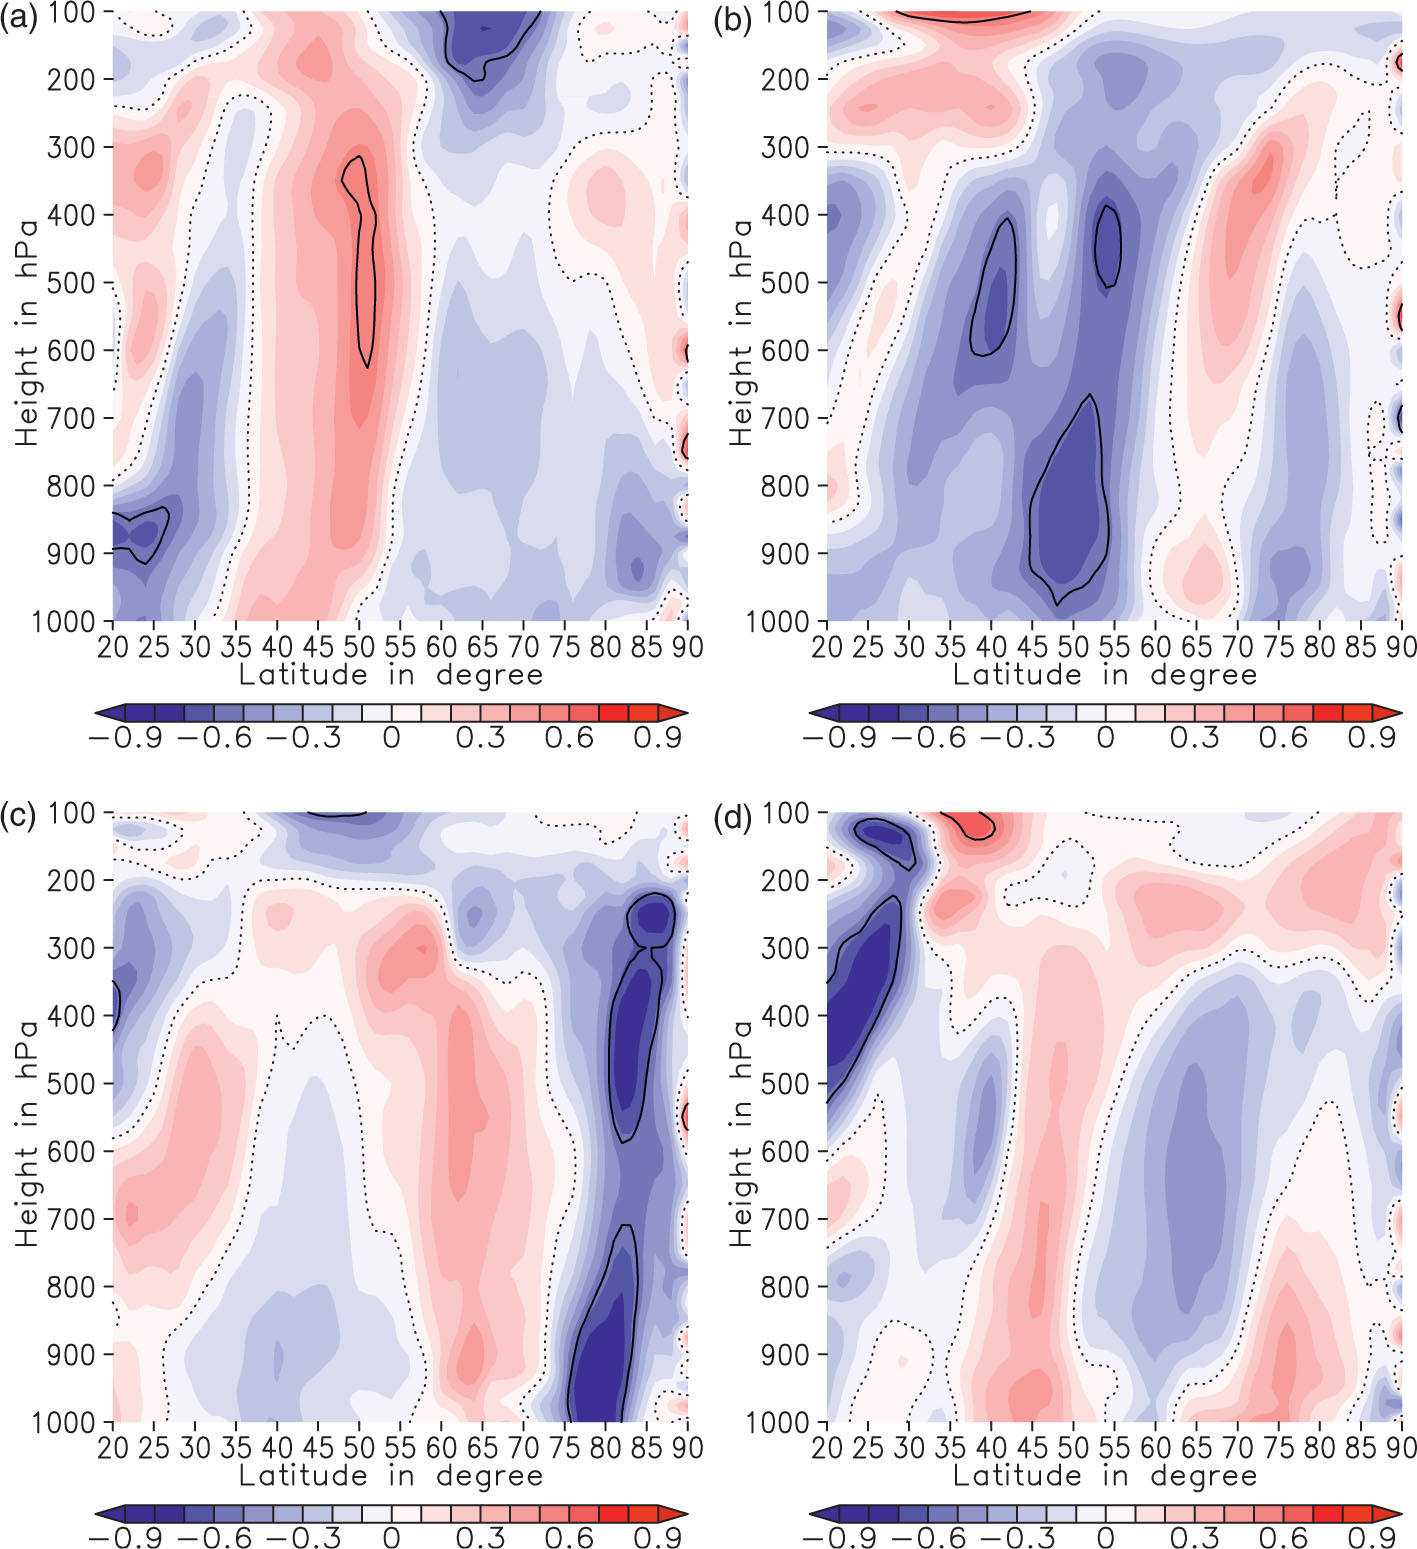
Fig. 7.
Winter (DJF) ERA-Interim EP flux vectors (m2s–2) and their magnitude for time scales 10–90 days. (a) 1990–2000, (b) 2001–2010 and (c) differences 2001–2010 minus 1990–2000. Colours display the magnitude, arrows describe the EP vector propagation. Statistical significance with a 90% confidence level is delineated by black contour.
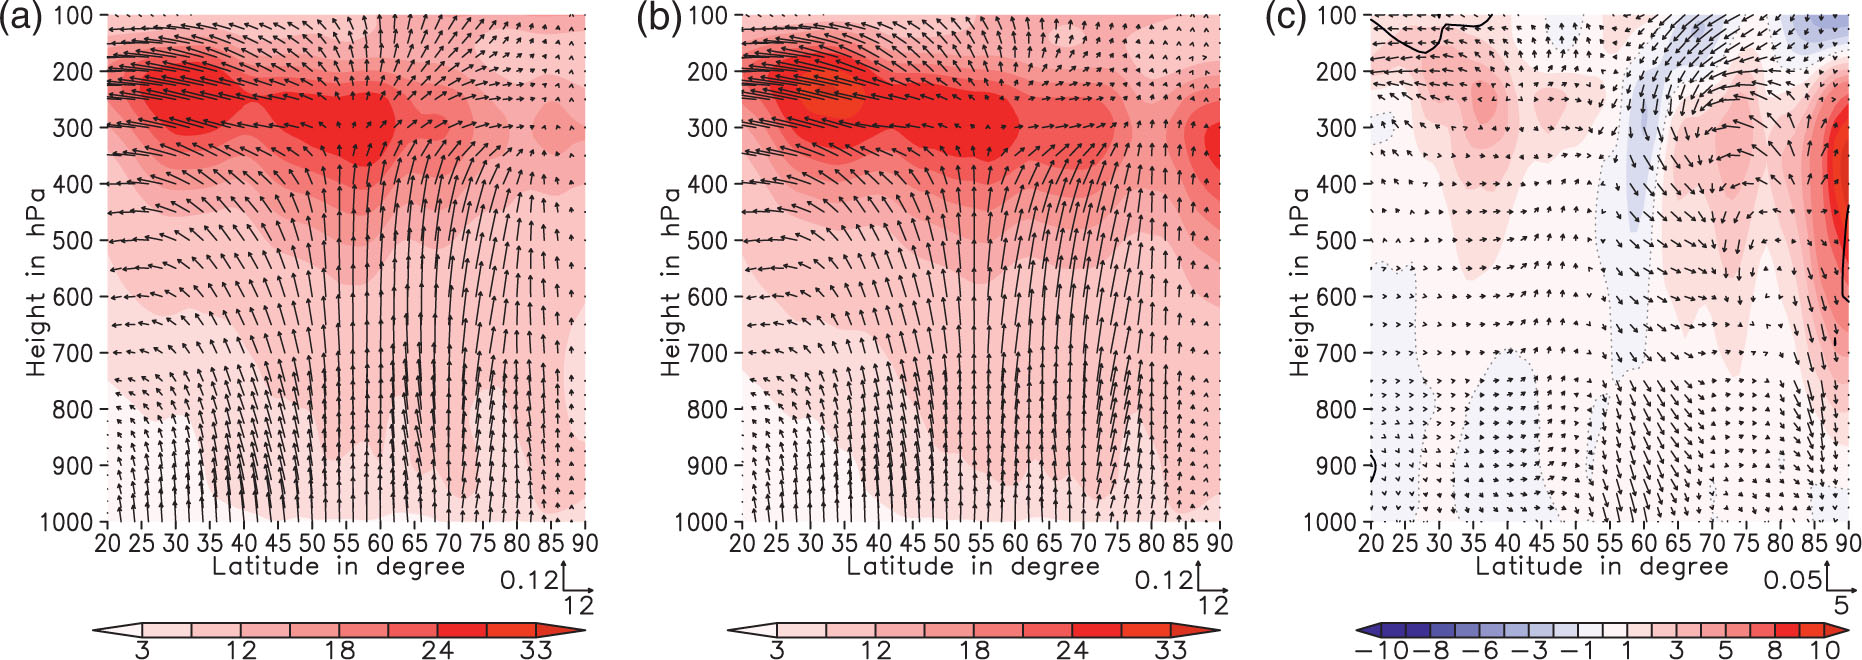
Fig. 8.
Divergence of winter (DJF) ERA-Interim EP-Fluxes (10–6 ms–2) for time scales 10–90 days as difference (2001–2010) minus (1990–2000) (a) at 850 hPa, (b) 500 hPa and (c) 200 hPa. Statistical significance with a 90% confidence level is delineated by black contour.
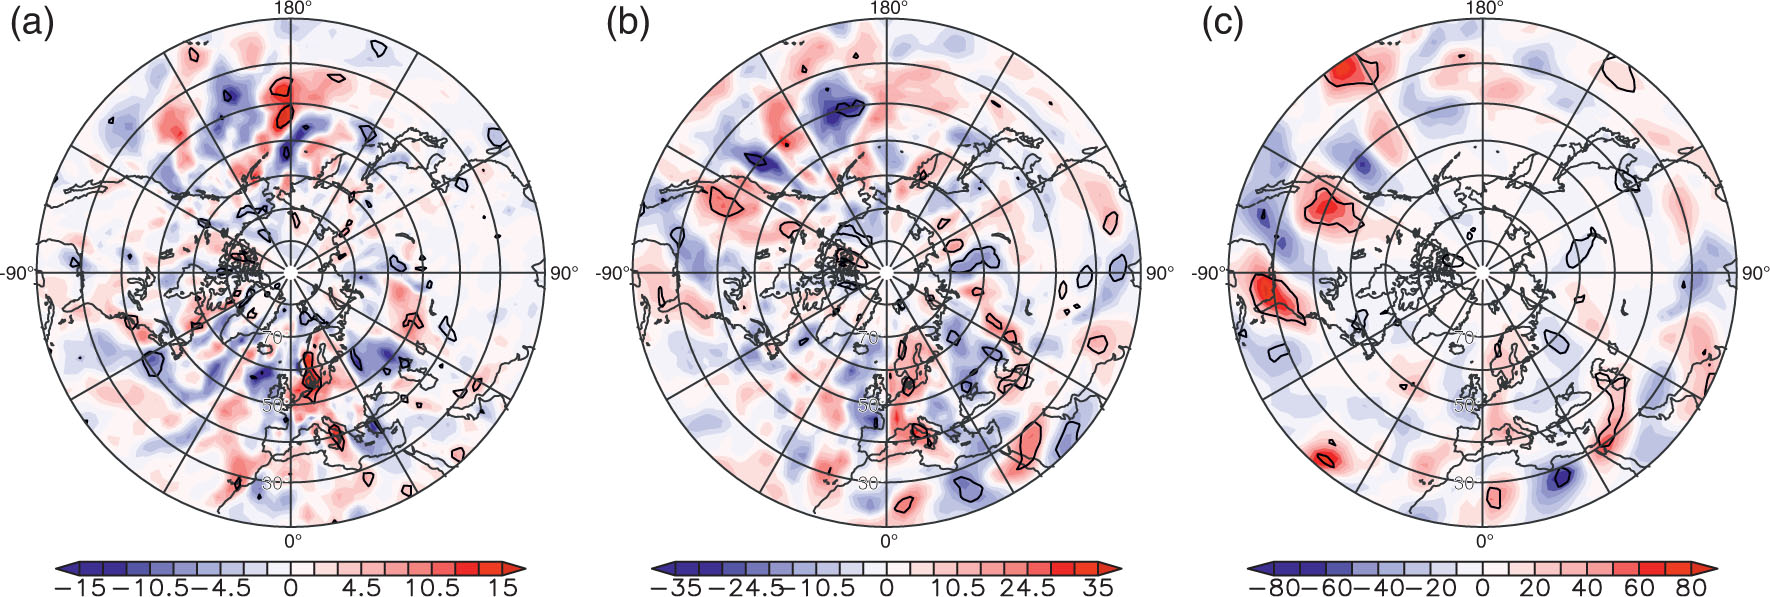
Fig. 9.
First (a, b and e, f) and second pair (c, d and g, h) of coupled patterns obtained by the MCA of HadISST1 sea ice concentration in August/September with ERA-Interim sea level pressure and 500 hPa geopotential height fields in winter (DJF) 1989–2010. Upper row displays the sea ice concentration anomaly maps. Lower row contains the corresponding anomaly maps for mean sea level pressure (b, d) and 500 hPa geopotential heights (f, h).