
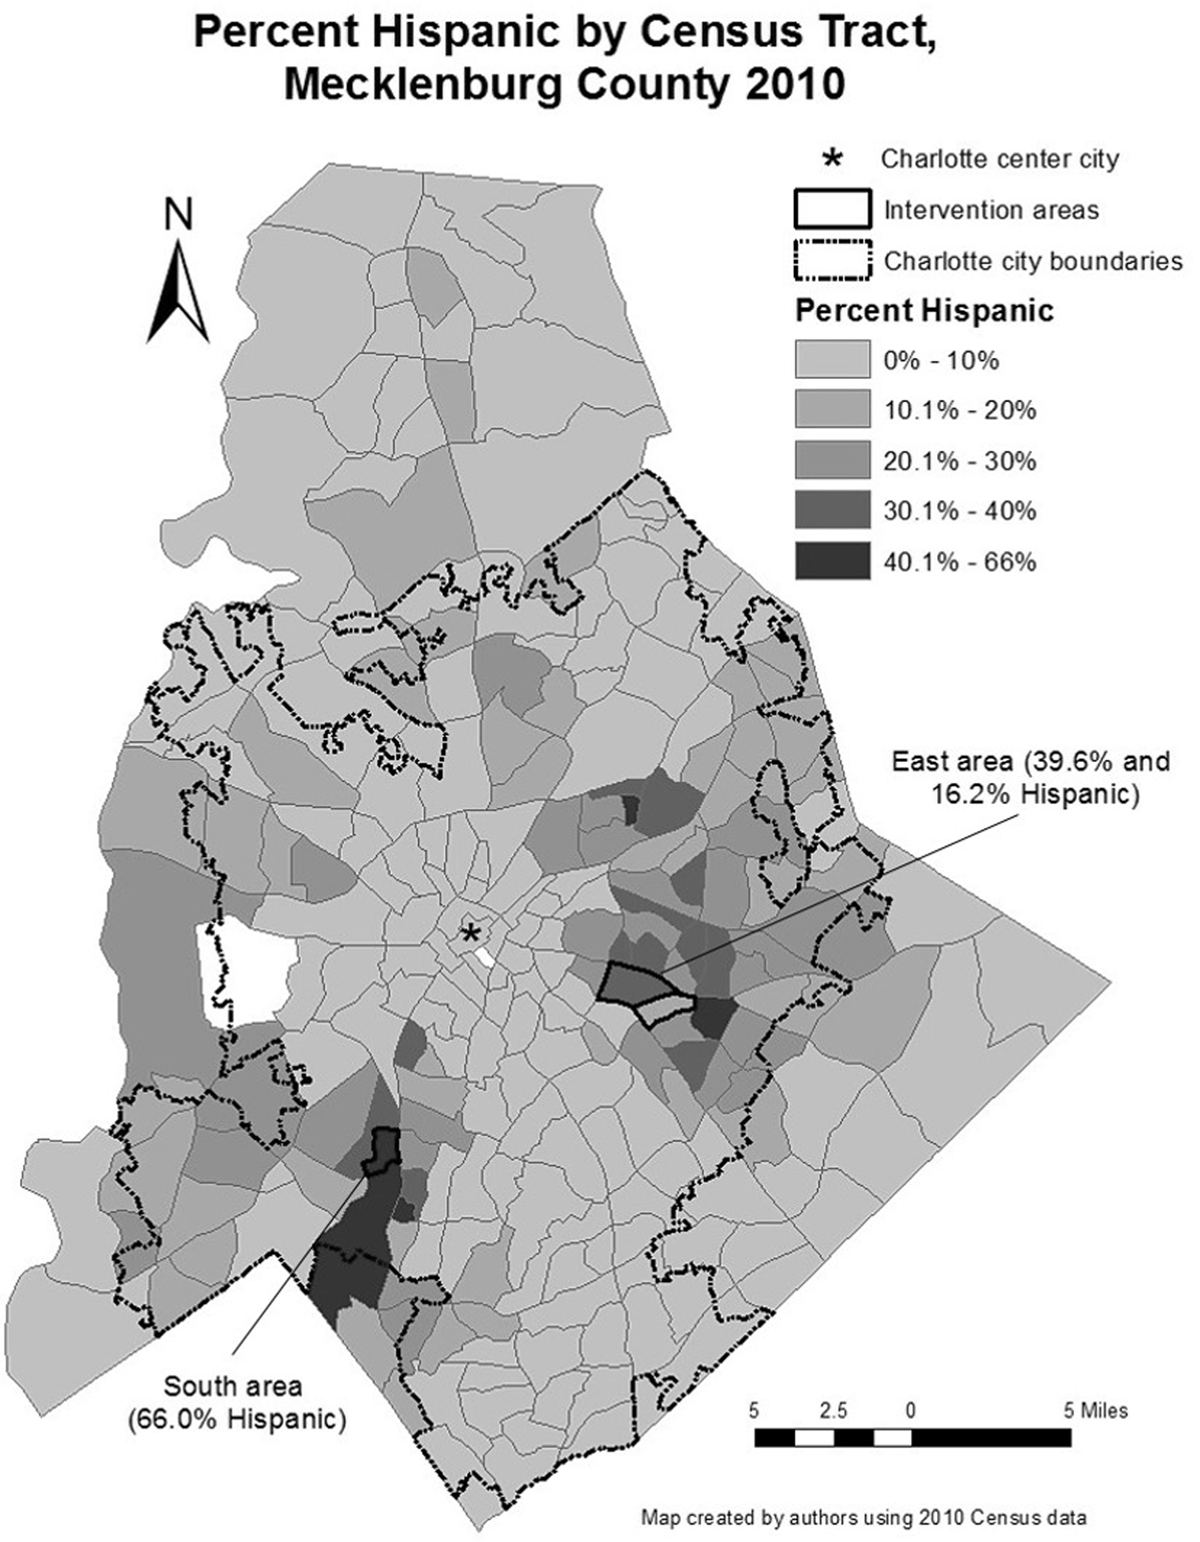
Figure 1
Map of Charlotte-Mecklenburg with Percent Hispanic by Census Tract and Intervention Neighborhoods.
Note: Decennial Census data was used because it is more accurate and closer to reality on the ground at the time project selected target neighborhoods than annual ACS estimates.
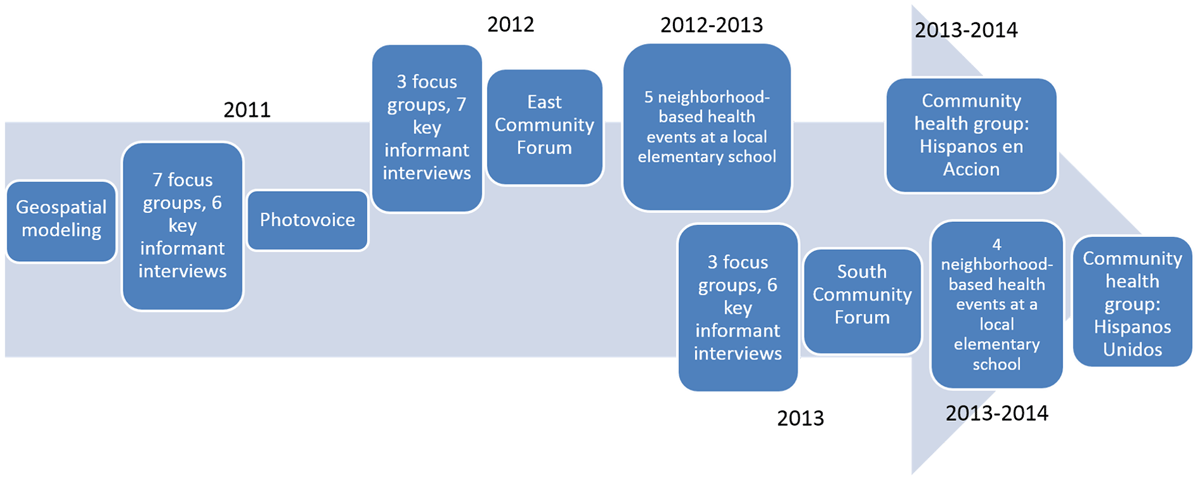
Figure 2
Overview and Timeline of Study Methods and Health Groups.
Table 1
Overview of How We Facilitated the Four Stages of Capacity-Building.
| PHASES | EAST GROUP, HISPANOS EN ACCIÓN (HEA) | SOUTH GROUP, HISPANOS UNIDOS (HU) |
|---|---|---|
| 1: Participation in/using a service provided |
|
|
| 2: Joining a community interest group facilitated by researchers |
|
|
| 3: Transitioning to leadership roles within the group |
|
|
| 4: Becoming independent of the research team |
|
|
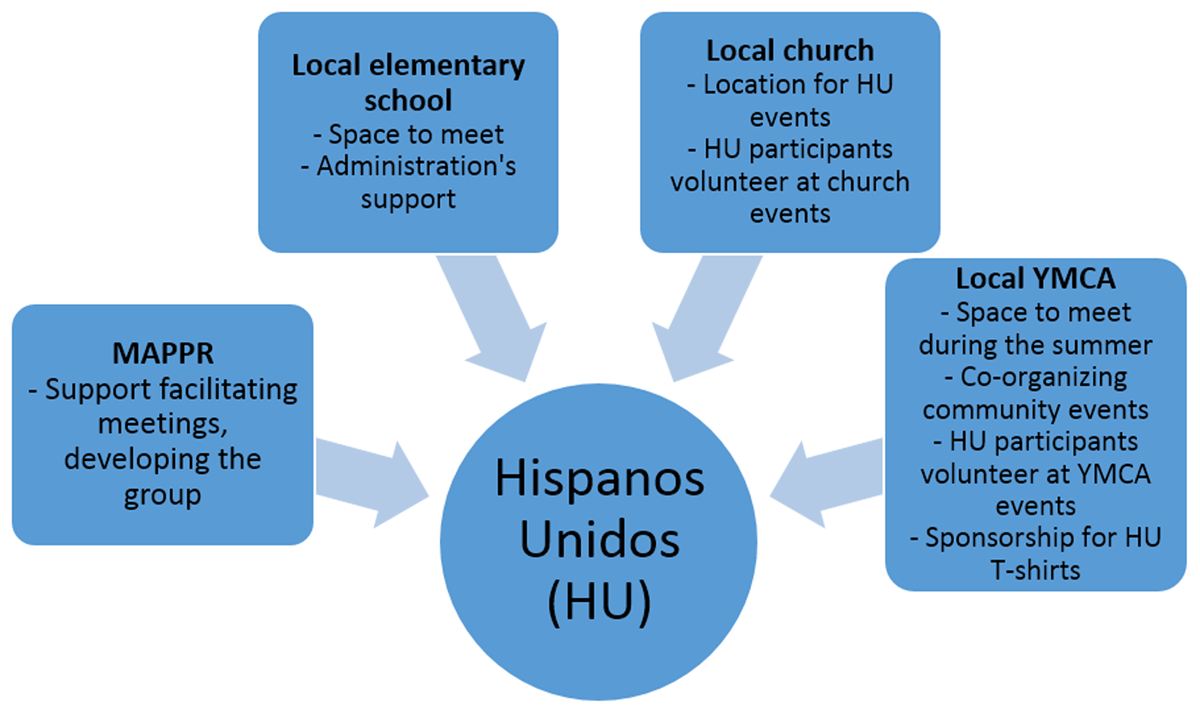
Figure 3
Hispanic Unidos Partnerships.