
Table 1
Descriptive Statistics of Both Samples.
| Variable | Needs Assessment (n = 44) | Pre-Behavioral Training (n = 80) | ||
|---|---|---|---|---|
| n | Percent | n | Percent | |
| Gender | ||||
| Male | 13 | 29.50 | 30 | 37.50 |
| Female | 30 | 68.20 | 50 | 62.50 |
| Transgender | 1 | 2.30 | 0 | 0 |
| Household Income | ||||
| Less than $24,999 | 14 | 31.80 | 24 | 30.00 |
| $25,000 to $49,999 | 10 | 22.70 | 23 | 28.80 |
| $50,000 to $99,999 | 14 | 31.80 | 16 | 20.00 |
| More than $100,000 | 6 | 13.60 | 17 | 21.30 |
| Ethnicity | ||||
| Hispanic or Latino | 2 | 4.50 | 6 | 7.50 |
| Not Hispanic or Latino | 41 | 93.20 | 74 | 92.50 |
| Race | ||||
| Black or African American | 5 | 11.40 | 15 | 18.80 |
| White | 38 | 86.40 | 65 | 81.30 |
| Highest education completed | ||||
| High school | 9 | 20.50 | 11 | 13.80 |
| Some college/technical school | 32 | 72.70 | 65 | 81.30 |
| Bachelors/4-year college degree | 2 | 4.50 | 4 | 5.0 |
| Graduate school | 1 | 2.30 | 0 | 0 |
| Prior participation in 4-H Behavioral Management Training | ||||
| Yes | 27 | 61.40 | 41 | 52.60 |
| No | 17 | 38.60 | 37 | 47.70 |
| Variable | n | M (SD) | n | M (SD) |
| Age (years) | 44 | 20.66 (5.30) | 78 | 19.81 (1.38) |
| Years of experience as camp staff | 44 | 5.27 (4.07) | 79 | 4.80 (2.76) |
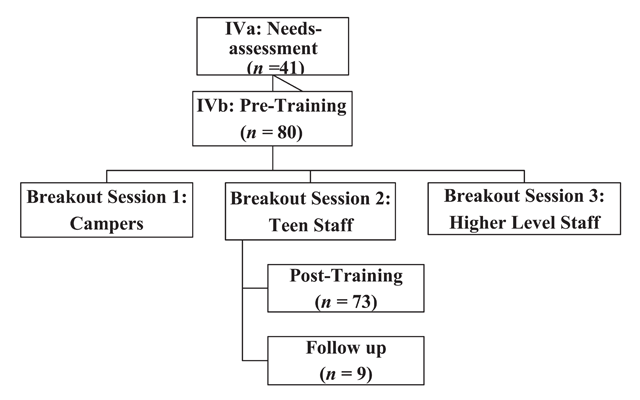
Figure 1
Flow chart of each time point and the number of participants.
Table 2
Pre- and Post-Training Assessment Results.
| Measure | Pre-Training M (SD) | Post-Training M (SD) | t | p |
|---|---|---|---|---|
| PSI: Confidence | 24.91 (8.19) | 24.21 (12.88) | 1.02 | .31 |
| PSI: Approach-Avoidance | 45.26 (10.19) | 41.62 (12.88) | 4.14 | <.001 |
| PSI: Personal Control | 16.29 (3.38) | 15.36 (4.19) | 2.66 | .01 |
| PST-KQ | .67 (.18) | .75 (.18) | –3.68 | <.001 |
[i] Note: PSI = Problem Solving Inventory; PST-KQ = Problem Solving Therapy Knowledge Questionnaire.