
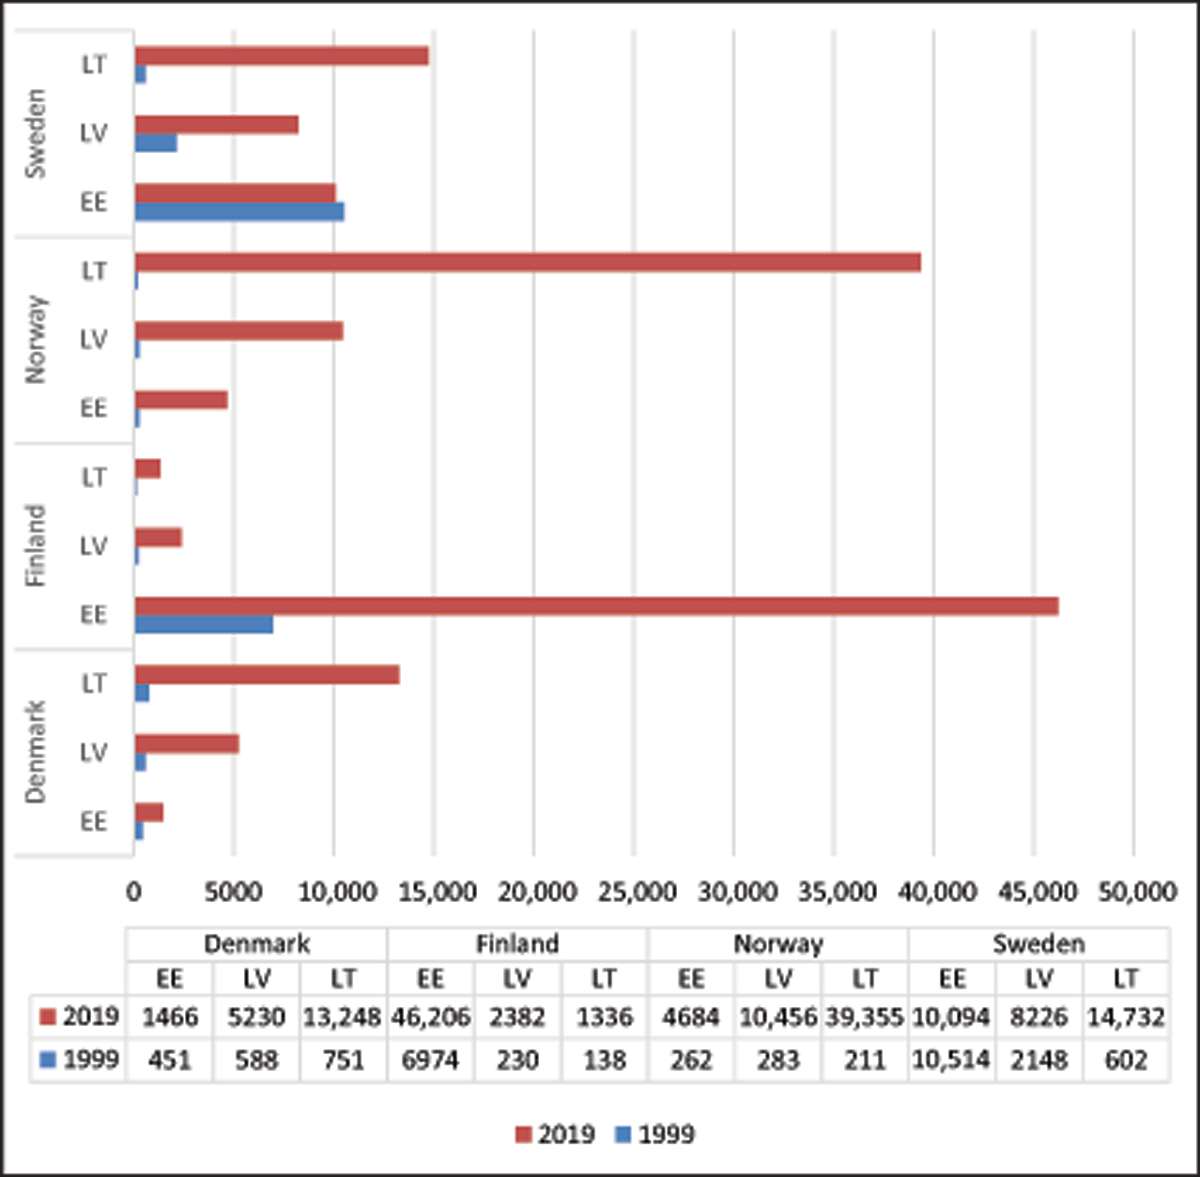
Figure 1
Population 1 January by reporting country, birthplace and time. 1999 and 2019. Birthplace: LT—Lithuania, LV—Latvia, EE—Estonia.
Source: Nordic Statistics database 2019.
Table 1
Comparison of the statistics and the survey sample of the Latvian emigrants in four Nordic countries: gender and age (2014).
| Norway | Statistics N* | Sample N** | Statistics % | Sample % | |
|---|---|---|---|---|---|
| Gender | Male | 4685 | 221 | 60 | 41 |
| Female | 3166 | 324 | 40 | 59 | |
| Age | 15–24 | 1033 | 64 | 13 | 12 |
| 25–34 | 3421 | 220 | 44 | 40 | |
| 35–54 | 3132 | 239 | 40 | 44 | |
| 55+ | 265 | 22 | 3 | 4 | |
| Total (15+) | 7851 | 545 | 100 | 100 | |
| Sweden | |||||
| Gender | Male | 2202 | 145 | 41 | 38 |
| Female | 3187 | 238 | 59 | 62 | |
| Age | 15–24 | 826 | 44 | 15 | 11 |
| 25–34 | 1904 | 145 | 35 | 38 | |
| 35–54 | 1742 | 151 | 32 | 39 | |
| 55+ | 917 | 43 | 17 | 11 | |
| Total (15+) | 5389 | 383 | 100 | 100 | |
| Denmark | |||||
| Gender | Male | 1776 | 85 | 44 | 28 |
| Female | 2231 | 221 | 56 | 72 | |
| Age | 15–24 | 1295 | 93 | 32 | 30 |
| 25–34 | 1620 | 127 | 40 | 42 | |
| 35–54 | 952 | 79 | 24 | 26 | |
| 55+ | 140 | 7 | 3 | 2 | |
| Total (15+) | 4007 | 306 | 100 | 100 | |
| Finland | |||||
| Gender | Male | 566 | 52 | 43 | 33 |
| Female | 756 | 105 | 57 | 67 | |
| Age | 15–24 | 242 | 20 | 18 | 13 |
| 25–34 | 486 | 48 | 37 | 31 | |
| 35–54 | 501 | 76 | 38 | 48 | |
| 55+ | 93 | 13 | 7 | 8 | |
| Total (15+) | 1322 | 157 | 100 | 100 | |
[i] * Statistics: Population as of 1 January 2014. Source: National statistical institutes.
** Survey sample: The Latvian emigrant survey organised from August to October 2014.
Table 2
Comparison of the statistics and the survey sample of Latvian emigrants: host countries, gender and age (2014).
| Host country | Statistics N* | Sample N** | Statistics % | Sample % |
|---|---|---|---|---|
| Norway | 7851 | 545 | 42 | 39 |
| Sweden | 5389 | 383 | 29 | 28 |
| Denmark | 4007 | 306 | 22 | 22 |
| Finland | 1322 | 157 | 7 | 11 |
| Total | 18,569 | 1391 | 100 | 100 |
| Gender | ||||
| Male | 9229 | 503 | 50 | 36 |
| Female | 9340 | 888 | 50 | 64 |
| Age | ||||
| 15–24 | 3396 | 221 | 18 | 16 |
| 25–34 | 7431 | 541 | 40 | 39 |
| 35–54 | 6327 | 545 | 34 | 39 |
| 55+ | 1415 | 84 | 8 | 6 |
[i] Note: * Statistics: Population as of 1 January 2014. Source: National statistical institutes.
** Survey sample: The Latvian emigrant survey organised from August to October 2014.
Table 3
Empirical measures of attachment to the host country and the country of origin (factor loadings).
| Attachment to host country | |
|---|---|
| Feel closer ties to host country (1_yes) | 0,716 |
| Feel affiliated with the people of the host country (1_yes) | 0,706 |
| Follow the news of the host country (1_yes, regularly) | 0,652 |
| Follow the culture of the host country (1_yes, regularly) | 0,573 |
| Have close friends among the natives in the host country (1_yes) | 0,502 |
| Know most people in the neighbourhood in the host country (1_yes) | 0,461 |
| Eigenvalue | 2,229 |
| Variance explained (%) | 37% |
| Attachment to country of origin | |
| Feel closer ties to Latvia (1_yes) | 0,678 |
| Feel affiliated with the Latvian people (1_yes) | 0,617 |
| Follow the Latvian culture (1_yes, regularly) | 0,604 |
| Follow the Latvian news (1_yes, regularly) | 0,602 |
| Visit Latvia at least every half year (1_yes) | 0,522 |
| Have close friends in Latvia (1_yes) | 0,241 |
| Eigenvalue | 1,899 |
| Variance explained (%) | 32% |
Table 4
Average degree of attachment to the host country and the country of origin by cluster.
| 1 Bi-nationals (N = 397) | 2 Separated (N = 410) | 3 Footloose (N = 265) | 4 Settlers (N = 319) | |
|---|---|---|---|---|
| Attachment to the country of destination | ||||
| Feel closer ties to the host country (%) | 87 | 20 | 30 | 92 |
| Feel affiliated with the people of the host country (%) | 77 | 16 | 13 | 78 |
| Follow the news of the host country (%) | 83 | 26 | 23 | 76 |
| Follow the culture of the host country (%) | 50 | 3 | 2 | 28 |
| Have close friends among the natives in the host country (%) | 74 | 36 | 29 | 80 |
| Know most people in the neighbourhood in the host country (%) | 43 | 13 | 12 | 55 |
| Attachment to the country of origin | ||||
| Feel closer ties to Latvia (%) | 92 | 94 | 39 | 34 |
| Feel affiliated with the Latvian people (%) | 83 | 85 | 28 | 23 |
| Follow the Latvian culture (%) | 51 | 31 | 3 | 6 |
| Follow the Latvian news (%) | 91 | 91 | 45 | 44 |
| Visit Latvia at least every half year (%) | 68 | 70 | 30 | 25 |
| Have close friends in Latvia (%) | 90 | 88 | 71 | 80 |
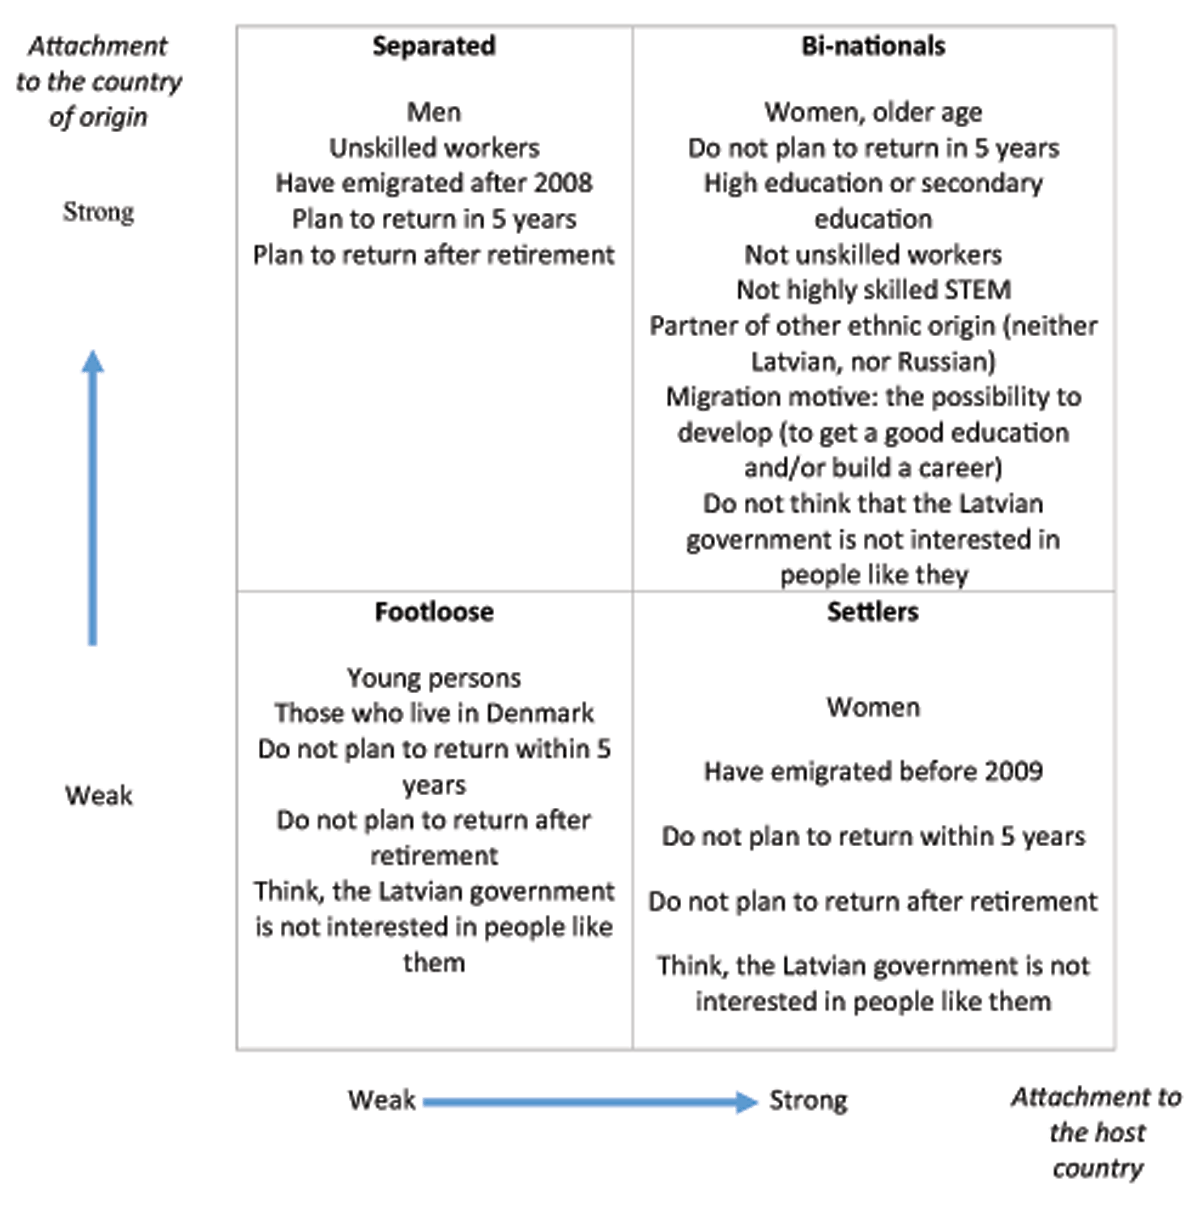
Figure 2
Summary of regression results: main determinants of cluster membership.
Table 5
Descriptive statistics of the dependent and independent variables (N = 1391).
| Total % | n | Norway % | Sweden % | Denmark % | Finland % | |
|---|---|---|---|---|---|---|
| Bi-nationals | 28 | 397 | 30 | 30 | 24 | 29 |
| Separated | 30 | 410 | 33 | 27 | 26 | 29 |
| Footloose | 19 | 265 | 18 | 18 | 24 | 16 |
| Settlers | 23 | 319 | 19 | 25 | 25 | 27 |
| Age (16–90; mean 35.27) | 35.27 | 35.70 | 37.73 | 30.54 | 37.02 | |
| Gender (1_female) | 64 | 888 | 59 | 62 | 72 | 67 |
| Norway | 39 | 545 | ||||
| Sweden | 28 | 383 | ||||
| Denmark | 22 | 306 | ||||
| Finland | 11 | 157 | ||||
| People with secondary education or lower | 22 | 305 | 23 | 21 | 23 | 18 |
| People with a professional education | 23 | 321 | 27 | 20 | 20 | 22 |
| People with a tertiary education | 51 | 714 | 47 | 55 | 53 | 55 |
| Highly skilled STEM | 21 | 297 | 21 | 27 | 17 | 15 |
| Have emigrated after 2008 | 66 | 914 | 72 | 59 | 66 | 60 |
| Students | 12 | 174 | 5 | 14 | 25 | 11 |
| ISCO group unskilled workers | 10 | 145 | 11 | 8 | 15 | 6 |
| Plan to return in 5 years | 20 | 282 | 24 | 17 | 17 | 19 |
| Plan to return after retirement | 21 | 296 | 27 | 18 | 18 | 18 |
| Do not plan to return | 19 | 265 | 14 | 22 | 21 | 25 |
| Partner other (neither Latvian, nor Russian) | 21 | 288 | 13 | 23 | 28 | 27 |
| Migration motive: financial problems | 13 | 188 | 18 | 12 | 10 | 10 |
| Migration motive: the possibility to develop (to get a good education and/or build a career) (1_yes) | 13 | 184 | 6 | 9 | 26 | 15 |
| Migration motive: get married or started to live together with foreigner (1_yes) | 11 | 158 | 7 | 20 | 12 | 13 |
| Think, that the Latvian government is not interested in people like me | 34 | 474 | 37 | 34 | 32 | 31 |
Table 6
Determinants of cluster membership: four logistic regression models.
| Bi-nationals | Separated | Footloose | Settlers | |||||
|---|---|---|---|---|---|---|---|---|
| B | Sig. | B | Sig. | B | Sig. | B | Sig. | |
| Age | 0.024 | 0.000 | –0.006 | 0.391 | –0.014 | 0.083 | –0.010 | 0.165 |
| Gender (1_female) | 0.304 | 0.052 | –0.556 | 0.000 | –0.144 | 0.384 | 0.502 | 0.005 |
| Norway | 0.282 | 0.188 | –0.157 | 0.491 | 0.029 | 0.910 | –0.233 | 0.327 |
| Sweden | 0.019 | 0.933 | –0.148 | 0.540 | 0.183 | 0.488 | –0.104 | 0.667 |
| Denmark | –0.176 | 0.460 | –0.264 | 0.299 | 0.540 | 0.045 | –0.110 | 0.666 |
| People with secondary education | 0.884 | 0.057 | –0.163 | 0.661 | –0.297 | 0.402 | –0.315 | 0.396 |
| People with a professional education | 0.582 | 0.215 | –0.107 | 0.777 | –0.006 | 0.986 | –0.428 | 0.255 |
| People with a tertiary education | 1.067 | 0.020 | –0.114 | 0.757 | –0.541 | 0.125 | –0.444 | 0.221 |
| Highly skilled STEM | –0.307 | 0.084 | 0.150 | 0.403 | –0.123 | 0.539 | 0.309 | 0.114 |
| Have emigrated after 2008 | –0.227 | 0.117 | 0.497 | 0.002 | 0.508 | 0.003 | –0.627 | 0.000 |
| Students | 0.322 | 0.111 | 0.091 | 0.679 | –0.219 | 0.352 | –0.297 | 0.213 |
| ISCO group Unskilled workers | –0.467 | 0.054 | 0.408 | 0.057 | –0.093 | 0.687 | 0.138 | 0.575 |
| Plan to return in 5 years | –0.548 | 0.004 | 1.553 | 0.000 | –0.405 | 0.039 | –1.821 | 0.000 |
| Plan to return after retirement | 0.133 | 0.413 | 1.002 | 0.000 | –0.536 | 0.008 | –1.109 | 0.000 |
| Do not plan to return | –0.517 | 0.004 | –1.546 | 0.000 | –0.046 | 0.813 | 1.114 | 0.000 |
| Partner other (neither Latvian nor Russian) | 0.348 | 0.046 | –0.242 | 0.283 | –0.331 | 0.138 | –0.074 | 0.696 |
| Migration motive: financial problems | 0.004 | 0.985 | –0.035 | 0.856 | 0.221 | 0.266 | –0.275 | 0.233 |
| Migration motive: the possibility to develop (to get a good education and/or build a career) (1_yes) | 0.361 | 0.070 | –0.080 | 0.719 | –0.336 | 0.177 | –0.052 | 0.818 |
| Migration motive: get married or started to live together with foreigner (1_yes) | 0.345 | 0.102 | 0.072 | 0.795 | 0.089 | 0.750 | –0.611 | 0.014 |
| Think, that Latvian government is not interested in people like me | –0.421 | 0.003 | –0.102 | 0.480 | 0.251 | 0.090 | 0.375 | 0.012 |
| Constant | –2.646 | 0.000 | –0.858 | 0.094 | –0.889 | 0.084 | –0.193 | 0.699 |
| Nagelkerke r-2 | 0.140 | 0.274 | 0.073 | 0.248 | ||||