
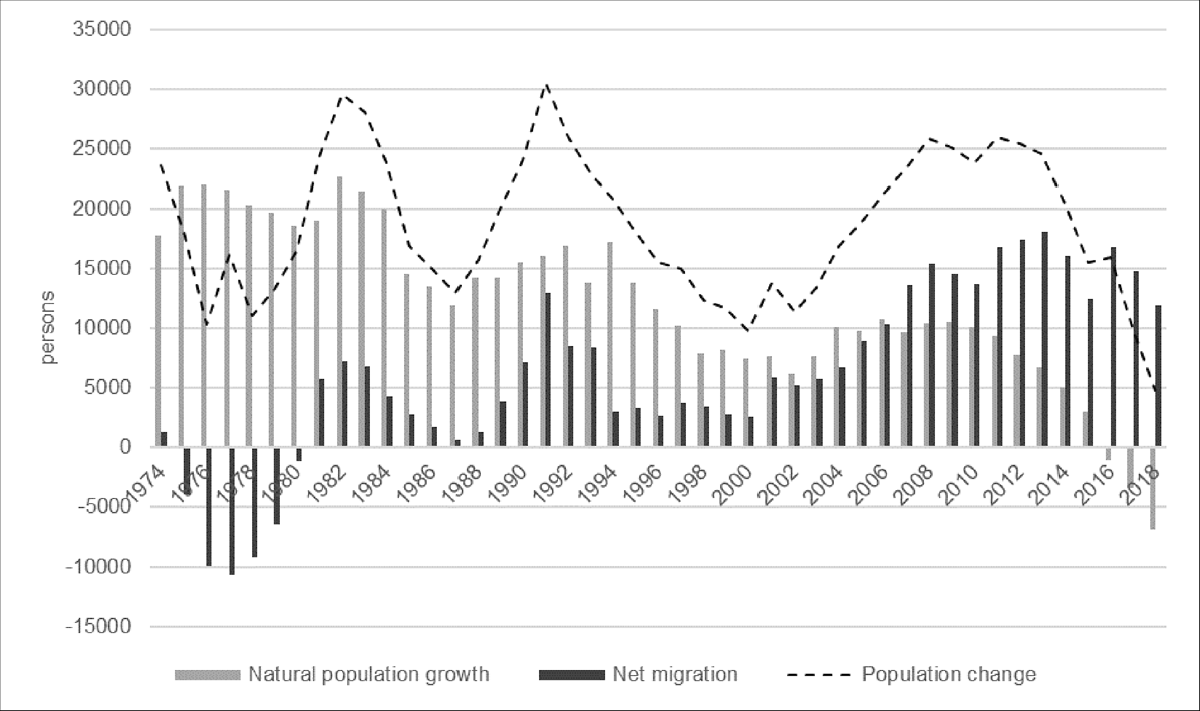
Figure 1
Population and migration development in Finland, 1974–2018 (Tilastokeskus 2019b).
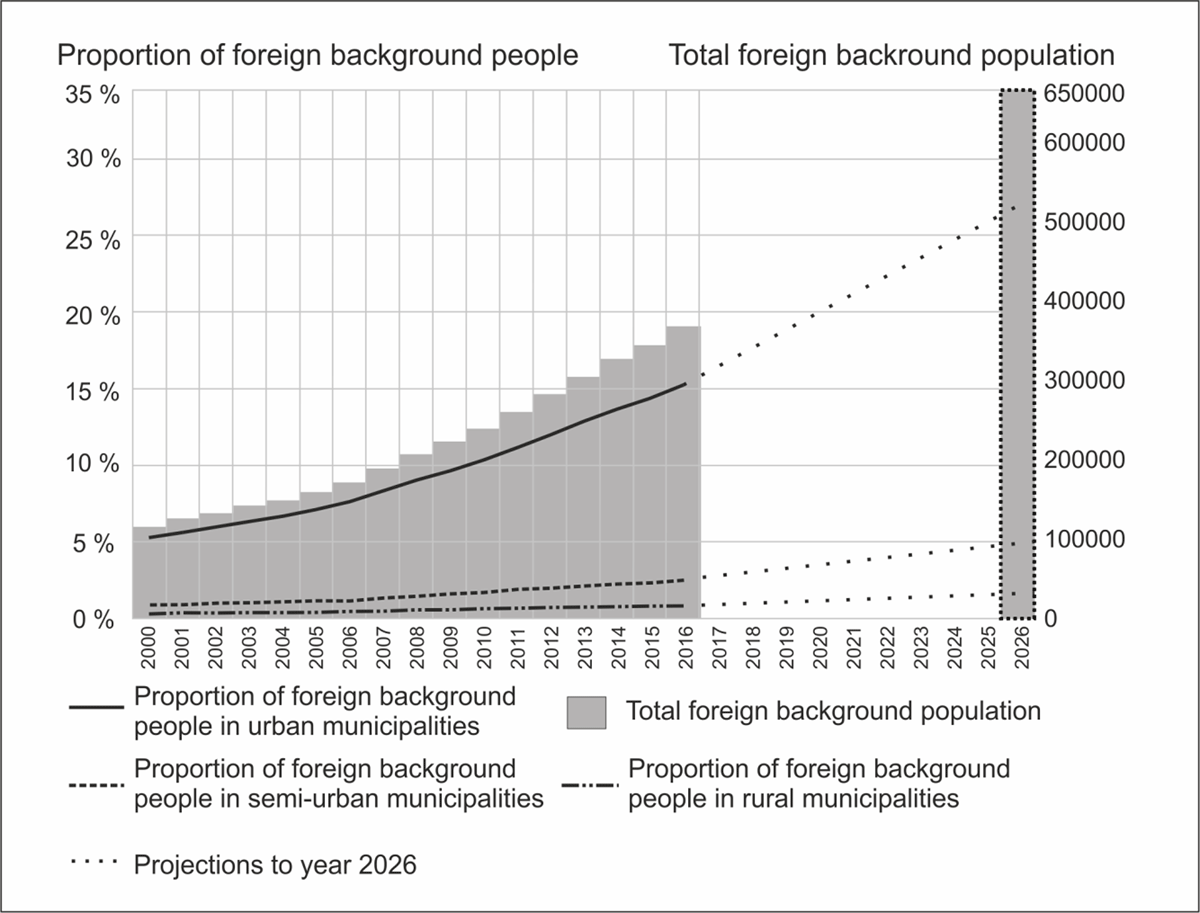
Figure 2
Previous (2000–2016 from Statistics Finland) and expected (2017–2026) foreign-background population in urban, semi-urban, and rural municipalities in Finland.
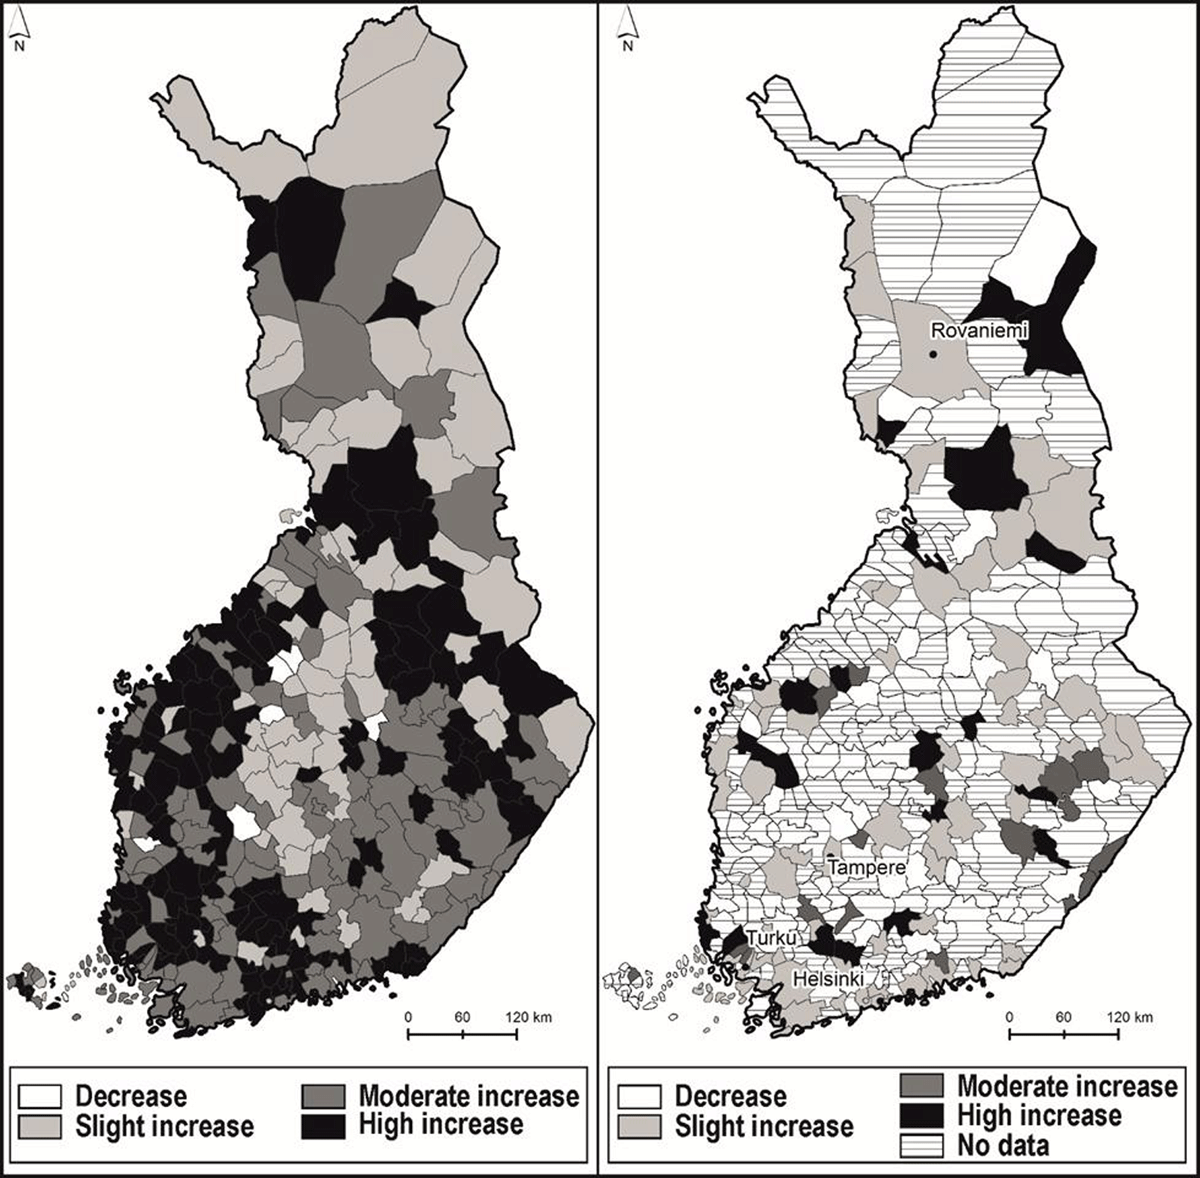
Figure 3
Change in the foreign-background populations (left) of municipalities in Finland, 2000–2015 (Tilastokeskus 2019a), and the projections (right) of municipalities for 2016–2026 (slight increase 1–50%, moderate 51–100%, and high >100%).
Table 1
Expected changes in immigration for the municipalities and the inclusion of immigration in the municipal strategies.
| Expected changes in immigration | Immigration is accounted for in the municipal strategy | |||||
|---|---|---|---|---|---|---|
| Urban municipalities | Semi-urban municipalities | Rural municipalities | ||||
| Yes | No | Yes | No | Yes | No | |
| No change or decrease | 4% | 0% | 7% | 0% | 7% | 13% |
| Increase <100% | 78% | 0% | 50% | 18% | 24% | 21% |
| Increase >100% | 13% | 4% | 14% | 11% | 25% | 11% |
| Total | 96% | 4% | 71% | 29% | 56% | 44% |