
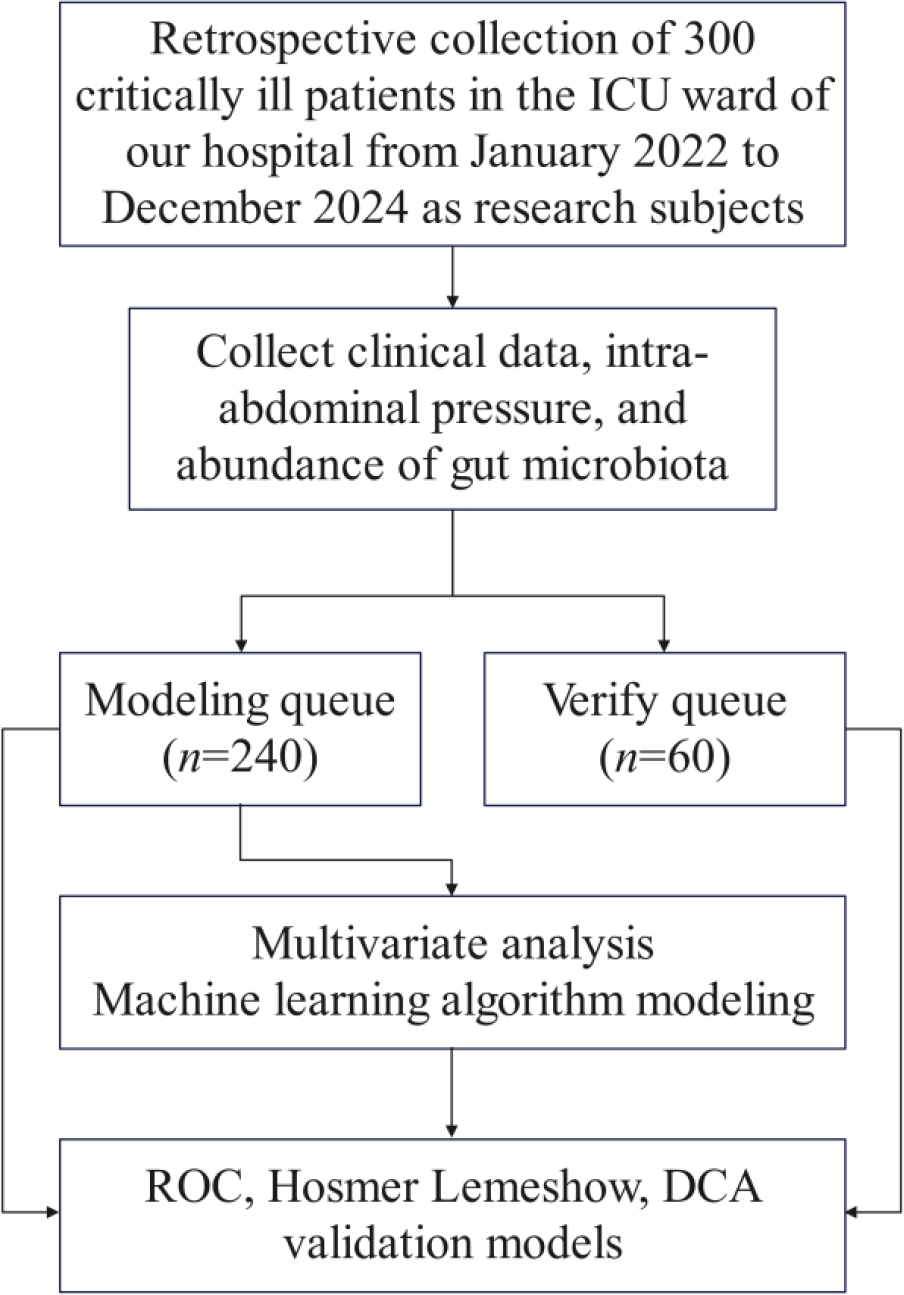
Fig. 1.
Patient inclusion flowchart.
Table I
Baseline clinical characteristics of the model development and validation cohorts.
| Variable | Modeling cohort (n = 240) | Validation cohort (n = 60) | X2/t | P |
|---|---|---|---|---|
| Feeding Intolerance during early enteral nutrition | 0.013 | 0.908 | ||
| No | 122 (50.83) | 31 (51.67) | ||
| Yes | 118 (49.17) | 29 (48.33) | ||
| Sex | 0.004 | 0.952 | ||
| Male | 153 (63.75) | 38 (63.33) | ||
| Female | 87 (36.25) | 22 (36.67) | ||
| Age (years) | 62.10 ± 6.18 | 62.77 ± 6.02 | -0.755 | 0.451 |
| BMI (kg/m2) | 22.49 ± 2.43 | 22.27 ± 2.66 | 0.601 | 0.548 |
| APACHE II score (points) | 20.41 ± 5.60 | 20.72 ± 5.15 | -0.382 | 0.703 |
| Treatment strategies | ||||
| Mechanical ventilation | 171 (71.25) | 43 (71.67) | 0.004 | 0.949 |
| Mild hypothermia therapy | 11 (4.58) | 2 (3.33) | 0.005 | 0.943 |
| Medication use | ||||
| Vasoactive agents | 142 (59.17) | 35 (58.33) | 0.014 | 0.907 |
| Glucocorticoids | 51 (21.25) | 13 (21.67) | 0.005 | 0.944 |
| Analgesics | 120(50.00) | 31(51.67) | 0.053 | 0.817 |
| Sedatives | 125(52.08) | 32(53.33) | 0.030 | 0.862 |
| Type of early enteral nutrition formula | 0.015 | 0.903 | ||
| Whole protein | 158(65.83) | 40(66.67) | ||
| Peptide-based | 82(34.17) | 20(33.33) | ||
| Early enteral nutrition administration method | 0.083 | 0.773 | ||
| Intermittent early enteral nutrition | 117(48.75) | 28(46.67) | ||
| Continuous early enteral nutrition | 123(51.25) | 32(53.33) | ||
| Feeding rate (ml/h) | 40.29 ± 4.99 | 40.78 ± 5.49 | -0.668 | 0.504 |
| Biochemical indicators | ||||
| CRP (mg/l) | 30.38 ± 14.07 | 31.19 ± 14.52 | -0.396 | 0.693 |
| WBC (×109/l) | 10.41 ± 3.41 | 10.76 ± 3.52 | -0.701 | 0.484 |
| Lym (×109/l) | 6.88 ± 2.66 | 6.79 ± 2.41 | 0.254 | 0.800 |
| Mon (×109/l) | 4.62 ± 1.75 | 4.39 ± 1.90 | 0.865 | 0.388 |
| ALB (g/l) | 32.52 ± 4.55 | 32.85 ± 4.25 | -0.507 | 0.612 |
| GLU (mmol/l) | 8.01 ± 1.92 | 7.83 ± 1.58 | 0.679 | 0.498 |
| IAP (mmHg) | 15.42 ± 3.56 | 15.34 ± 3.99 | 0.161 | 0.873 |
| Absolute abundance of gut microbiota (×109copies/g) | ||||
| Enterococcus | 37.55 ± 14.57 | 37.67 ± 20.26 | -0.052 | 0.959 |
| Bacteroides | 23.03 ± 4.78 | 23.91 ± 4.45 | -1.285 | 0.200 |
| Escherichia-Shigella | 6.83 ± 2.40 | 6.79 ± 2.68 | 0.122 | 0.903 |
| Alistipes | 4.20 ± 2.24 | 4.24 ± 2.32 | -0.126 | 0.900 |
| Klebsiella | 0.78 ± 0.34 | 0.82 ± 0.33 | -0.779 | 0.437 |
| Bifidobacterium | 5.64 ± 2.39 | 5.75 ± 2.59 | -0.300 | 0.765 |
| Parabacteroides | 6.19 ± 3.04 | 6.28 ± 2.99 | -0.188 | 0.851 |
| Sphingomonas | 0.96 ± 0.64 | 1.09 ± 0.67 | -1.416 | 0.158 |
| Erysipelatoclostridium | 2.16 ± 1.11 | 2.11 ± 1.12 | 0.319 | 0.750 |
| Subdoligranulum | 3.60 ± 1.69 | 3.70 ± 1.61 | -0.409 | 0.683 |
1 Data are presented as n (%) for categorical variables and mean ± standard deviation for normally distributed continuous variables. BMI, body mass index; APACHE II, Acute Physiology and Chronic Health Evaluation II; CRP, C-reactive protein; WBC, white blood cell count; Lym, lymphocyte count; Mon, monocyte count; ALB, albumin; GLU, glucose; IAP, intra-abdominal pressure.
Table II
Comparison of clinical characteristics between non-feeding intolerance and feeding intolerance patients during early enteral nutrition in the modeling cohort [n (%), ().
| Variable | Non-feeding intolerance (n = 122) | Feeding intolerance (n = 118) | X2/t | P |
|---|---|---|---|---|
| Sex | 0.556 | 0.456 | ||
| Male | 75(61.48) | 78(66.10) | ||
| Female | 47(38.52) | 40(33.90) | ||
| Age (years) | 60.41 ± 6.26 | 63.84 ± 5.62 | -4.461 | <0.001 |
| BMI (kg/m2) | 22.47 ± 2.38 | 22.50 ± 2.49 | -0.102 | 0.919 |
| APACHE II score (points) | 19.83 ± 5.79 | 21.02 ± 5.36 | -1.649 | 0.100 |
| Treatment strategies | ||||
| Mechanical ventilation | 79(64.75) | 92(77.97) | 5.111 | 0.024 |
| Mild hypothermia therapy | 5(4.10) | 6(5.08) | 0.133 | 0.715 |
| Medication use | ||||
| Vasoactive agents | 69(56.56) | 73(61.86) | 0.699 | 0.403 |
| Glucocorticoids | 26(21.31) | 25(21.19) | 0.001 | 0.981 |
| Analgesics | 52(42.62) | 68(57.63) | 5.402 | 0.020 |
| Sedatives | 54(44.26) | 71(60.17) | 6.082 | 0.014 |
| Type of early enteral nutrition formula | 1.626 | 0.202 | ||
| Whole protein | 85(69.67) | 73(61.86) | - | - |
| Peptide-based | 37(30.33) | 45(38.14) | - | - |
| Early enteral nutrition administration method | 4.849 | 0.028 | ||
| Intermittent early enteral nutrition | 68(55.74) | 49(41.53) | - | - |
| Continuous early enteral nutrition | 54(44.26) | 69(58.47) | - | - |
| Feeding rate (ml/h) | 39.46 ± 5.37 | 41.15 ± 4.43 | -2.659 | 0.008 |
| Biochemical indicators | ||||
| CRP (mg/l) | 28.66 ± 14.66 | 32.16 ± 13.25 | -1.935 | 0.054 |
| WBC(×109/l) | 9.95 ± 2.61 | 10.88 ± 4.04 | -2.108 | 0.036 |
| Lym(×109/l) | 6.74 ± 2.45 | 7.03 ± 2.86 | -0.850 | 0.396 |
| Mon(×109/l) | 4.46 ± 1.67 | 4.77 ± 1.83 | -1.367 | 0.173 |
| ALB (g/l) | 33.11 ± 4.87 | 31.91 ± 4.12 | 2.054 | 0.041 |
| Glucose (mmol/l) | 7.36 ± 1.64 | 8.68 ± 1.96 | -5.658 | <0.001 |
| IAP (mmHg) | 14.30 ± 2.67 | 16.58 ± 3.97 | -5.255 | <0.001 |
| Absolute abundance of gut microbiota (×109copies/g) | ||||
| Enterococcus | 34.51 ± 10.64 | 40.69 ± 17.24 | -3.357 | 0.001 |
| Bacteroides | 24.36 ± 4.71 | 21.66 ± 4.48 | 4.538 | <0.001 |
| Escherichia-Shigella | 7.53 ± 2.86 | 6.11 ± 1.51 | 4.797 | <0.001 |
| Alistipes | 4.39 ± 2.48 | 4.00 ± 1.95 | 1.339 | 0.182 |
| Klebsiella | 0.74 ± 0.19 | 0.82 ± 0.44 | -1.863 | 0.064 |
| Bifidobacterium | 5.18 ± 1.92 | 6.12 ± 2.73 | -3.104 | 0.002 |
| Parabacteroides | 6.51 ± 3.23 | 5.87 ± 2.81 | 1.637 | 0.103 |
| Sphingomonas | 0.90 ± 0.54 | 1.02 ± 0.73 | -1.437 | 0.152 |
| Erysipelatoclostridium | 2.30 ± 1.16 | 2.01 ± 1.05 | 2.085 | 0.038 |
| Subdoligranulum | 3.64 ± 1.77 | 3.55 ± 1.62 | 0.404 | 0.686 |
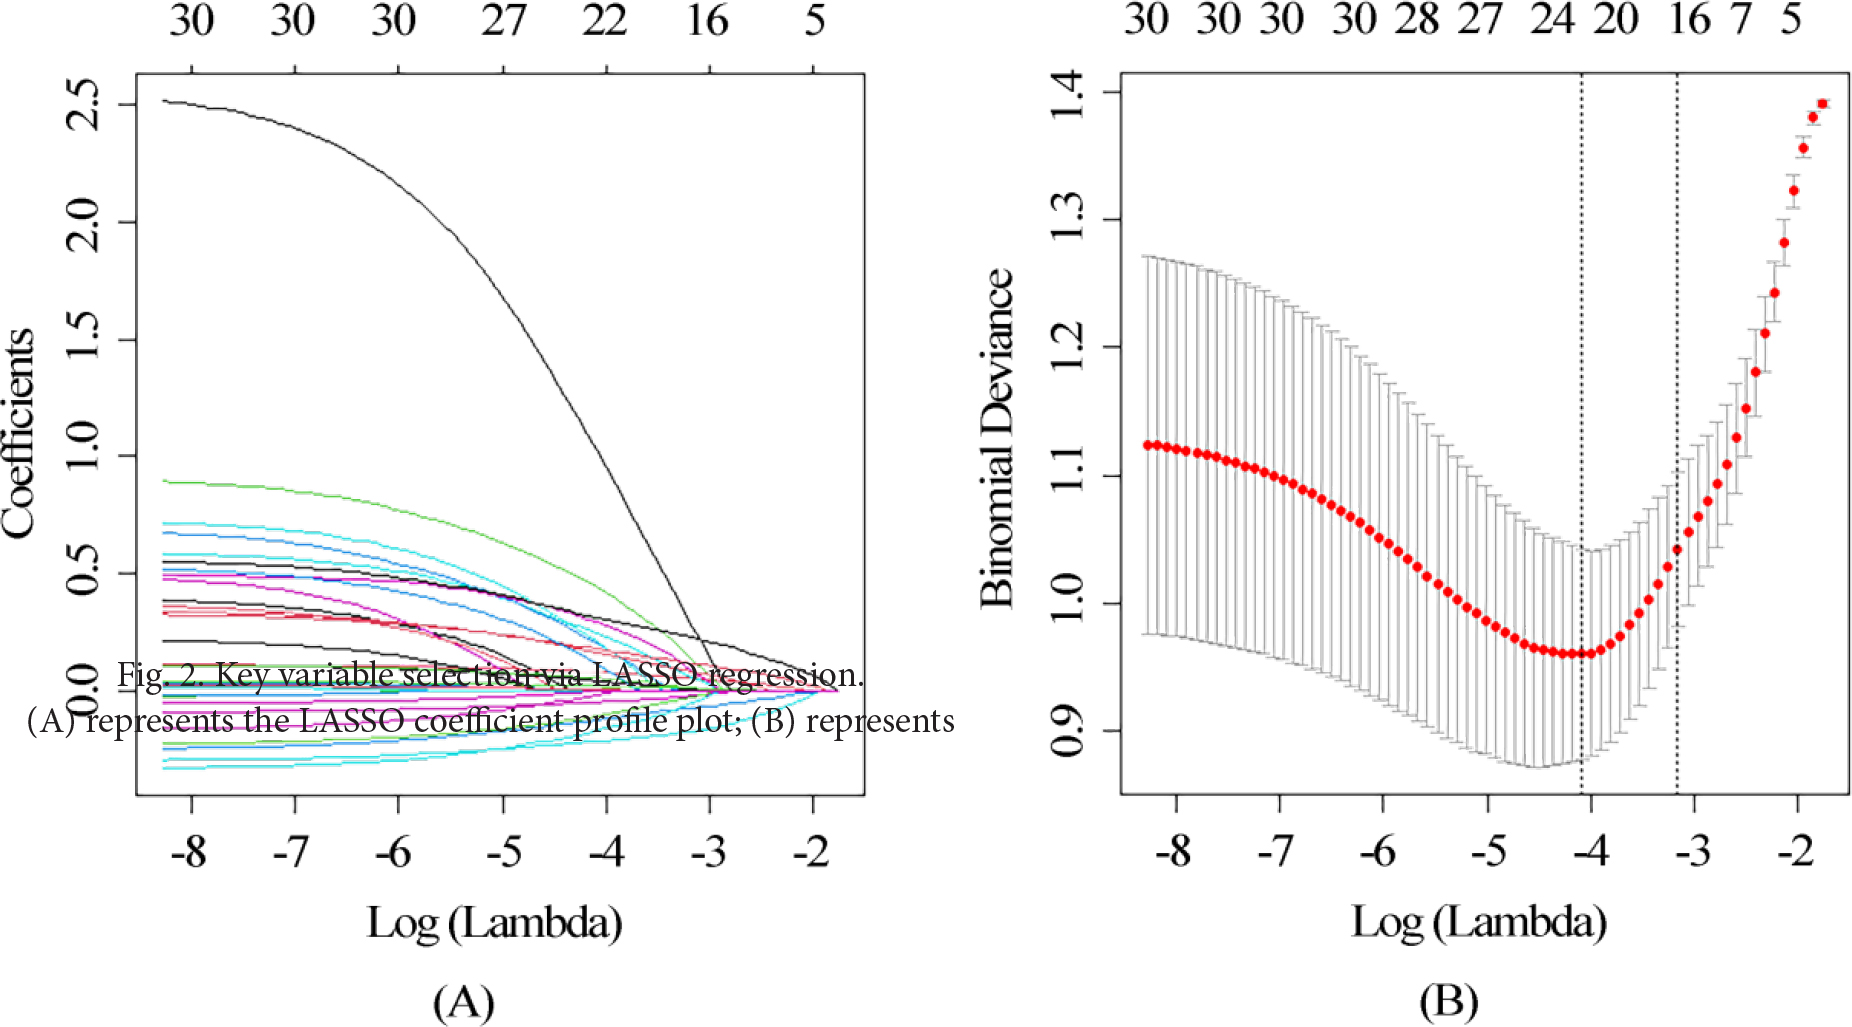
Fig. 2.
Key variable selection via LASSO regression. (A) represents the LASSO coefficient profile plot; (B) represents the LASSO cross-validation curve.
Table III
Multivariate logistic regression analysis of risk factors for feeding intolerance in ICU patients receiving early enteral nutrition.
| Variable | B | S.E. | waldχ2 | P | OR | 95% CI | |
|---|---|---|---|---|---|---|---|
| Lower limit | Upper limit | ||||||
| Age | 0.112 | 0.037 | 9.280 | 0.002 | 1.118 | 1.041 | 1.202 |
| Mechanical ventilation (Yes) | 0.512 | 0.457 | 1.259 | 0.262 | 1.669 | 0.682 | 4.084 |
| Analgesics (Yes) | 0.880 | 0.415 | 4.498 | 0.034 | 2.412 | 1.069 | 5.440 |
| Early enteral nutrition method (Continuous) | 0.646 | 0.406 | 2.534 | 0.111 | 1.907 | 0.861 | 4.224 |
| Feeding rate | 0.079 | 0.043 | 3.404 | 0.065 | 1.082 | 0.995 | 1.177 |
| WBC | 0.121 | 0.063 | 3.614 | 0.057 | 1.128 | 0.996 | 1.278 |
| ALB | -0.091 | 0.045 | 4.116 | 0.042 | 0.913 | 0.837 | 0.997 |
| GLU | 0.470 | 0.120 | 15.353 | <0.001 | 1.601 | 1.265 | 2.025 |
| IAP | 0.282 | 0.068 | 17.367 | <0.001 | 1.326 | 1.161 | 1.514 |
| Absolute abundance of gut microbiota | |||||||
| Enterococcus | 0.036 | 0.014 | 6.707 | 0.010 | 1.037 | 1.009 | 1.066 |
| Bacteroides | -0.200 | 0.050 | 15.881 | <0.001 | 0.819 | 0.742 | 0.903 |
| Escherichia-Shigella | -0.320 | 0.096 | 11.238 | 0.001 | 0.726 | 0.602 | 0.875 |
| Klebsiella | 1.988 | 0.676 | 8.653 | 0.003 | 7.304 | 1.942 | 27.478 |
| Bifidobacterium | 0.301 | 0.094 | 10.232 | 0.001 | 1.351 | 1.123 | 1.624 |
| Parabacteroides | -0.210 | 0.069 | 9.229 | 0.002 | 0.811 | 0.708 | 0.928 |
| Erysipelatoclostridium | -0.361 | 0.187 | 3.719 | 0.054 | 0.697 | 0.483 | 1.006 |
| Constant | -13.459 | 3.871 | 12.089 | 0.001 | 0 | ||
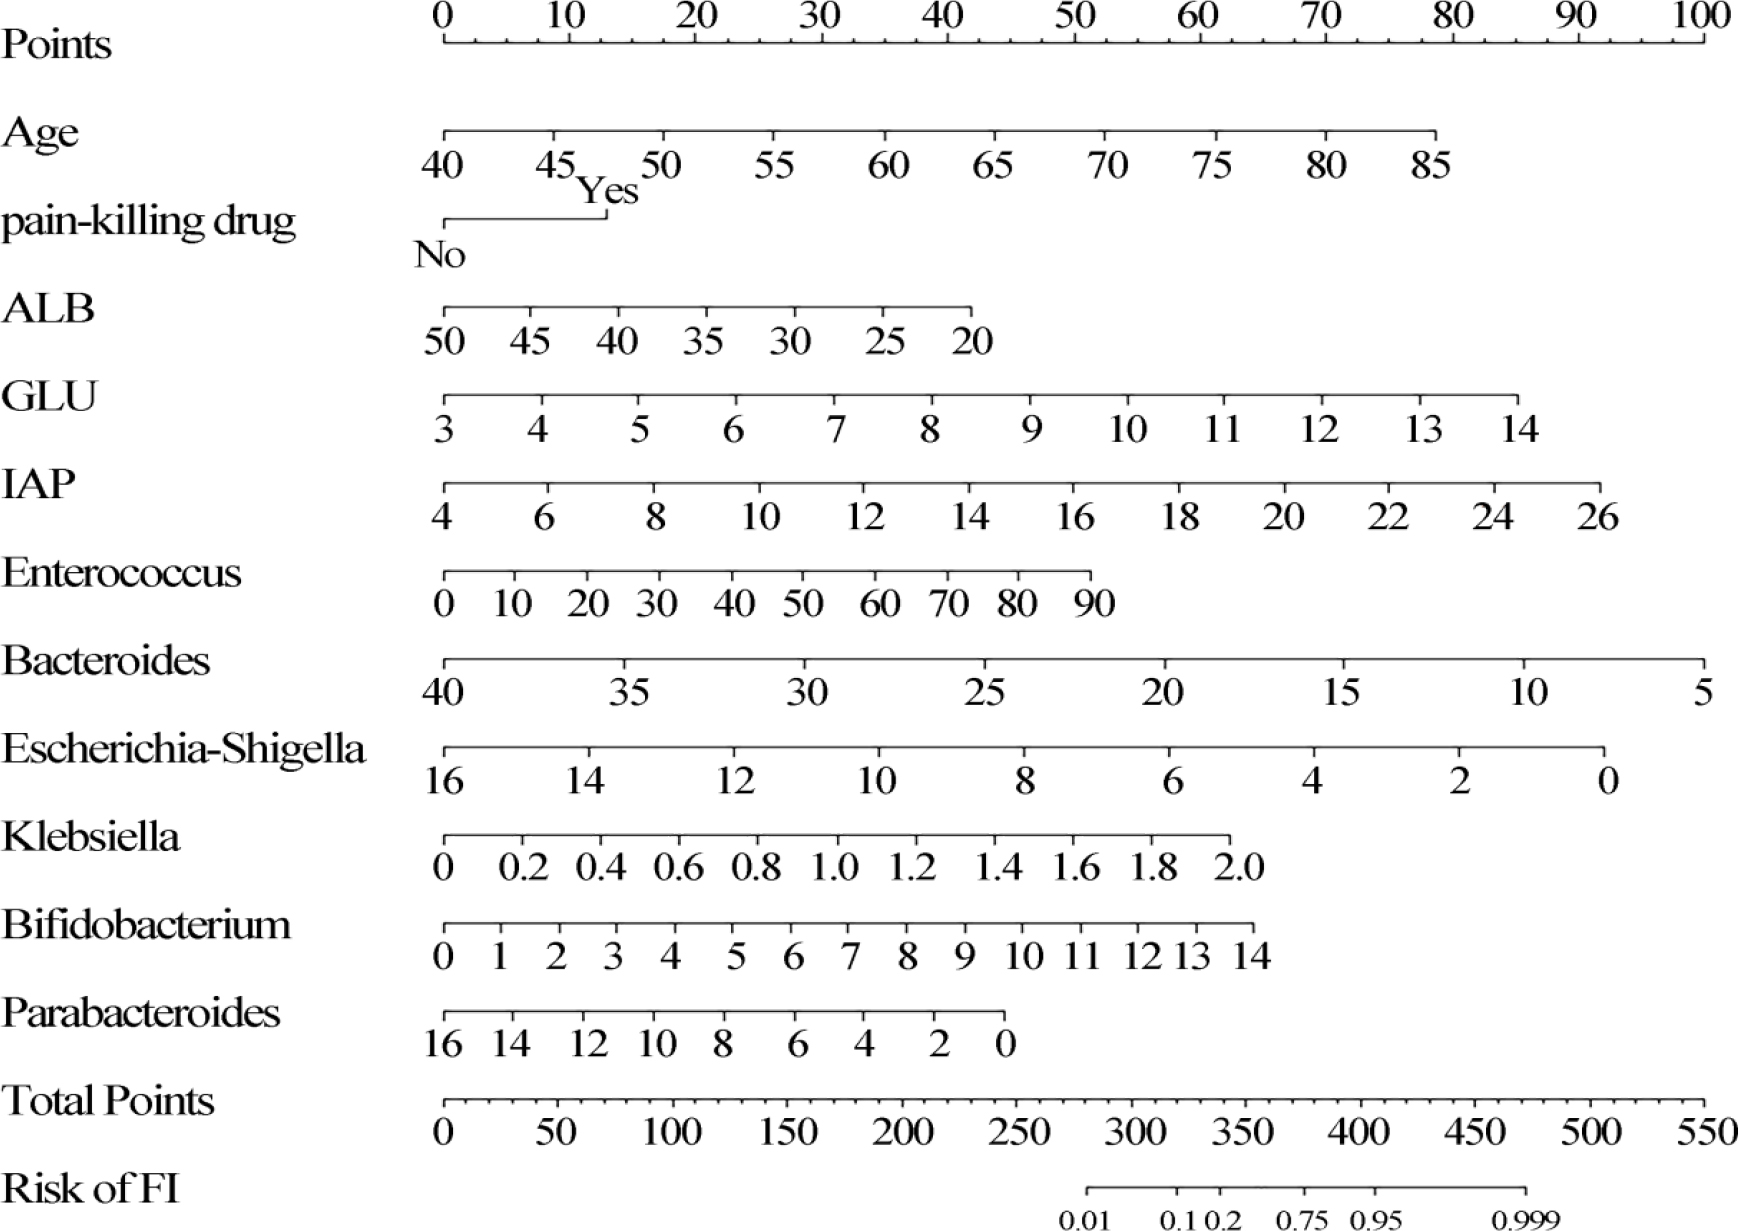
Fig. 3.
Development of a predictive nomogram for early enteral feeding intolerance in ICU patients.
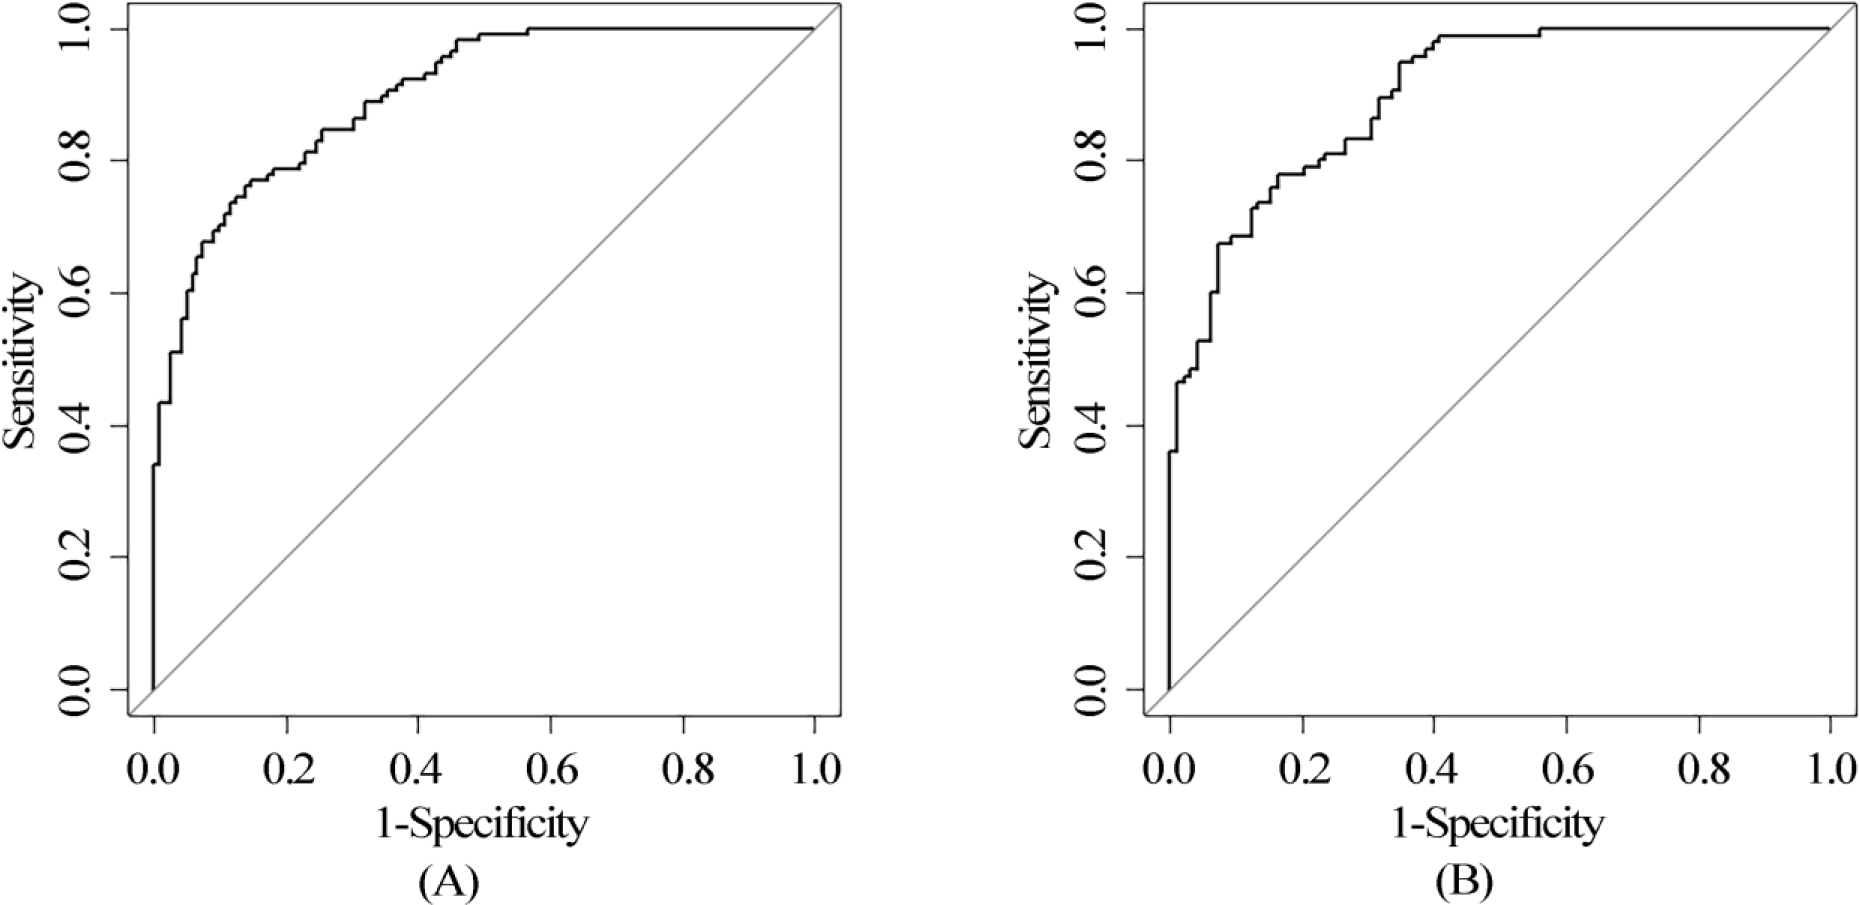
Fig. 4.
Receiver operating characteristic (ROC) curves demonstrating the model’s ability to predict feeding intolerance during the early phase of enteral nutrition in patients admitted to the ICU, (A) Modeling cohort; (B) Validation cohort.
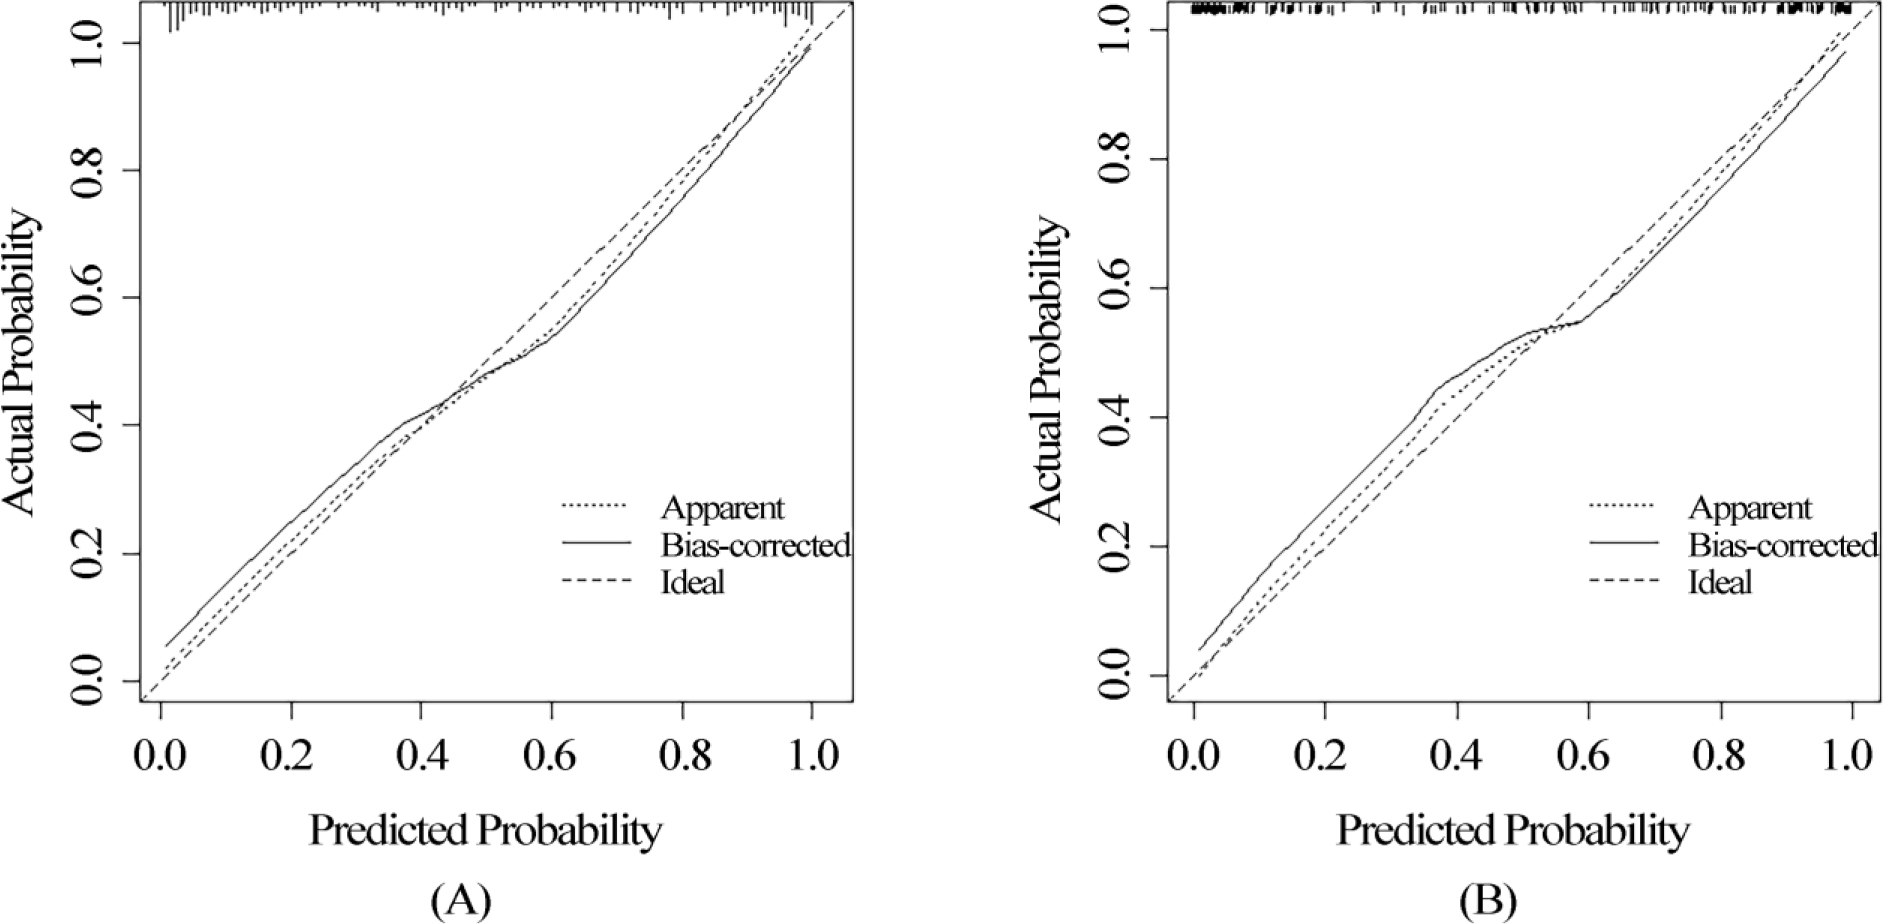
Fig. 5.
Calibration charts illustrating the consistency between estimated risk probabilities and actual outcomes for feeding intolerance in ICU patients undergoing early enteral nutrition; (A) Modeling cohort; (B) Validation cohort.
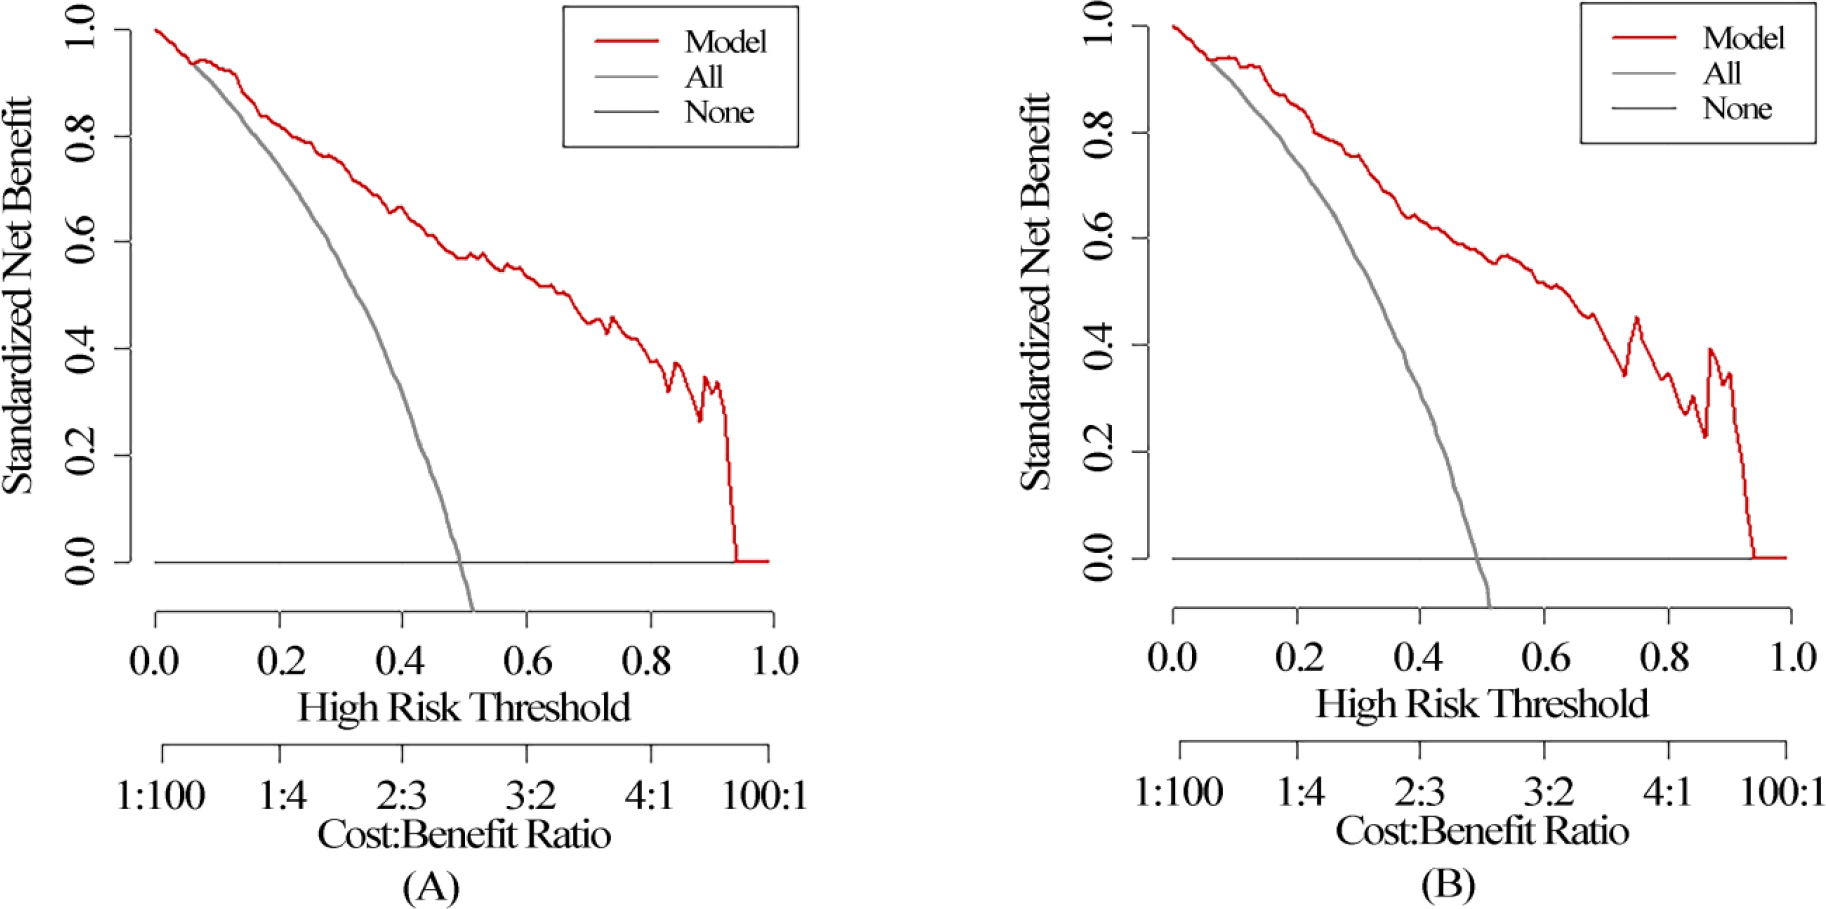
Fig. 6.
Decision curve analysis (DCA) evaluating the net clinical benefit of the predictive model across a range of decision thresholds in the ICU population receiving early enteral feeding; (A) Modeling cohort; (B) Validation cohort.