
Table I
Comparison of clinical data between the improved discharge group and the non-improved discharge group.
| Item | Improved discharge group (n = 45) | Non-improved discharge group (n = 51) | t/χ2 | p |
|---|---|---|---|---|
| Gender | 0.435 | 0.510 | ||
| Male | 28 | 35 | ||
| Female | 17 | 16 | ||
| Age | 64.577 ± 15.878 | 71.804 ± 15.277 | –2.270 | 0.025 |
| Total length of hospital stay | 14.533 ± 4.283 | 7.686 ± 6.351 | 6.108 | < 0.001 |
| APACHE II score | 24.133 ± 5.880 | 26.520 ± 7.393 | –1.728 | 0.087 |
| Past history | ||||
| Hypertension | 0.996 | 0.318 | ||
| Yes | 21 | 29 | ||
| No | 24 | 22 | ||
| Diabetes | 2.438 | 0.118 | ||
| Yes | 13 | 8 | ||
| No | 32 | 43 | ||
| Coronary disease | 0.269 | 0.604 | ||
| Yes | 7 | 10 | ||
| No | 38 | 41 | ||
| Personal history | ||||
| Smoke | 0.041 | 0.840 | ||
| Yes | 15 | 18 | ||
| No | 30 | 33 | ||
| Excessive drinking | 1.226 | 0.268 | ||
| Yes | 12 | 19 | ||
| No | 33 | 32 | ||
| Test results | ||||
| WBC (×109/l) | 14.706 ± 6.293 | 14.020 ± 9.545 | 0.402 | 0.689 |
| N (%) | 85.491 ± 9.472 | 82.269 ± 17.070 | 1.100 | 0.274 |
| HGB (g/l) | 98.591 ± 40.885 | 99.522 ± 35.780 | –0.117 | 0.907 |
| PLT (×109/l) | 224.767 ± 116.618 | 201.880 ± 133.020 | 0.875 | 0.384 |
| CRP (mg/l) | 61.623 ± 55.878 | 128.030 ± 75.944 | –4.293 | < 0.001 |
| INR | 1.196 ± 0.436 | 1.241 ± 0.442 | –0.493 | 0.623 |
| Alveolar lavage fluid | ||||
| Gram-Negative bacillus | 0.178 | 0.673 | ||
| (+) | 24 | 25 | ||
| (–) | 21 | 26 | ||
Table II
Assignment method.
| Variable | Assignment |
|---|---|
| Dependent variable | |
| Whether the patient was discharged after improvement | No = 0, Yes = 1 |
| Independent variable | |
| Gender | Female = 0, Male = 1 |
| Age | Substitute the original value |
| Total length of stay | Substitute the original value |
| APACHE II score | Substitute the original value |
| Hypertension | No = 0, Yes = 1 |
| Diabetes | No = 0, Yes = 1 |
| Coronary disease | No = 0, Yes = 1 |
| Smoke | No = 0, Yes = 1 |
| Excessive drinking | No = 0, Yes = 1 |
| WBC (×109/l) | Substitute the original value |
| HGB (g/l) | Substitute the original value |
| PLT (×109/l) | Substitute the original value |
| CRP (mg/l) | Substitute the original value |
| Gram-Negative bacillus | “–” = 0, “+” = 1 |
Table III
Logistics regression analysis of clinical data of severe pneumonia patients.
| Correlative factor | Relevant parameter | Single factor Logistics analysis | Multi-factor Logistics analysis | |||||
|---|---|---|---|---|---|---|---|---|
| Improved discharge group | Non-improved discharge group | OR | 95%CI | p | OR | 95%CI | p | |
| Gender | 0.753 | 0.321–1.753 | 0.510 | |||||
| Male | 28 | 35 | ||||||
| Female | 17 | 16 | ||||||
| Age | 0.970 | 0.942–0.996 | 0.031 | 0.963 | 0.931–0.994 | 0.024 | ||
| ≤ 55 | 10 | 7 | ||||||
| > 55 | 35 | 44 | ||||||
| Total length of hospital stay | 1.255 | 1.147–1.398 | < 0.001 | 1.262 | 1.151–1.410 | < 0.001 | ||
| ≤ 14 | 25 | 44 | ||||||
| > 14 | 20 | 7 | ||||||
| APACHE II score | 24.133 ± 5.880 | 26.520 ± 7.393 | 0.947 | 0.886–1.007 | 0.091 | |||
| Past history | ||||||||
| Hypertension | 0.664 | 0.294–1.483 | 0.319 | |||||
| Yes | 21 | 29 | ||||||
| No | 24 | 22 | ||||||
| Diabetes | 2.184 | 0.822–6.112 | 0.123 | |||||
| Yes | 13 | 8 | ||||||
| No | 32 | 43 | ||||||
| Coronary disease | 0.755 | 0.251–2.166 | 0.604 | |||||
| Yes | 7 | 10 | ||||||
| No | 38 | 41 | ||||||
| Personal history | ||||||||
| Smoke | 0.917 | 0.391–2.134 | 0.840 | |||||
| Yes | 15 | 18 | ||||||
| No | 30 | 33 | ||||||
| Excessive drinking | 0.612 | 0.251–1.451 | 0.270 | |||||
| Yes | 12 | 19 | ||||||
| No | 33 | 32 | ||||||
| Test results | ||||||||
| WBC (×109/l) | 14.706 ± 6.293 | 14.020 ± 9.545 | 1.010 | 0.961–1.064 | 0.685 | |||
| HGB (g/.) | 98.591 ± 40.885 | 99.522 ± 35.780 | 0.999 | 0.989–1.010 | 0.906 | |||
| PLT (×109/l) | 224.767 ± 116.618 | 201.880 ± 133.020 | 1.001 | 0.998–1.005 | 0.381 | |||
| CRP (mg/l) | 61.623 ± 55.878 | 128.030 ± 75.944 | 0.990 | 0.978–1.001 | 0.074 | |||
| Alveolar lavage fluid | ||||||||
| Gram-negative bacillus | 1.189 | 0.533–2.666 | 0.673 | |||||
| (+) | 24 | 25 | ||||||
| (−) | 21 | 26 | ||||||
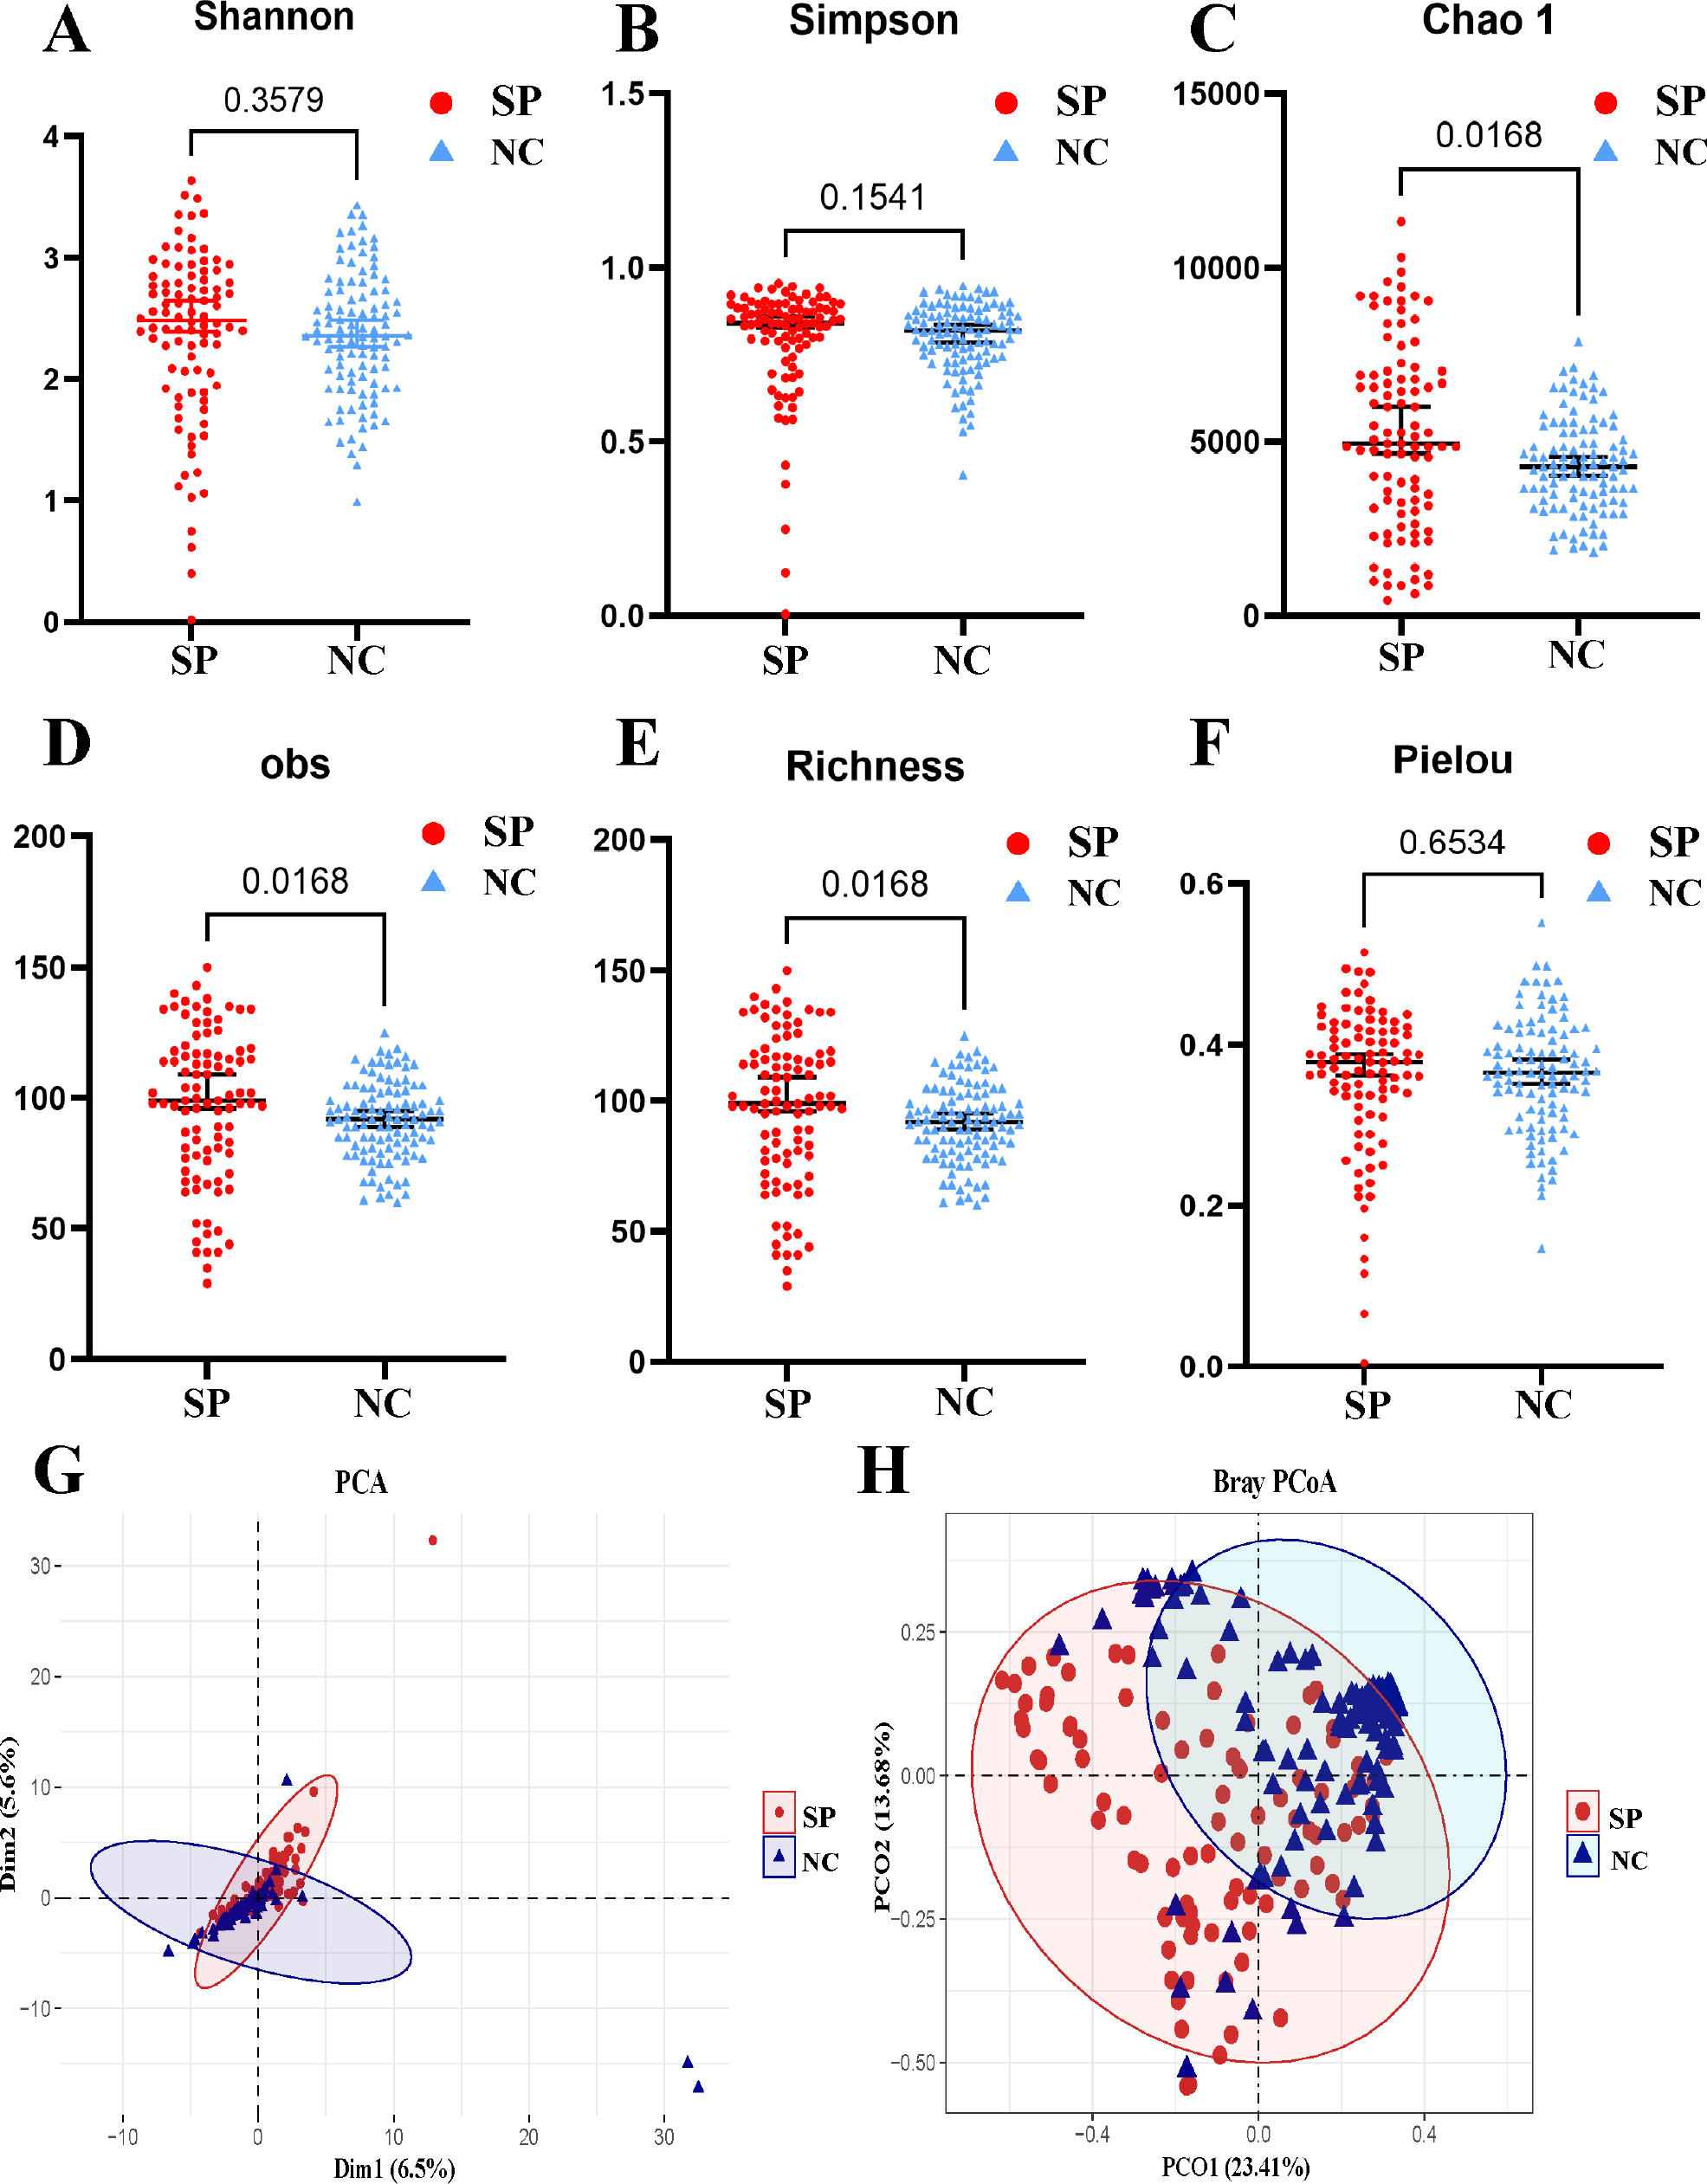
Fig. 1.
Microbial diversity analysis of fecal samples. Analysis of α diversity (A–F) and β diversity (G–H) of intestinal microbiota in patients with severe pneumonia (SP) and normal controls (NC).
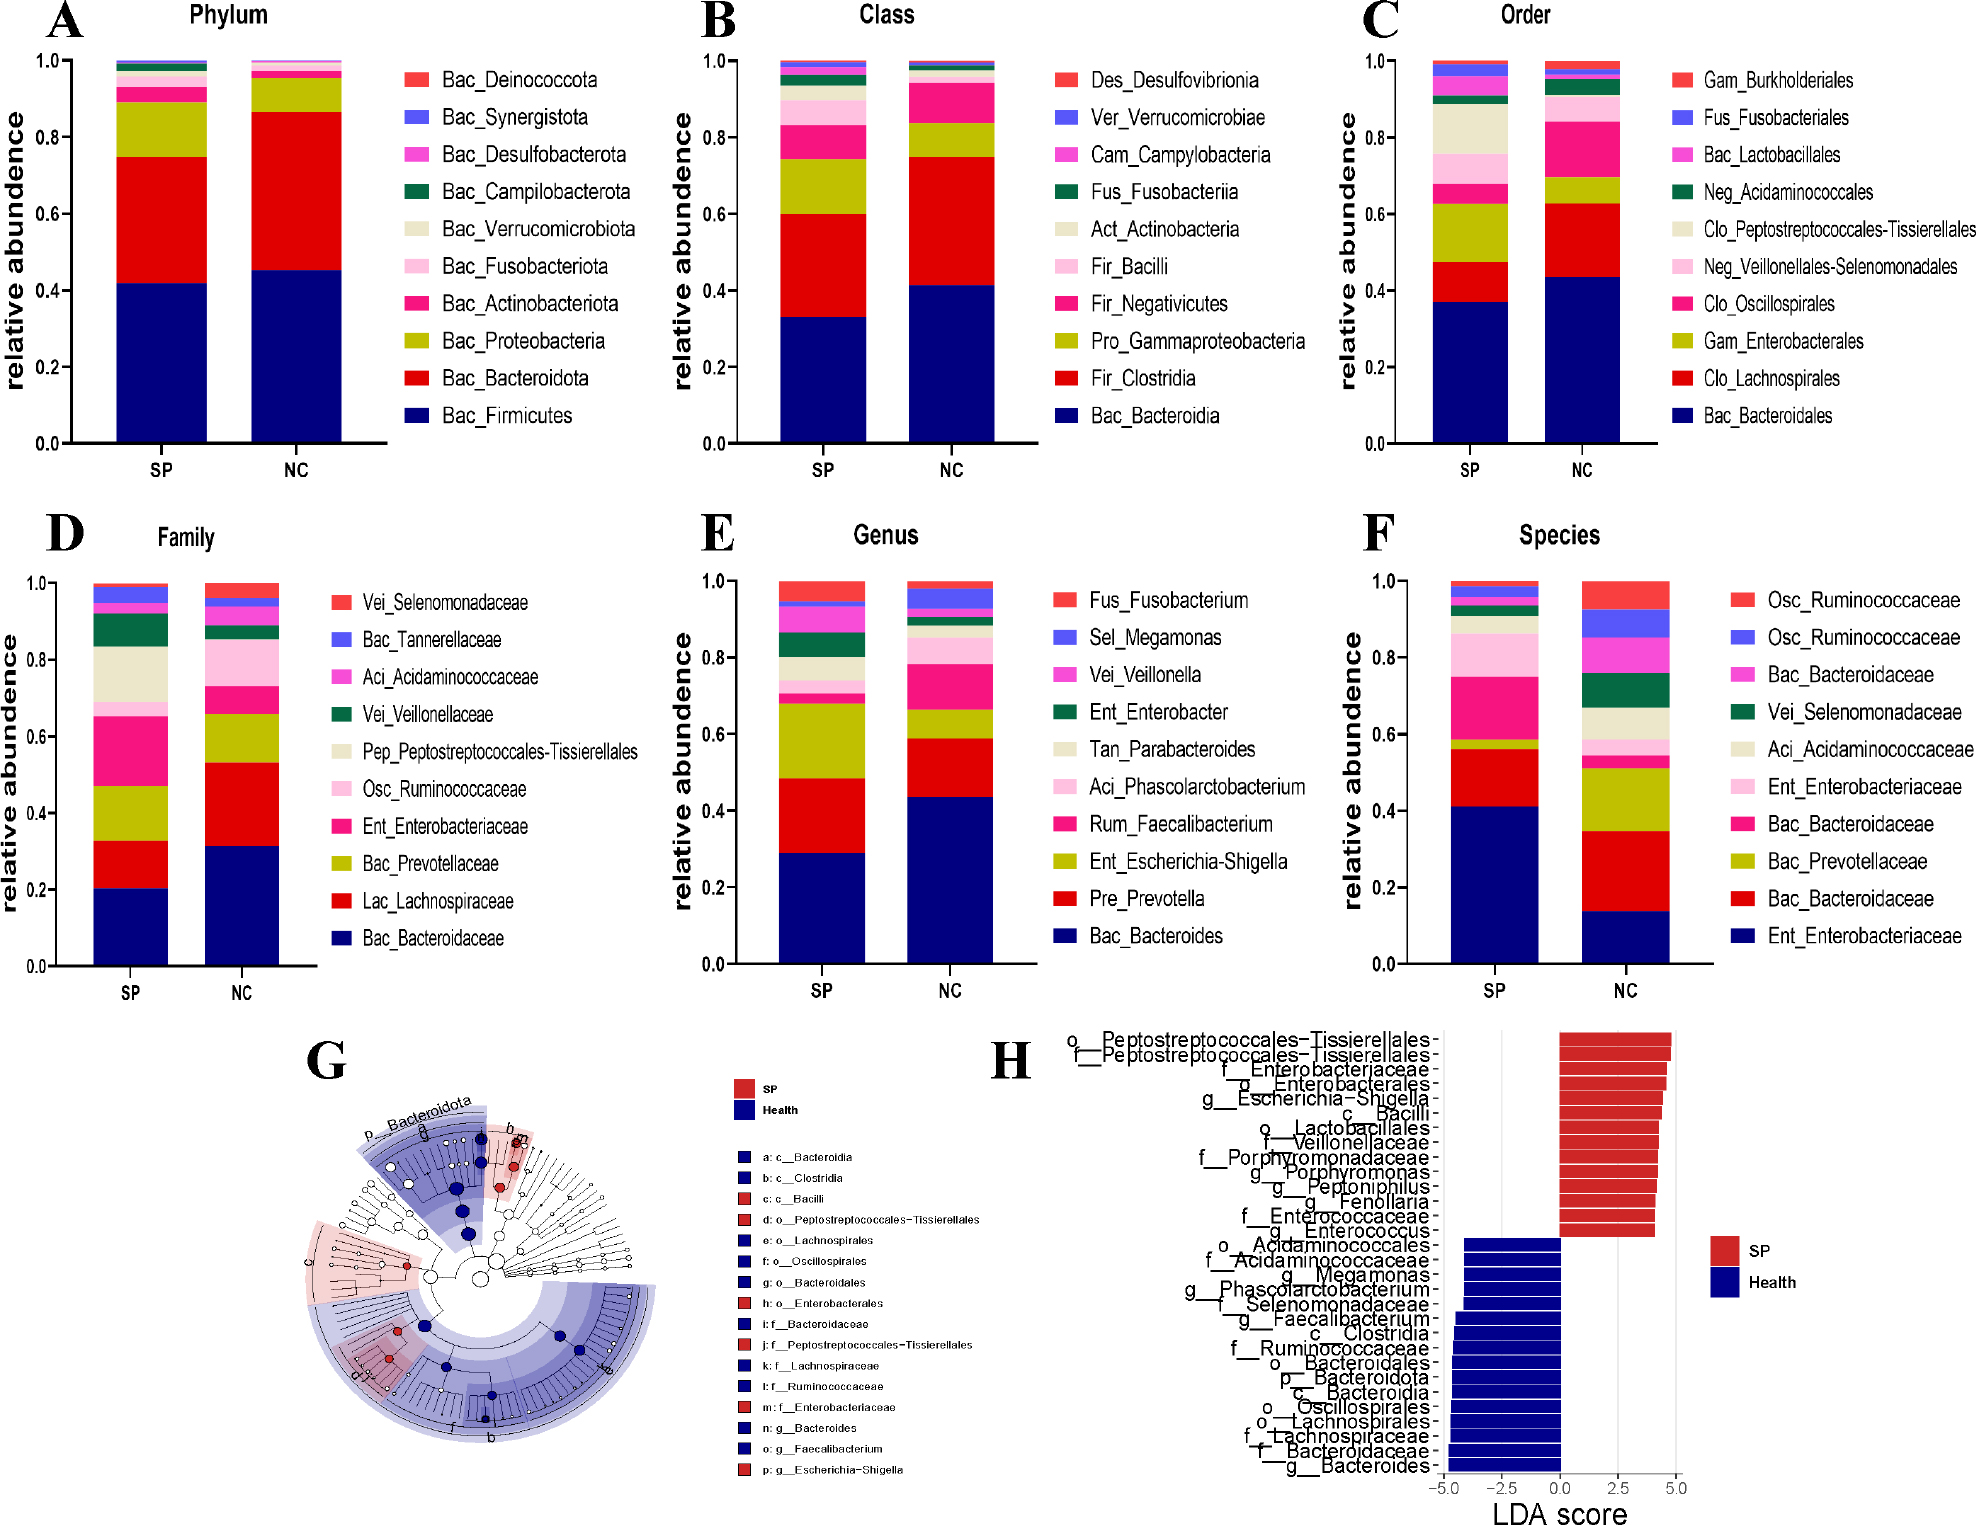
Fig. 2.
The microbial composition at different classification levels in fecal samples. Stacked plot of the relative abundances of the top 10 intestinal microorganisms at the phylum (A), class (B), order (C), family (D), genus (E), and species (F) levels. Cladogram (G) and LDA bar plot (H) of microorganisms associated with fecal samples from patients with severe pneumonia and normal controls.
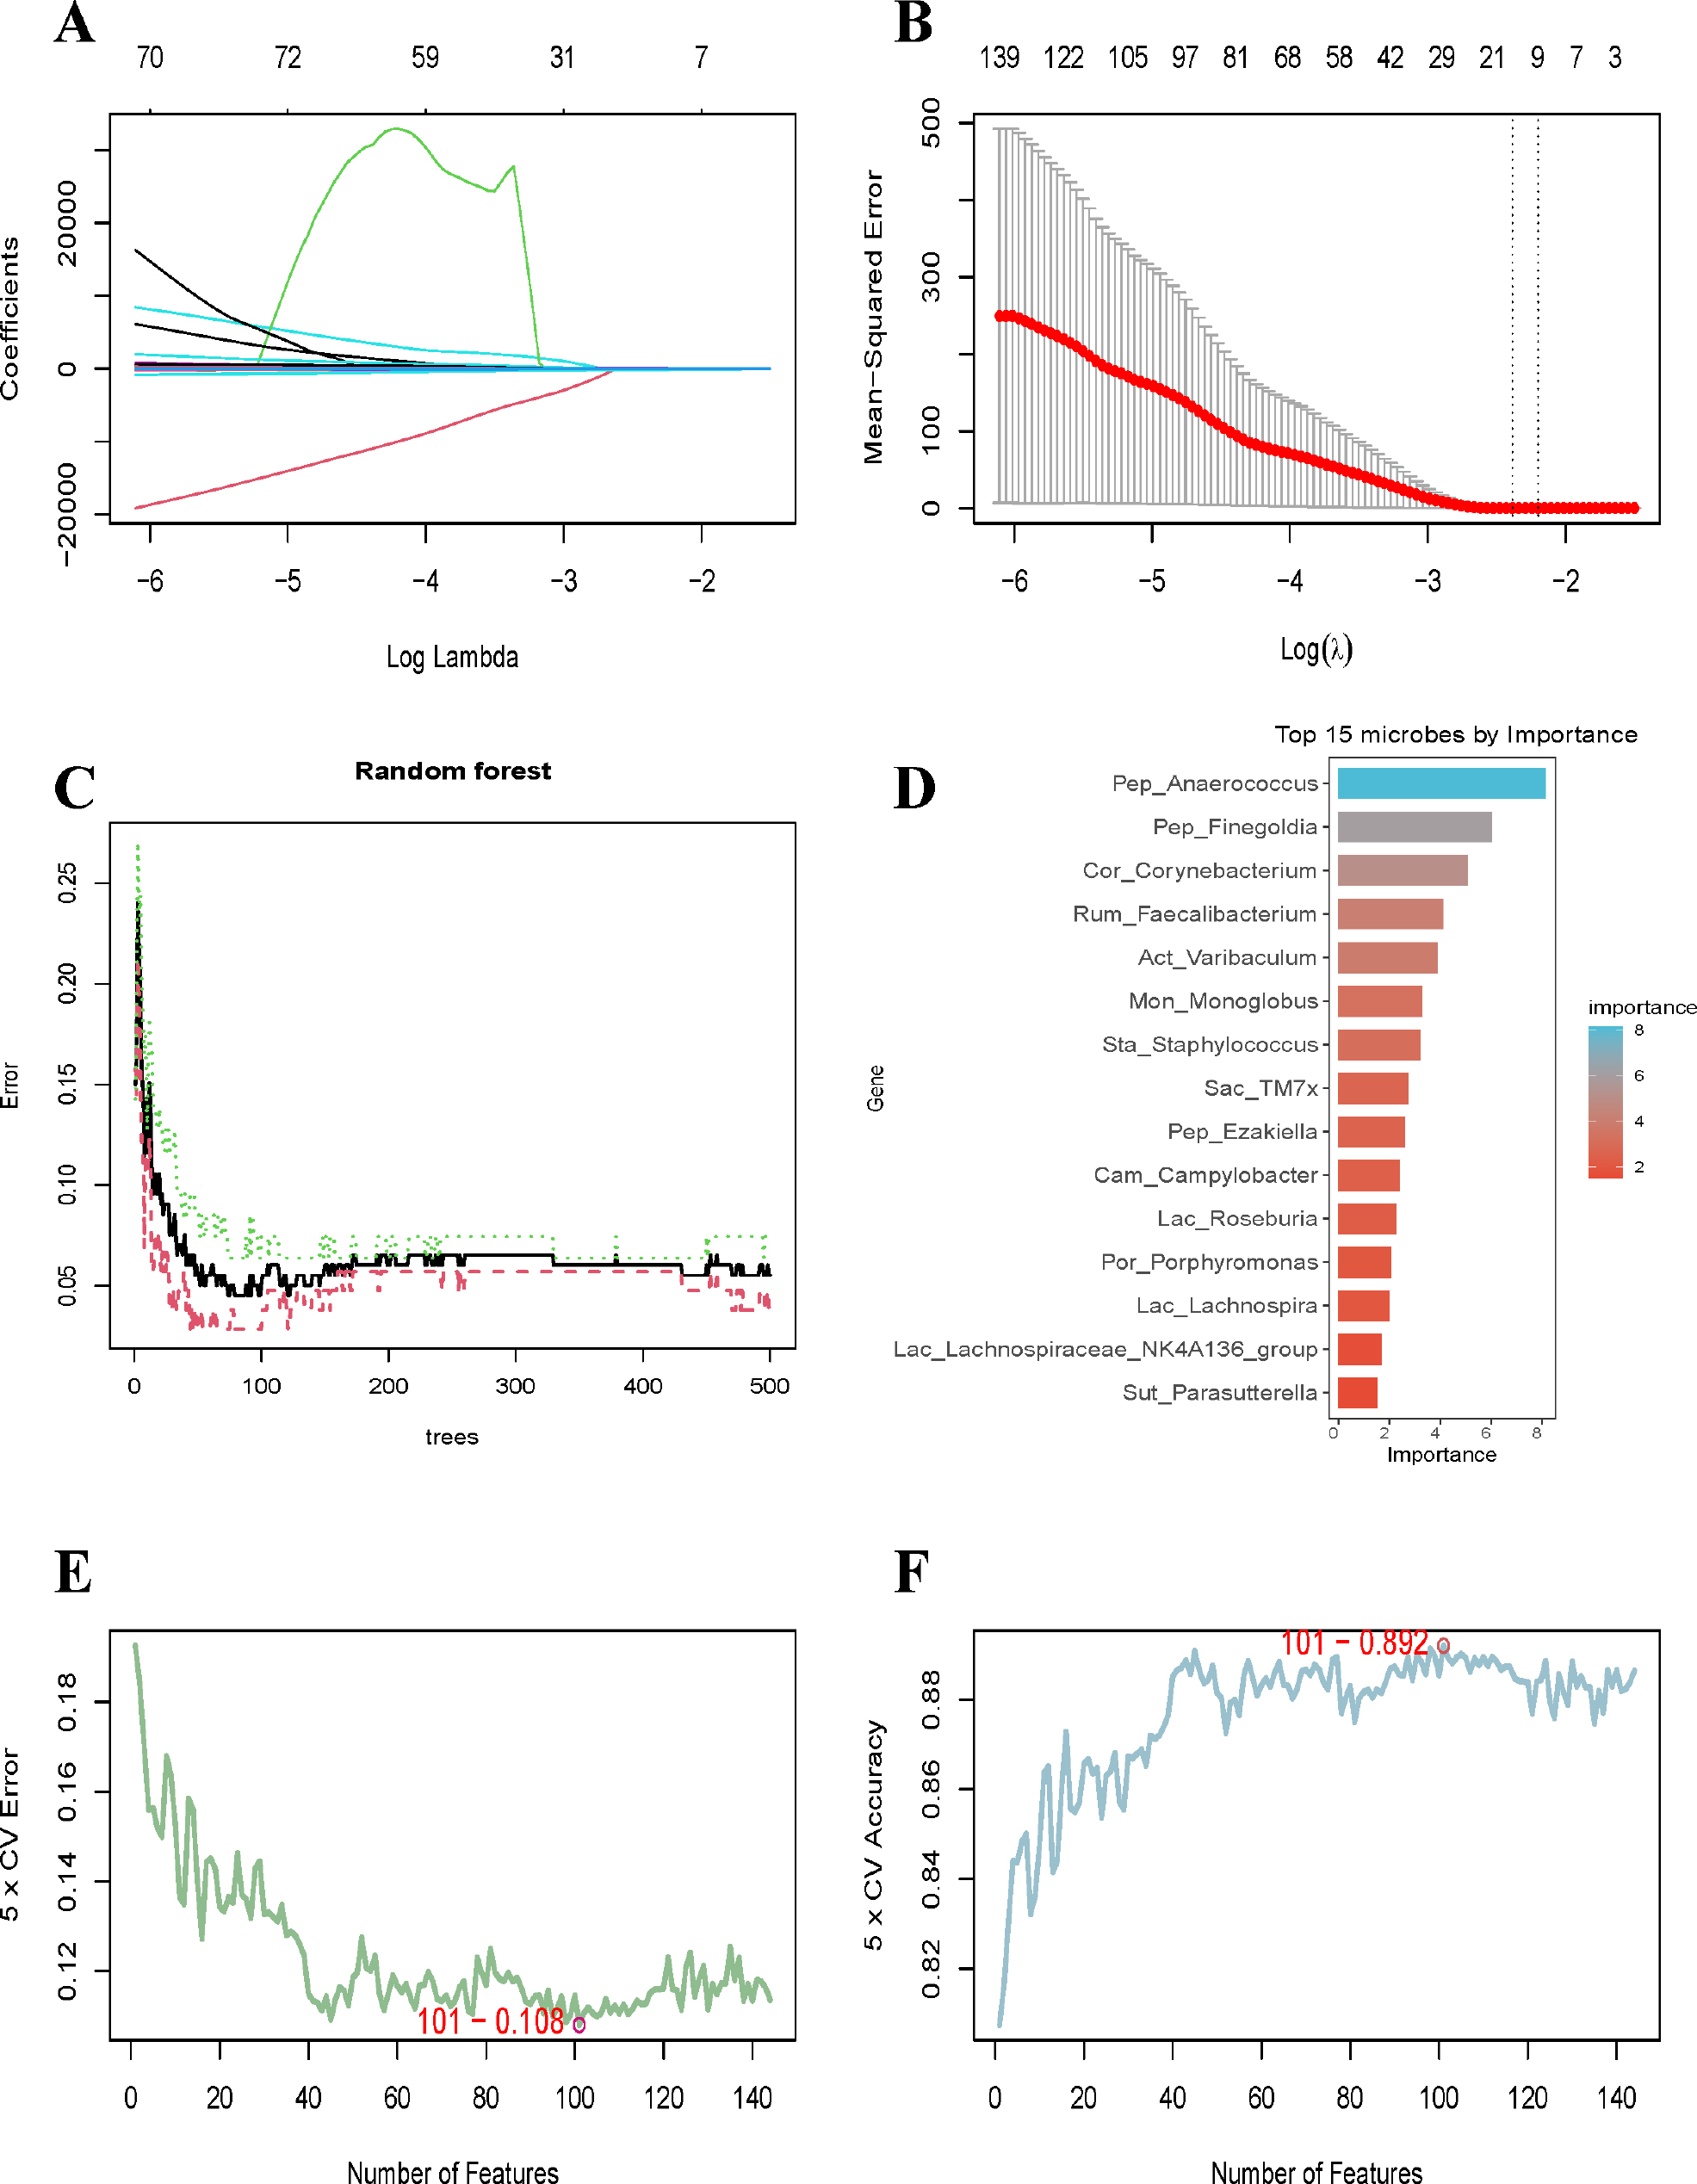
Fig. 3.
Machine-learning algorithms screen for signature microbiota. LASSO analysis (A–B), RF analysis (C–D), and SVM analysis (E–F) were used to screen the characteristic microbiota of patients with severe pneumonia at the genus level.
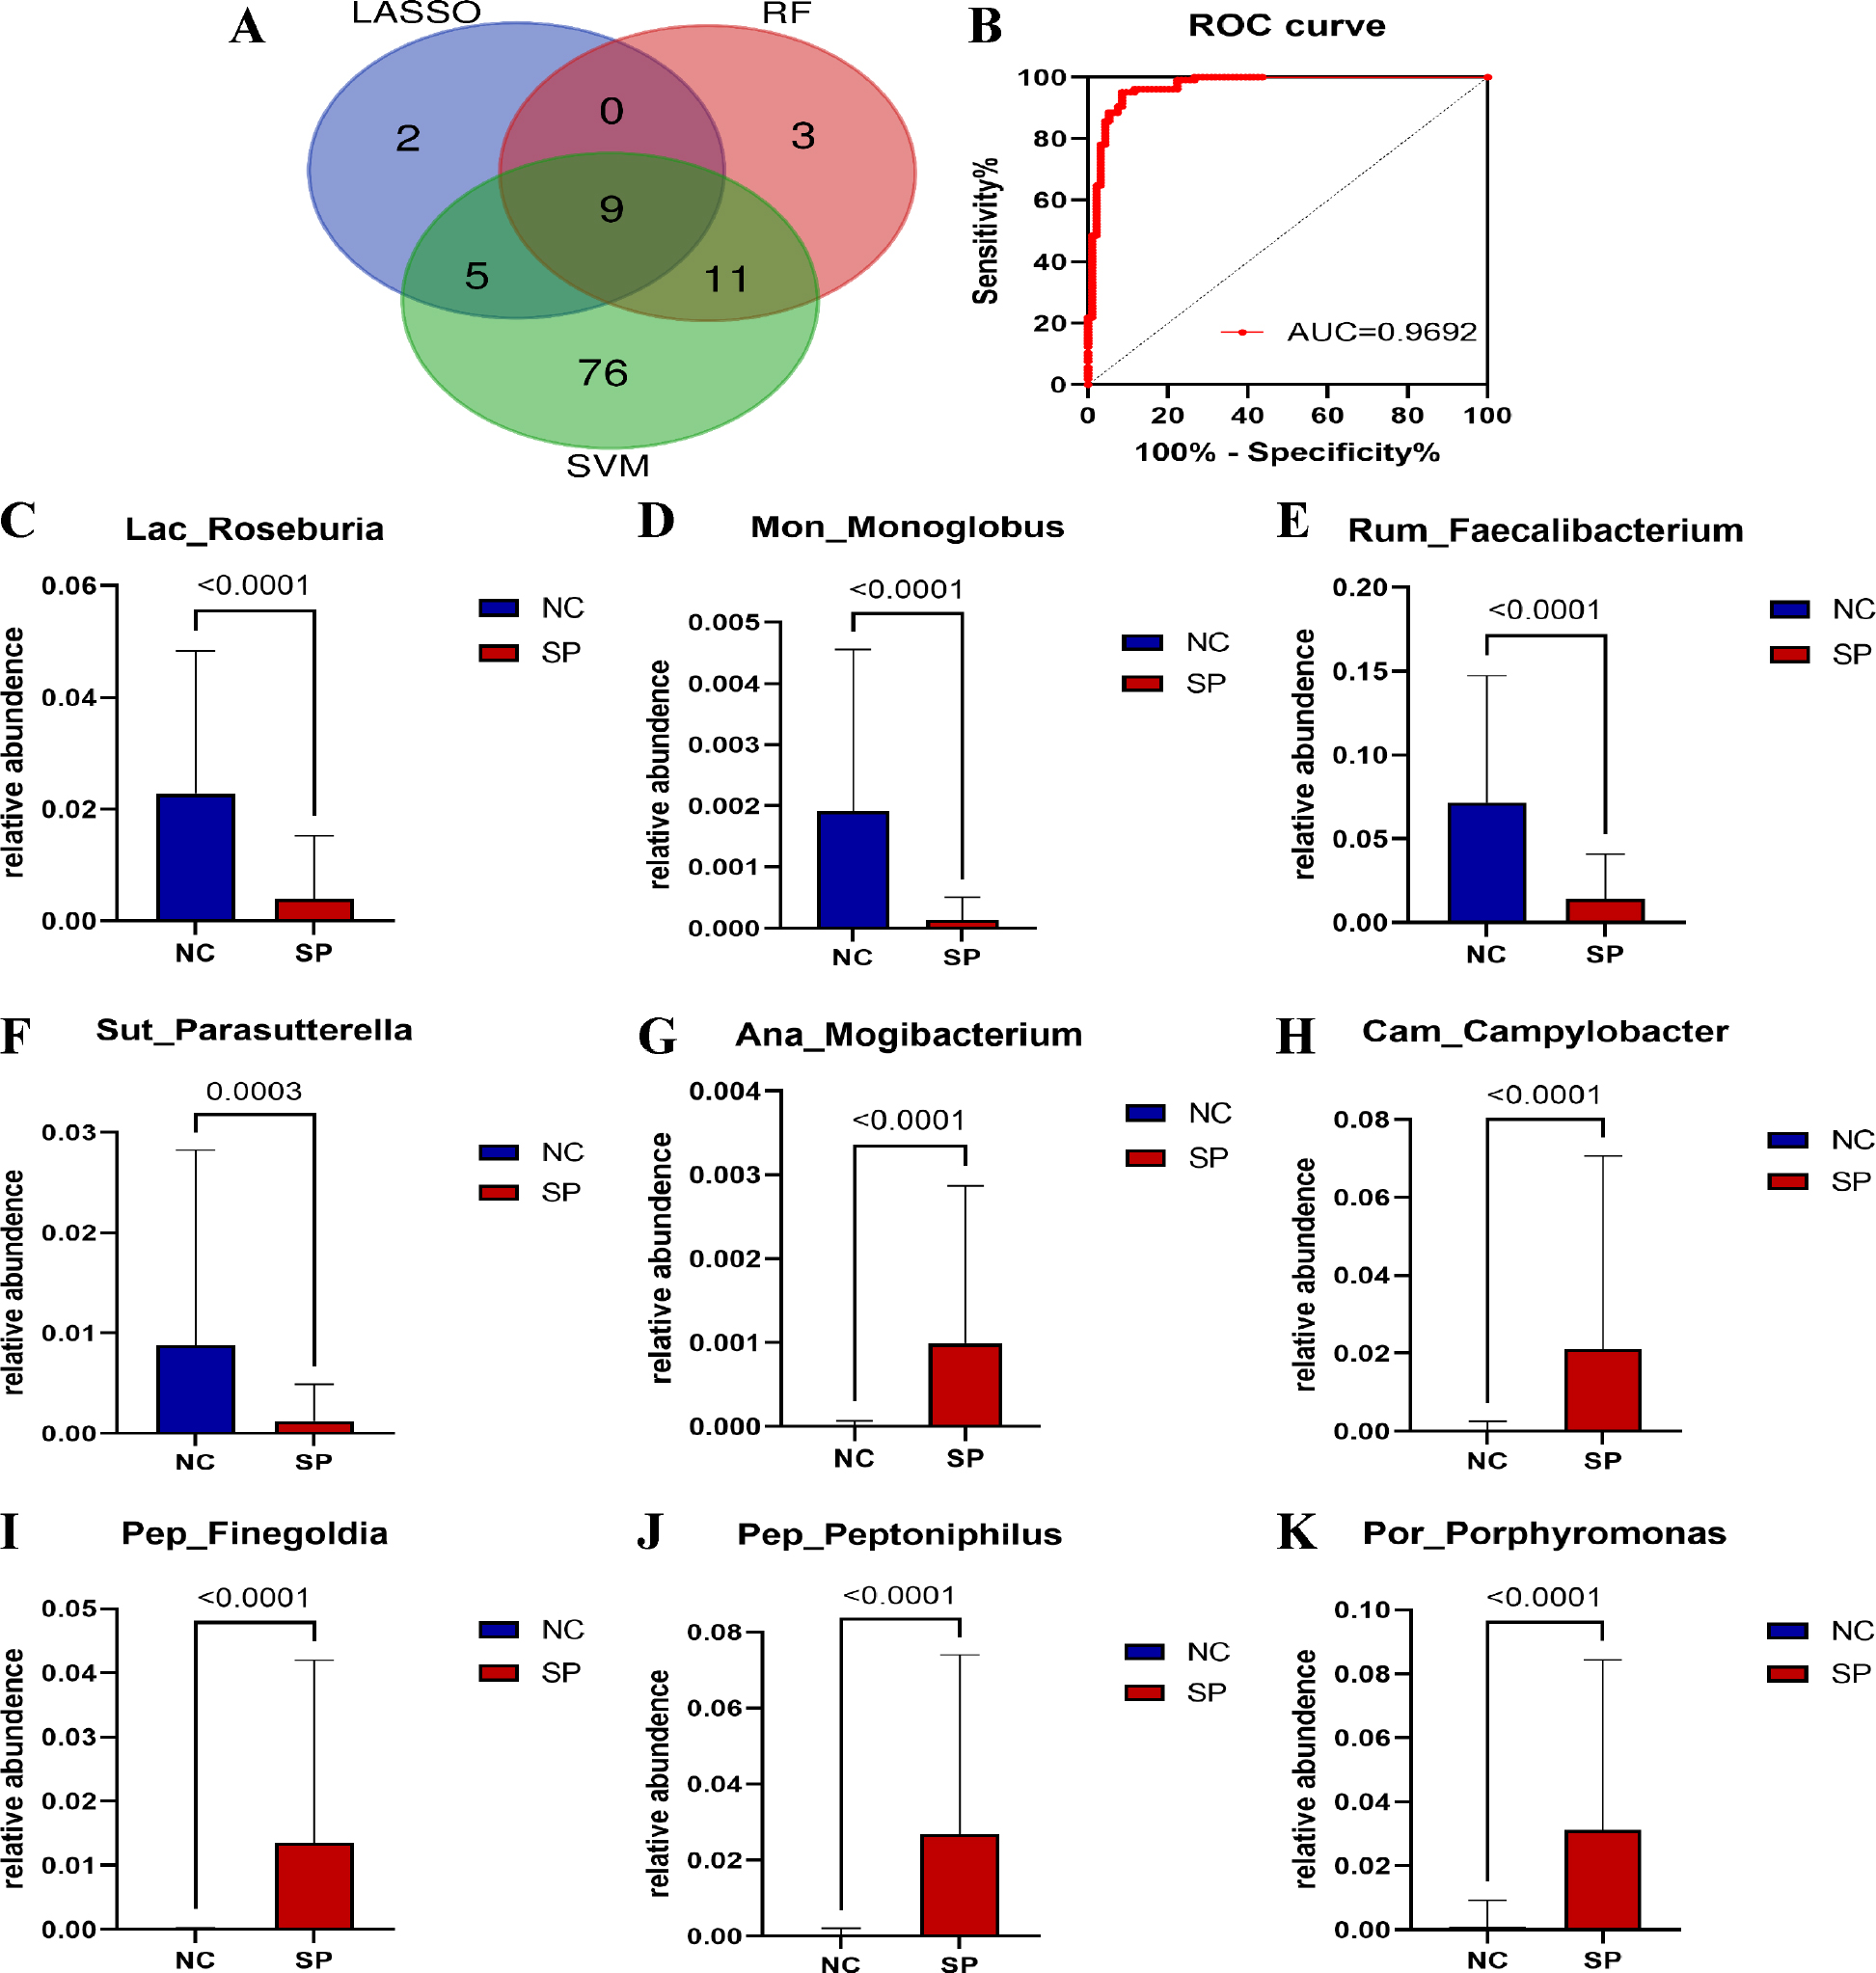
Fig. 4.
Evaluation of intestinal characteristic microbial markers in patients with severe pneumonia. The Venn diagram shows the selection of nine microbial markers by three machine learning methods (A). The ROC curve of the combined model of nine microbial markers (B). Changes in the relative abundance of nine microbial markers in patients with severe pneumonia (C–K).