
Legionella pneumophila is a type of Gram-negative rod-shaped bacterium belonging to the Legionellaceae family, with over 60 known species (Burillo et al. 2017). L. pneumophila is widely present in natural environments, especially in water bodies such as rivers, lakes, and hot springs. They typically thrive at temperatures between 25 and 45 degrees Celsius, with an optimal growth temperature of 35-37 degrees Celsius. L. pneumophila is a typical waterborne pathogen and can cause severe Legionnaires’ disease and Pontiac fever (Herwaldt and Marra 2018; Graham et al. 2024; Romanov and O’Connor 2024).
Legionnaires’ disease is a severe form of pneumonia caused by L. pneumophila, characterized by high fever, cough, difficulty breathing, and lung infections. The primary mode of transmission for Legionnaires’ disease is inhalation of infectious aerosols or droplets via the respiratory tract, such as contaminated water droplets. The incubation period for Legionnaires’ disease is generally 2-10 days, and patients often develop severe lung complications, sometimes leading to death (Palusińska-Szysz and Cendrowska-Pinkosz 2009). Pontiac fever is a milder form of L. pneumophila infection, with symptoms including fever, muscle aches, headache, and fatigue. The transmission route of Pontiac fever is similar to that of Legionnaires’ disease, but its course is shorter, usually resolving within 2-5 days (Abu Khweek and Amer 2018; Fang et al. 2023).
L. pneumophila infections are primarily spread through water sources, especially in facilities that produce water mist, such as hot water systems, air conditioning systems, fountains, and showers (Bonetta et al. 2010; Soda et al. 2017; Toplitsch et al. 2021; Walker and McDermott 2021; Burlingame and Bartrand 2024). In these facilities, L. pneumophila can form biofilms, adhere to the walls of pipes, and be released into the air through water droplets or aerosols, leading to human inhalation and subsequent infection. Additionally, L. pneumophila can cause infection through direct contact with contaminated water sources such as swimming pools, hot springs, and water towers (Ahmed et al. 2019).
The detection of L. pneumophila, especially in water environments, is crucial for preventing and controlling disease. Therefore, it is necessary to develop a rapid, sensitive, and convenient method for detecting L. pneumophila. Currently, L. pneumophila detection mainly involves culture-based methods and polymerase chain reaction (PCR) methods (Behets et al. 2007; Yaradou et al. 2007; Morio et al. 2008). Culture-based methods have long been considered the gold standard for bacterial detection. However, their long incubation period, high skill and environmental requirements, and poor tolerance to inhibition are limiting factors for their clinical application (Avni et al. 2016; Collins et al. 2017). The reaction conditions of PCR methods involve cycling between high and low temperatures, which require high-quality detection equipment and well-equipped laboratory, posing significant limitations for outdoor testing in specific environments (Krøjgaard et al. 2011; Samhan et al. 2017; Falzone et al. 2020).
In recent years, CRISPR technology has played a role in the detection of the novel coronavirus. CRISPR/Cas12a, when combined with the target sequence, becomes activated by the target sequence, cutting the target sequence and the ssDNA fluorescent probe in the reaction system, releasing a fluorescent signal, thereby achieving accurate and rapid detection. This fluorescent signal can be detected with fluorescent devices or displayed on lateral flow strips, the latter of which significantly enhances detection flexibility (Gootenberg et al. 2017; Chen et al. 2018; Broughton et al. 2020). Additionally, to improve the overall detection sensitivity, it is necessary to amplify the target sequence. We prefer using recombinase polymerase amplification (RPA) technology (Tan et al. 2022; Xu et al. 2024), which has lower environmental requirements, to first amplify the target sequence, followed by subsequent detection, constituting the RPA-CRISPR/Cas12a detection method (Kozel et al. 2017; Pierre et al. 2017).
The tested strains were L. pneumophila and five common Legionella species in the environment, including Legionella longbeachae, Legionella anisa, Legionella gormanii, Legionella feeleii, and Legionella dumoffii. The strains of common environmental bacteria, as shown in Table I, were also included. They were purchased from ATCC® (American Type Culture Collection) and stored in Autobio Diagnostics Co., Ltd. (China).
Bacterial strains.
| Identification number | Bacteria name |
|---|---|
| ATCC® 33152™ | Legionella pneumophila |
| ATCC® 33484™ | Legionella longbeachae |
| ATCC® 35292™ | Legionella anisa |
| ATCC® 33297™ | Legionella gormanii |
| ATCC® 35072™ | Legionella feeleii |
| ATCC® 33279™ | Legionella dumoffii |
| ATCC® 25586™ | Fusobacterium nucleatum |
| ATCC® 19606™ | Acinetobacter baumannii |
| ATCC® 17666™ | Stenotrophomonas maltophilia |
| ATCC® 25608™ | Burkholderia cepacia |
| ATCC® 19418™ | Haemophilus influenzae |
| ATCC® 49619™ | Streptococcus pneumoniae |
| ATCC® 25238™ | Moraxella catarrhalis |
| ATCC® 10031™ | Klebsiella pneumoniae |
| ATCC® 25923™ | Staphylococcus aureus |
| ATCC® 25922™ | Escherichia coli |
| ATCC® 27853™ | Pseudomonas aeruginosa |
The RPA amplification kit was purchased from TwistDx™ (UK). The LBa Cas12 enzyme was purchased from New England BioLabs (USA). The primers and probes were obtained from GENERAL BIOL (China). Nucleic acid extraction and purification were performed using reagents from TIANGEN Biotech(Beijing)Co., Ltd. (China). Water purification was achieved with the Milli-Q® system from Millipore® (Merck KGaA, Germany). Real-time PCR was conducted using the Applied Biosystems® 7500 instrument from Thermo Fisher Scientific Inc., (USA). Tiosbio® Cas 12/13 Dedicated Nucleic Acid Test Strips were purchased from Tiosbio (China).
1.0 ml of sterile saline was added to the bacterial strain lyophilized powder, mixed well, then inoculated on blood agar plates for activation. They were incubated in anaerobic conditions (using anaerobic bags or chambers) at 35-37°C for 48 hours. Other bacterial strains were also be inoculated on blood agar plates and incubated at 37°C for 24-48 hours. After incubation, single colonies were picked from the cultured strains and added to the liquid culture medium for enumeration. The bacterial concentration was greater than 108 CFU/ml. For L. pneumophila DNA extraction, the TianGen DP316 kit was used and the manufacturer’s instructions for nucleic acid extraction were followed. The sample volume was 200 ül, and the elution volume was 100 ül.
The NCBI database was used to analyze and compare the mip sequence of L. pneumophila from which the RPA primers and crRNAs were designed (Fig. 1). As shown in Table II, we first designed three primers and two crRNAs for subsequent selection. The RPA primers and crRNA were synthesized by Generalbiol (China).
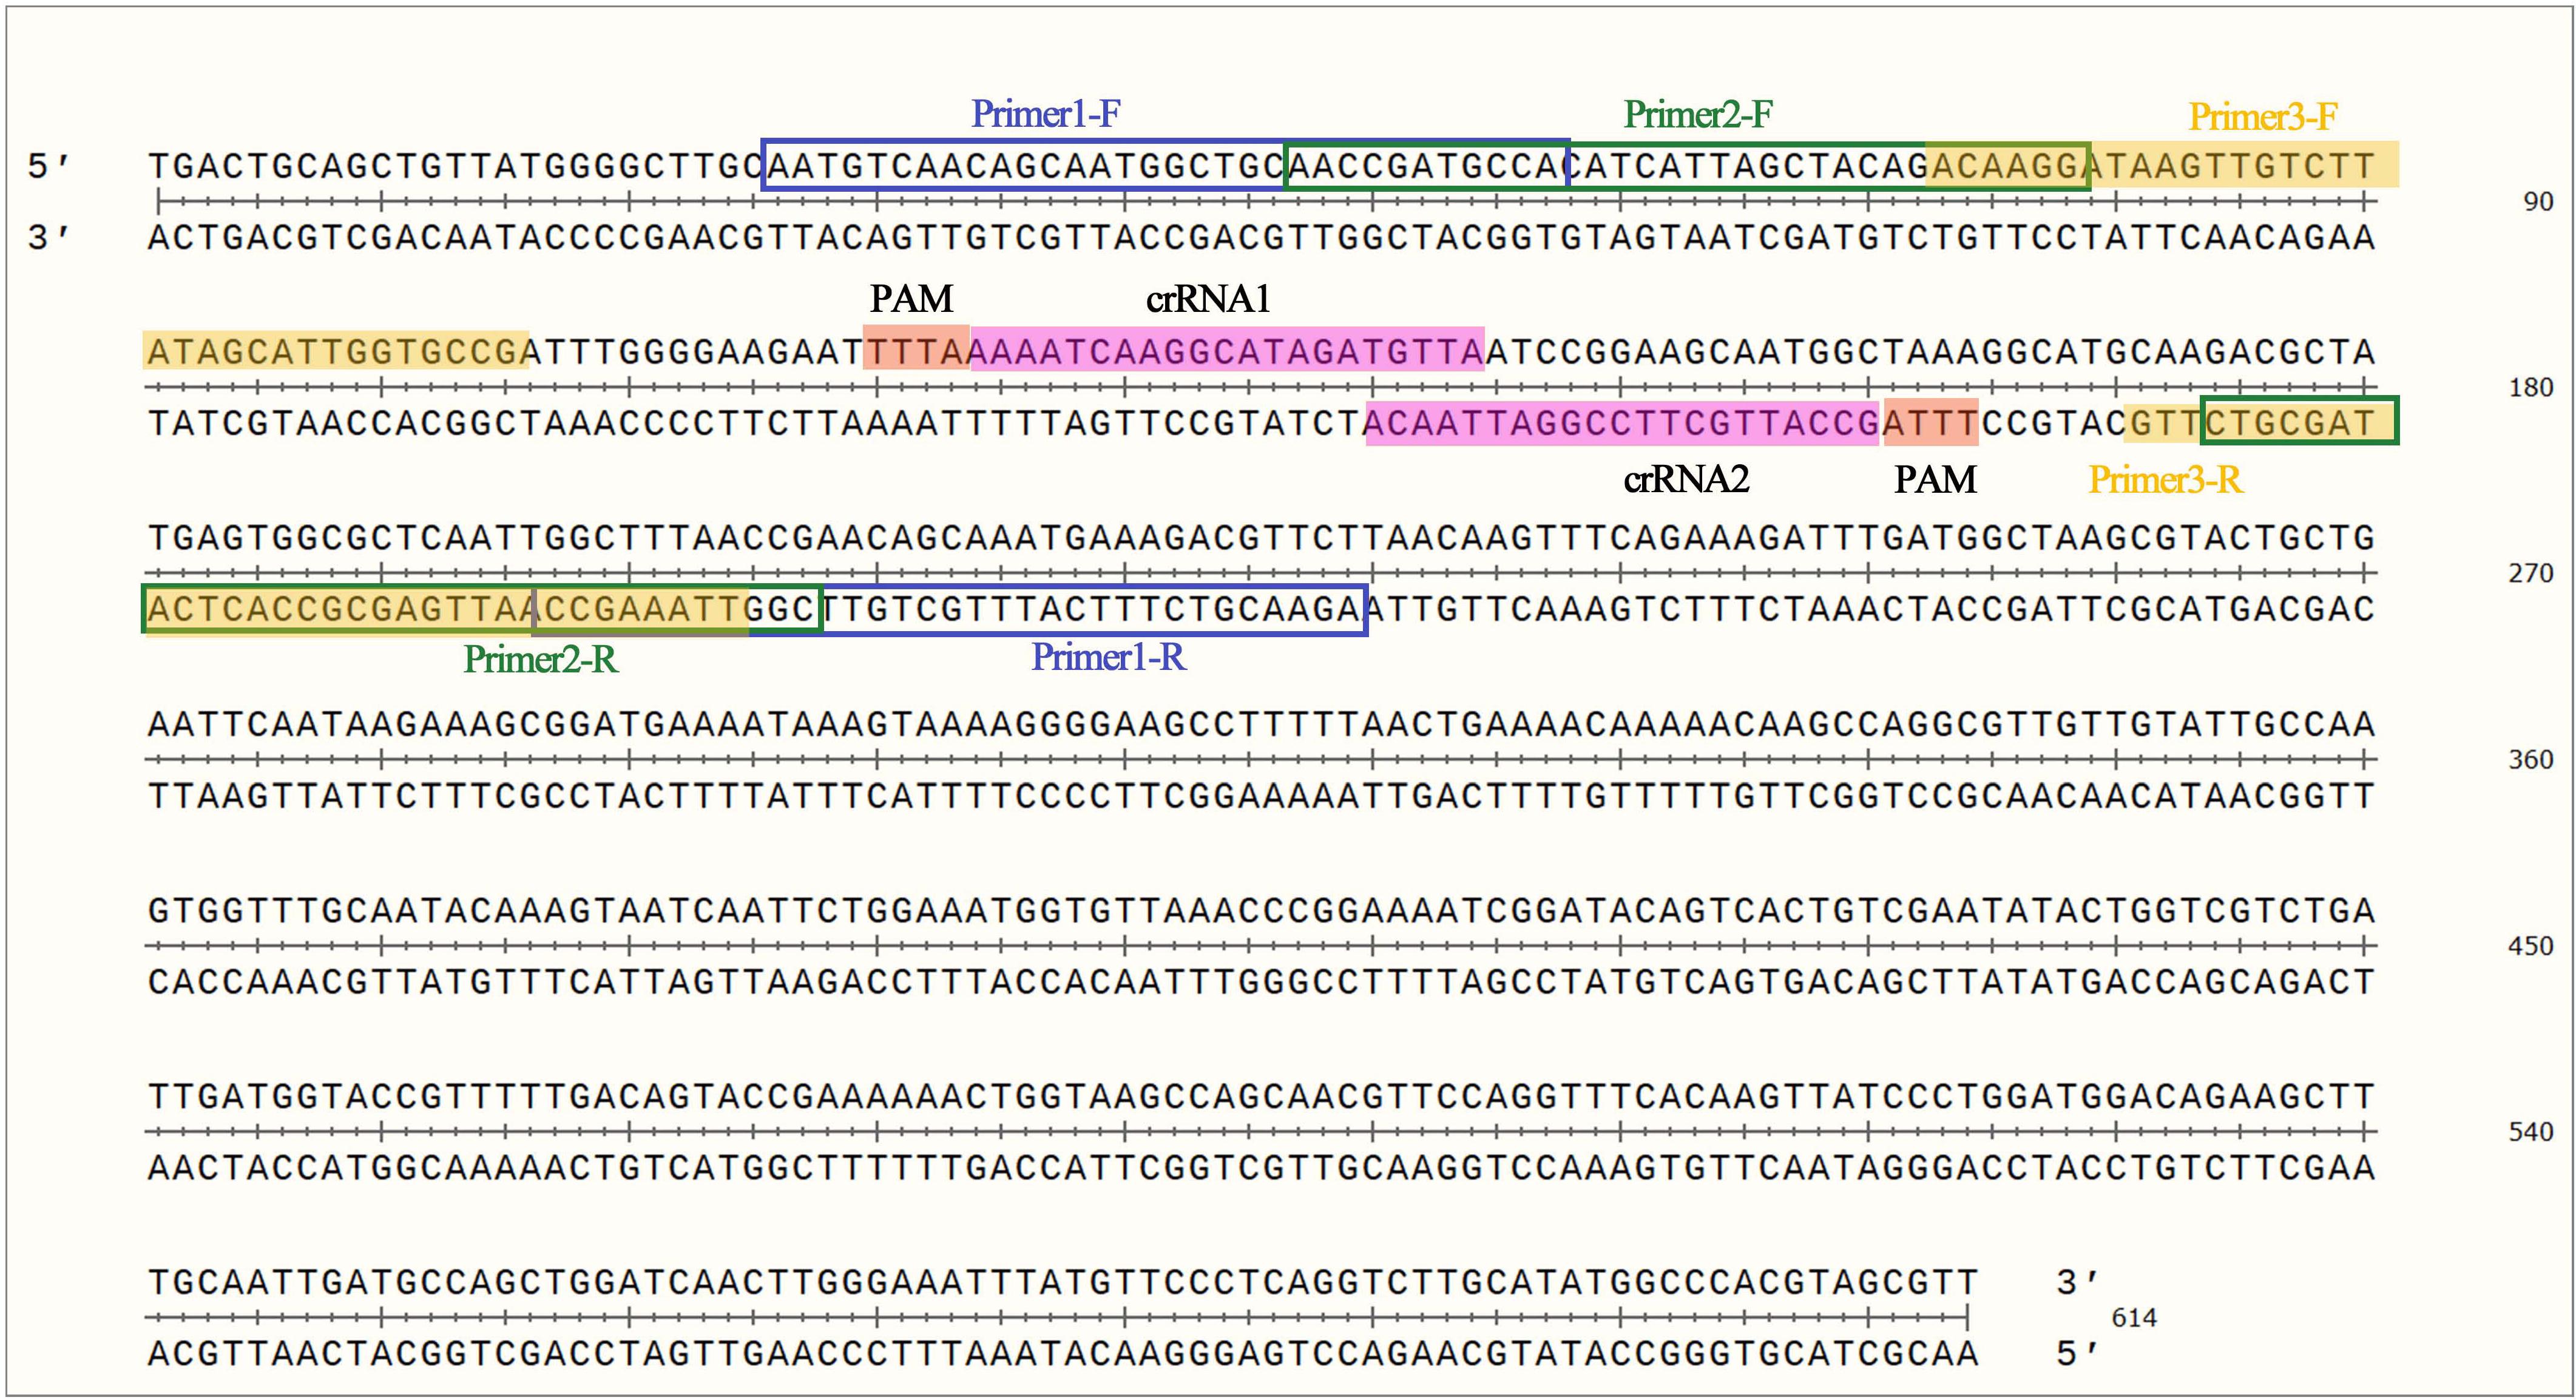
Lp genome map showing primers and crRNAs.
The sequence of RPA primers and crRNA.
| Name | Sequences 5’-3’ |
|---|---|
| Primer 1 | F: AACCGATGCCACATCATTAGCTACAGACAAGG |
| Primer 2 | F: AATGTCAACAGCAATGGCTGCAACCGATGCCA |
| Primer 3 | F: ACAAGGATAAGTTGTCTTATAGCATTGGTGCCG |
| Lp-crRNA1 | UAAUUUCUACUAAGUGUAGAU |
| Lp-crRNA2 | UAAUUUCUACUAAGUGUAGAU |
The three pairs of designed RPA primers were amplified for 30 minutes, and the optimal RPA primers were selected based on agarose gel electrophoresis results. Using the selected optimal primers, RPA reactions were conducted for 5, 10, 15, 20, 25, and 30 minutes, respectively, and the optimal RPA reaction time was determined based on agarose gel electrophoresis.
RPA reaction system refered to the manufacturer’s manual: each RPA reaction system consisted of 50 μl, including 29.4 μl of A buffer, 2 μl each of the upstream and downstream primers, DNA template 2 μl, purified water 12.1 μl and B buffer 2.5 μl. The RPA reaction was carried out at 38°C.
In the CRISPR/Cas12a reaction, the selection of the crRNA and the reaction time significantly impact the sensitivity and specificity of the detection results. Along with the optimized RPA reaction, we performed CRISPR/Cas12a reactions using crRNA1 and crRNA2, respectively, and compared the fluorescence curves to select the optimal crRNA and determine the reaction time. Basic protocol is as follows: in a centrifuge tube, add 13.4 μl of ultrapure water, 2 μl of NEBuffer 2.1, 0.4 μl of Lba Cas12a (Cpf1) (5 μmol/l), 0.5μL of RNAse Inhibitor (40U/μl), 0.5 μl of DTT (0.1 mmol/l), 0.8 μl of fluorescence reporting probe (FAM-TTATT-BHQ1) (2 μmol/l), and 0.4 μl of crRNA1/2 (0.01 mmol/l). After mixing the above solution with 18 μl, add 2 μl of the RPA reaction system amplification product, place it in a real-time fluorescence PCR instrument (Applied Biosystems® 7500), and set the temperature to 37°C to measure the real-time fluorescence curve.
We visualized the detection results of the optimized RPA-CRIS-PR/Cas12a reaction using fluorescence detection and a Lateral Flow Biosensor (LFB), respectively, to construct an RPA-CRISPR/Cas12a detection system for Lp and to investigate the optimal probe concentration for these two methods.
RPA-CRISPR/Cas12a fluorescence detection was according to the protocol described in the foregoing text, with 1 μl of the fluorescent probe was used (choose optimal concentration from 0.5μmol/l, 1 μmol/l, 1.5 μmol/l, 2 μmol/l, and 2.5 μmol/l), the temperature was set to 37°C to measure real-time fluorescence curve.
RPA-CRISPR/Cas12a LFB: 1 μl of LFB probe (FITC-TTTTTTTTTT-Biotin) at the concentrations from 0.5 μmol/l, 1μmol/L, 1.5 μmol/l, 2 μmol/l, 2.5 μmol/l), and 0.4 μl of crRNA (0.01 mmol/l) was used. After mixing the above solution with 18 μl, 2 μl of the RPA pre-reaction system amplification product was added and mixed well and then incubated at 37°C for 10 minutes. After the reaction was complete, 80 μl of ultrapure water was added and mixed. Then 50 μl was added to the lateral flow immunoassay strip for testing. The strip’s color within 10 minutes was observed.
In order to determine the sensitivity of RPA-CRISPR/Cas12a detection for L. pneumophila, construct the plasmid pUC19-mip containing the recombinant Legionella mip gene fragment and dilute it to 50,000 copies/μl, 5,000 copies/μl, 500 copies/μl, 50 copies/μl, 5 copies/μl, and 1 copy/μl. Each reaction uses 2 μl as a template. The RPA-CRISPR/Cas12a fluorescence and RPA-CRISPR/Cas12a LFB system were used to detect the above samples, and the lowest concentration detected was determined as the detection sensitivity.
The bacteria in Table I were used as detection targets to test the method’s specificity. Extract their genomic DNA and add it to the RPA-CRISPR/Cas12a fluorescence detection and RPA-CRISPR/Cas12a LFB. L. pneumophila and water were used as positive and negative controls, respectively.
Water samples were collected from 4 cities in Henan Province. In detail, 10 samples were collected from each of the following sources in each city: river water, shower water in hotels, cooling water from air conditioners in hospitals, and warm tap water from restrooms in shopping malls, for a total of 160 water samples.
DNA was extracted from water samples and detected by self-built RPA-CRISPR/Cas12a LFB and the classic qPCR method (LpnF TTGTCTTATAGCATTG-GTGCCG, LpnR CCAATTGAGCGCC ACTCATAG, LpnP Cy3-CGGAAGCAATGGCTAAAGGCATG-CA-BHQ2) for parallel comparison (Collins et al. 2015).
SPSS 19.0 software was used for statistical analysis. The results were expressed as means ± standard deviations of three independent experiments. Individual comparisons were made by Chisquare test for paired data, and p-values less than 0.05 were considered to be significant.
The mip gene is relatively conserved and has been widely used as a target for Legionella detection (Morio et al. 2008; Fittipaldi et al. 2010; Toplitsch et al. 2018; Yin et al. 2022). Therefore, we selected the mip gene as the target gene in this study to design RPA primers. To enhance the specificity of the RPA reaction and reduce reaction time, we screened for optimal RPA primers and determined optimal amplification times. The electrophoresis results showed that all three pairs of primers successfully amplified the target bands, among which primer 3 showed specific amplification with clear, uniform bands (Fig. 2A). Then, we conducted RPA reactions with the optimal primer for 5, 10, 15, 20, 25, and 30 minutes, respectively. Amplification products emerged at 10 minutes, and their quantity did not increase with prolonged time (Fig. 2B). Thus, primer 3 was chosen, and the RPA amplification time was set at 10 minutes.
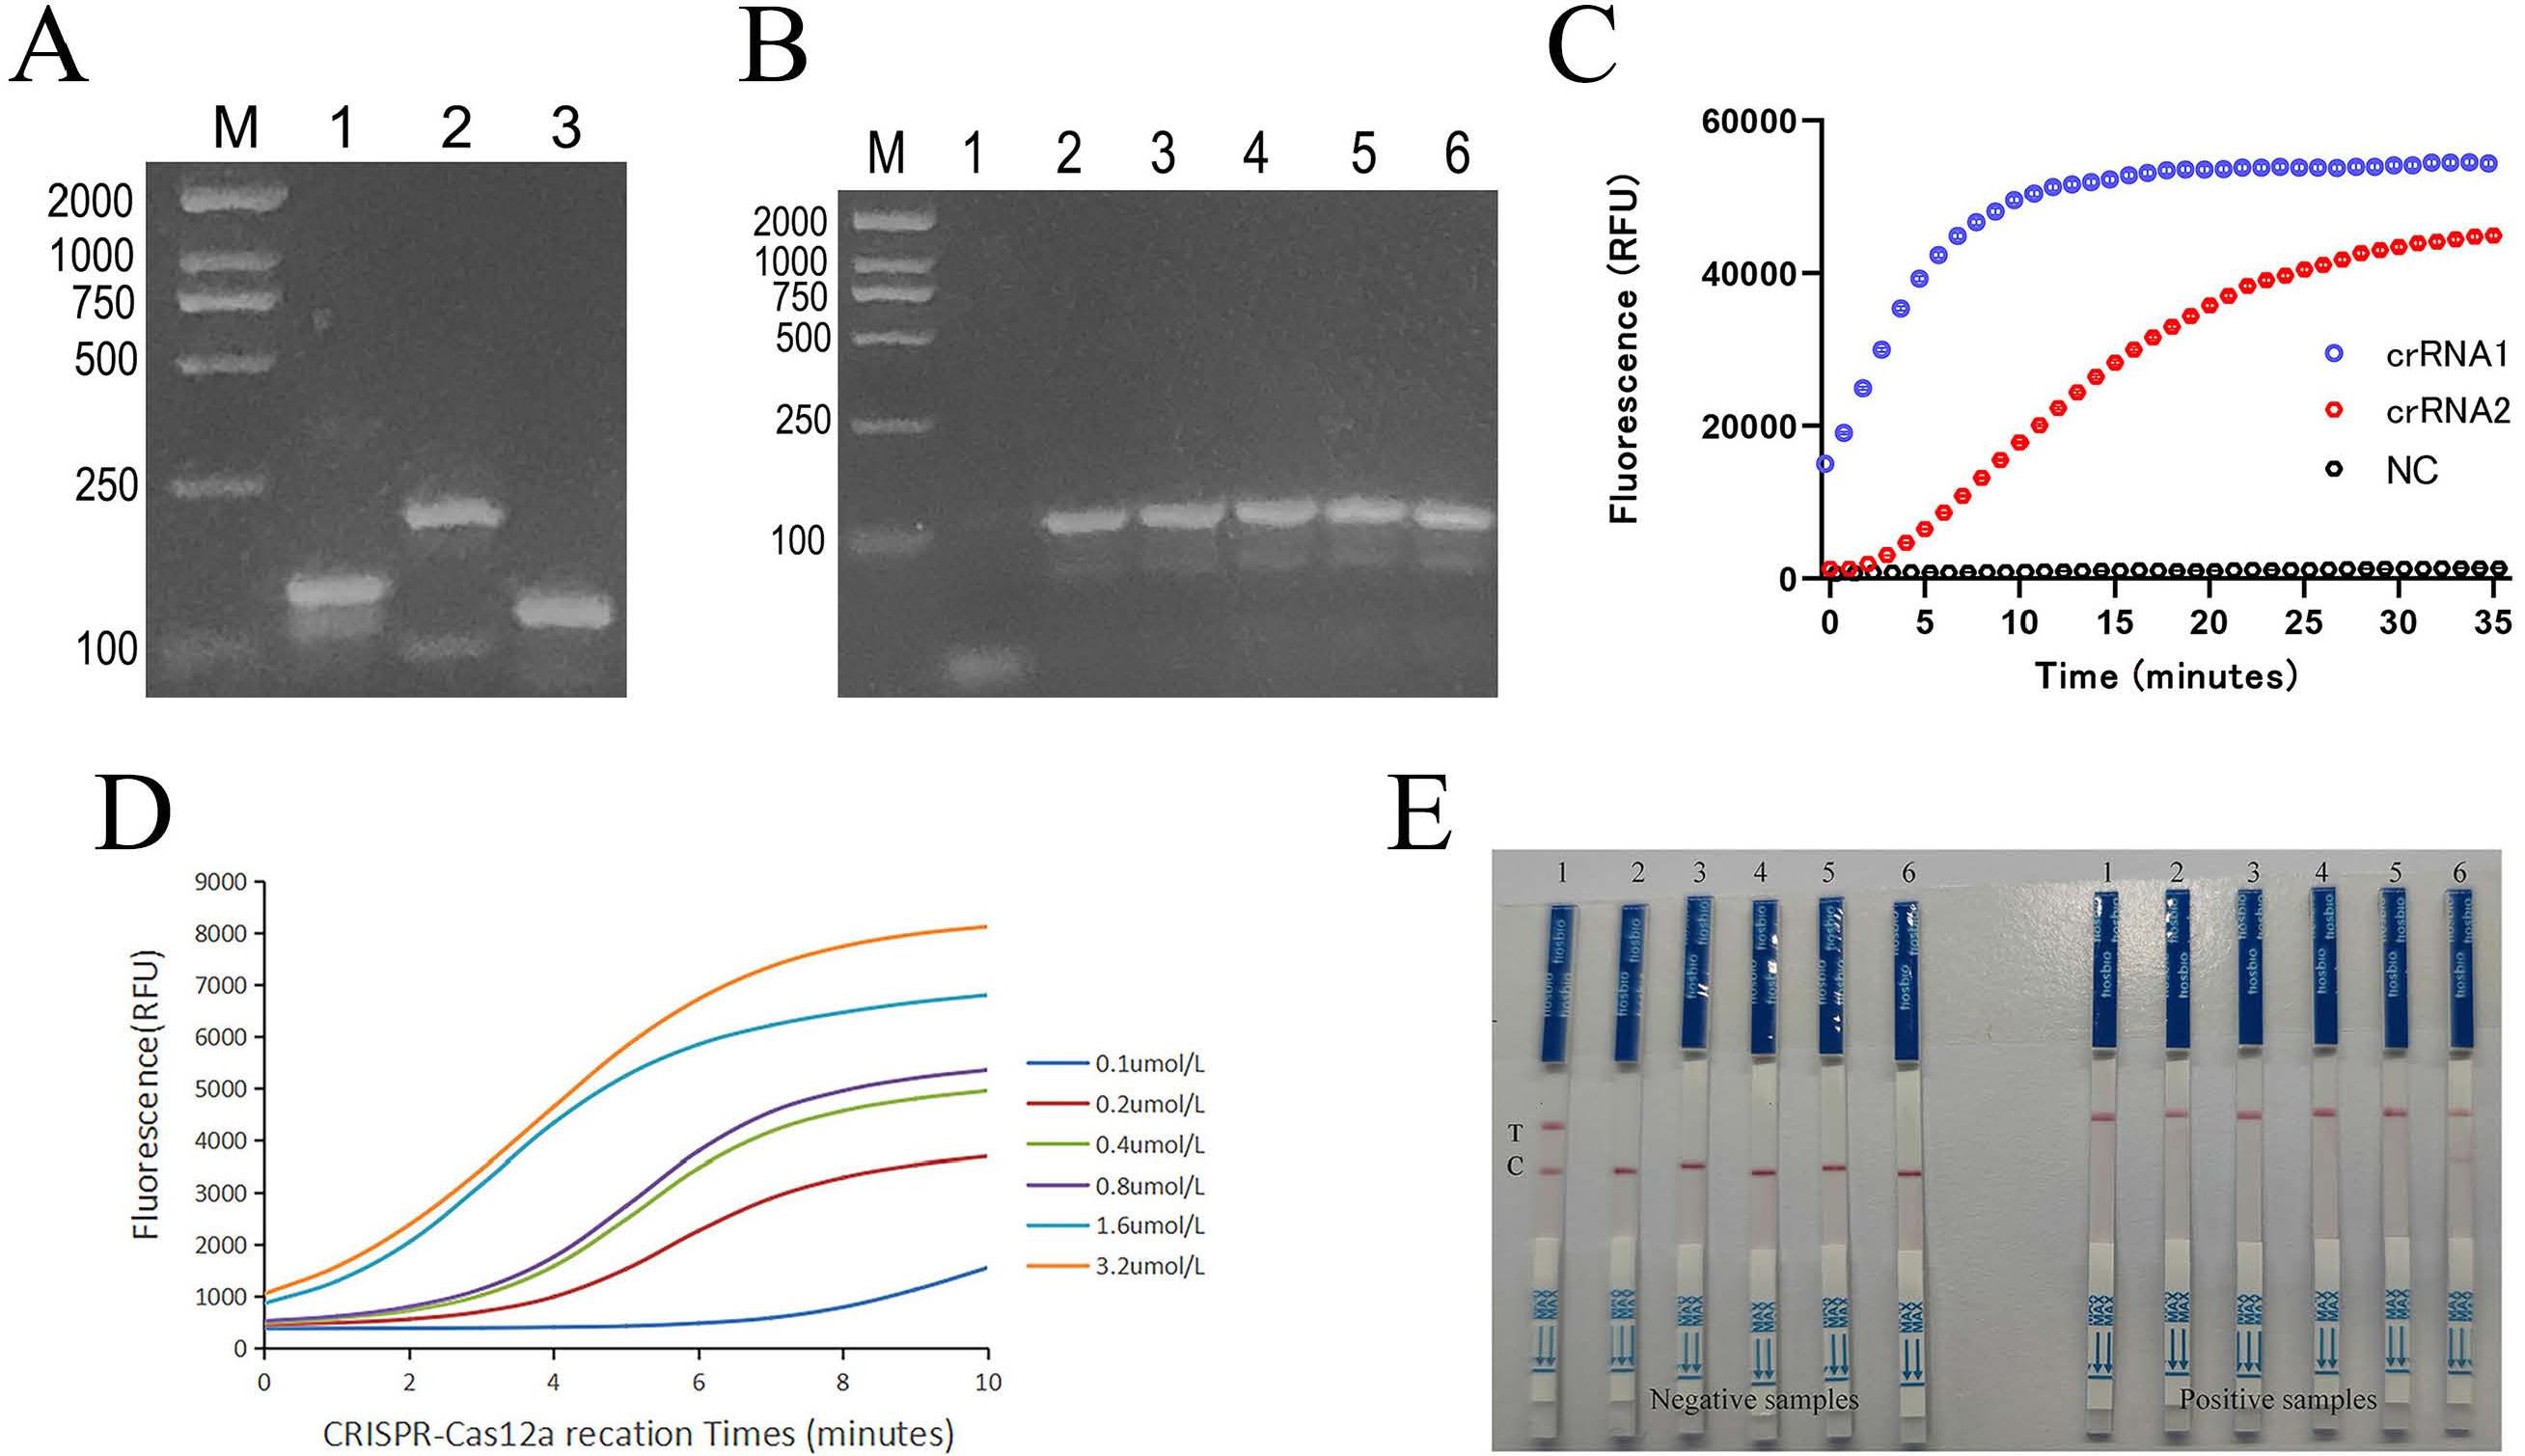
Optimization of RPA-CRISPR/Cas12a detection system.
A) Screening for the best RPA primer. Lane 1 - Amplification fragments of primer 1-F&R; Lane2 - Amplification fragments of primer 2-F&R; Lane3 - Amplification fragments of primer 3-F&R.
B) Screening for the best amplification time. Lanes 1-6 represent amplification time at 5, 10, 15, 20, 25, and 30 minutes.
C) Real time fluorescence signal of two crRNA designed for RPA-CRISPR/Cas12a system. Blue - crRNA 1; red - crRNA 2; gray - without crRNA.
D) The fluorescence curves of different concentrations of the fluorescent reporting probe.
E) The image of RPA-CRISPR/Cas12a LFB system by different concentrations of the reporting probe. (The fluorescence reporting probe concentrations represented by samples 1-6 are 0.1 μmol/l, 0.2 μmol/l, 0.4 μmol/l, 0.8 μmol/l, 1.6 μmol/l, and 3.2 μmol/l, respectively. C - control line, T - test line.)
Using RPA-CRISPR/Cas12a fluorescence detection to screen the optimal crRNA. RPA was incubated at 37°C for 20 minutes, and the CRIS-PR/Cas12 reaction system was incubated at 37°C for 35 minutes (35 cycles, 1 minute each cycle). As shown in Fig. 2C, the fluorescence intensity of crRNA1 was higher than that of crRNA2 between 10 minutes and 35 minutes. Thus, crRNA1 was selected for subsequent experiments. Furthermore, the fluorescence curve for crRNA1 showed a plateau at 10 minutes. Therefore, the fluorescence measurement time was determined to be 10 minutes.
This study has successfully established an RPA-CRISPR/Cas12a fluorescence detection system and an RPA-CRISPR/Cas12a LFB. Then, we studied the probe concentrations for these two methods.
As for RPA-CRISPR/Cas12a fluorescent probe (FAM-TTATT-BHQ1), we selected concentrations of 0.1 μmol/l, 0.2 μmol/l, 0.4 μmol/l, 0.8 μmol/l, 1.6 μmol/l, and 3.2 μmol/l for optimization (Fig. 2D). The results showed that the fluorescence detection intensity increased with the increase of the fluorescent probe concentration. The difference between the fluorescence signal and the background fluorescence gradually increased. When the concentration of the fluorescent probe was 0.4 gmol/l, the difference between the fluorescence signal and the background fluorescence was more than threefold, meeting the detection requirements. Therefore, we determined the concentration of the fluorescent probe to be 0.4 μmol/l.
The next step is to optimize the concentration of the reporting probe (FITC-TTTTTTTTTT-Biotin) in RPA-CRISPR/Cas12a LFB. We performed gradient optimization at concentrations of 0.1 μmol/l, 0.2 μmol/l, 0.4 μmol/l, 0.8 μmol/l, 1.6 μmol/l, and 3.2 μmol/l, respectively testing negative and positive samples. During testing of negative samples, weak red bands appeared at the T line at 0.1 μmol/l and 0.2 μmol/l, with color intensity increasing as the detection concentration increased. However, there was little difference at 0.4 μmol/l (Fig. 2E). We therefore decided to use a probe concentration of 0.4 μmol/l.
We studied the detection sensitivity of the RPA-CRISPR/Cas12a detection system, synthesized the plasmid pUC19-mip containing the recombinant Legionella mip gene fragment, and then diluted it to the lowest concentration of 1 copy/μl. We used the RPA-CRISPR/Cas12a detection system for testing, with water as a blank control. The lowest detectable concentration in this system was considered the limit of detection (LOD).
The fluorescent detection sensitivity of RPA-CRIS-PR/Cas12a is shown in Fig. 3A and 3B. From the test results, it can be seen that the fluorescence signal for 5 copies/μl is above 10,000, whereas the 1 copy/μl sample shows no detectable fluorescence. The LOD of the RPA-CRISPR/Cas12a fluorescent detection system is 5.0 copies/μl. The sensitivity of the RPA-CRISPR/Ca-s12a LFB is shown in Figure 5C. From the test results, it can be seen that 5.0 copies/μl already produce a faint positive test band, and samples below 1 copy/μl do not show an obvious positive color band. The LOD of the RPA-CRISPR/Cas12a LFB is 5.0 copies/μl.
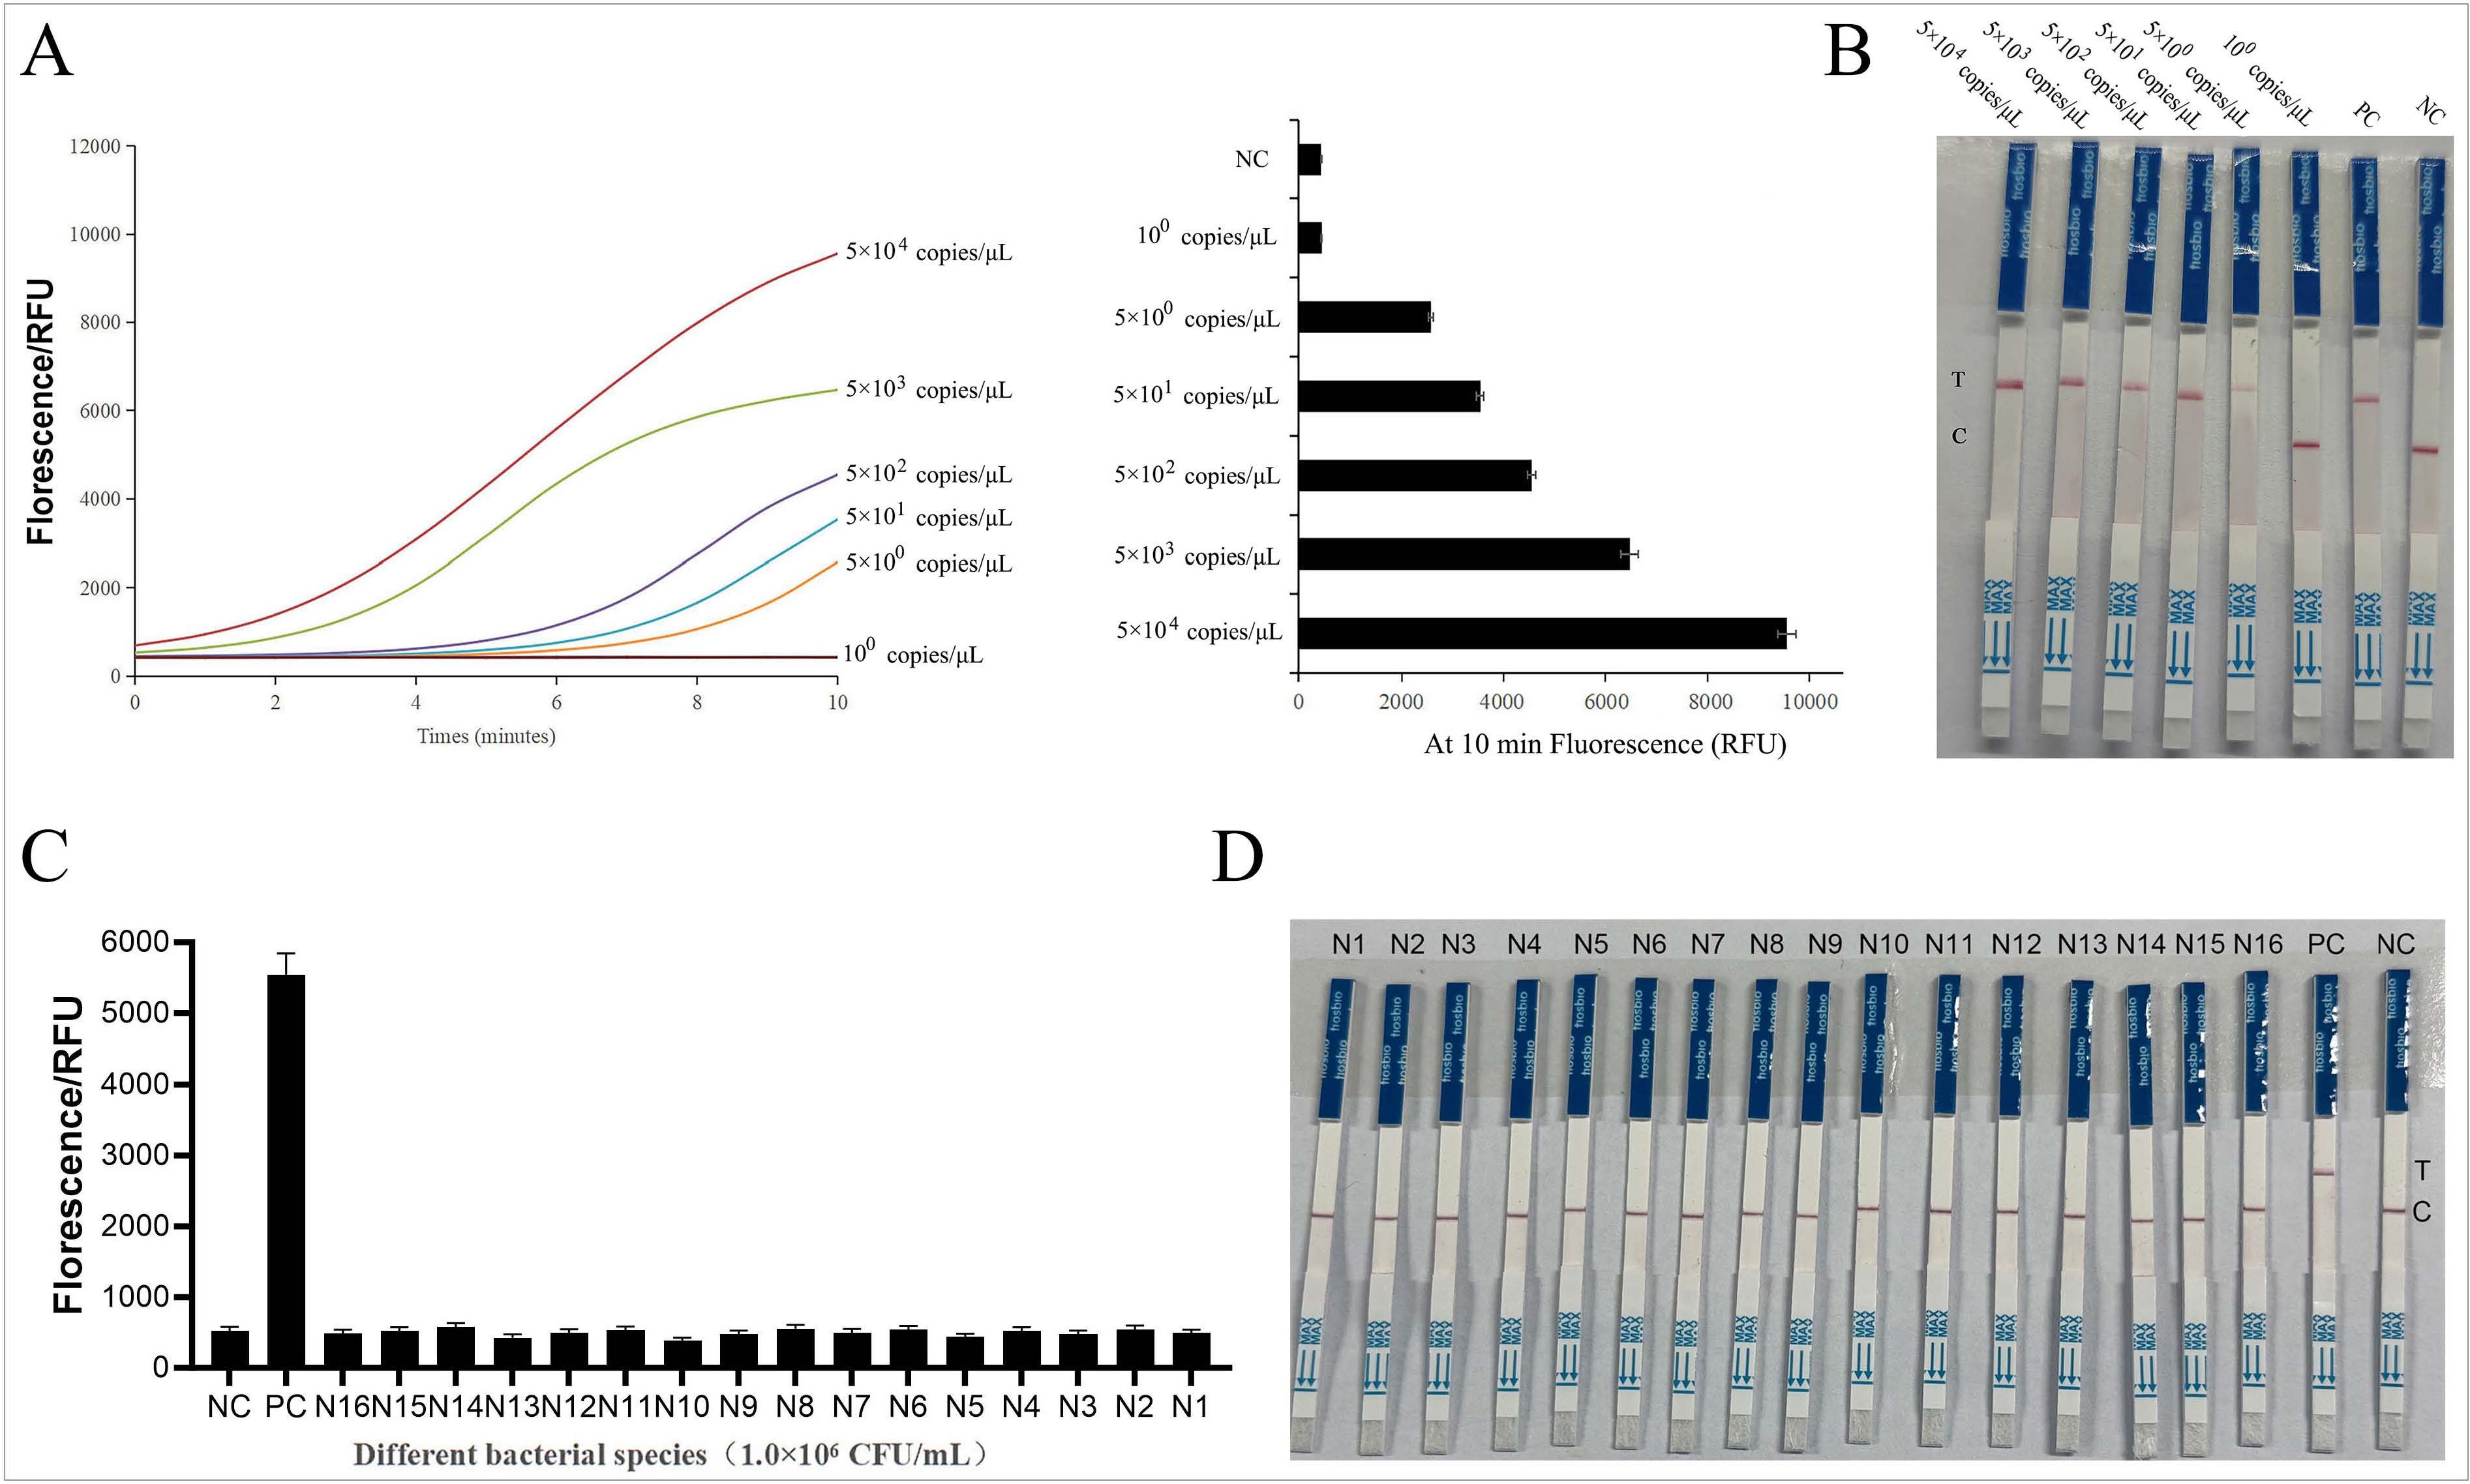
The sensitivity and specificity of the RPA-CRISPR/Cas12a fluorescent and LFB detection system.
A) The fluorescence curves of different concentrations of target DNA and the fluorescence values of different concentrations of target DNA at 10 minutes.
B) Sensitivity test of RPA-CRISPR/Cas12a LFB system by different concentrations of target DNA. NC - non-template control; PC - Legionella pneumophila target; C - control line, T - test line.
C) Specificity of the RPA-CRISPR/Cas12a fluorescent assay for the detection of L. pneumophila.
D) Specificity of the RPA-CRISPR/Cas12a LFB for the detection of L. pneumophila.
NC - non-template control; PC - Legionella pneumophila; N1 - Legionella longbeachae; N2 - Legionella anisa; N3 - Legionella gormanii; N4 - Legionella feeleii; N5 - Legionella dumoffii; N6 - Fusobacterium nucleatum; N7 - Acinetobacter baumannii; N8 - Acinetobacter baumannii; N9 - Burkholderia cepacia; N10 - Haemophilus influenzae; N11 - Streptococcus pneumoniae; N12 - Moraxella catarrhalis; N13 - Klebsiella pneumoniae; N14 - Staphylococcus aureus; N15 - Escherichia coli; N16 - Pseudomonas aeruginosa. C - control line, T - test line.
We used a self-built detection system to detect the bacteria shown in Table I, and L. pneumophila and water were used as positive and negative controls, respectively. The results are shown in Fig. 3C and 3D. The RPA-CRISPR/Cas12a fluorescence assay showed high fluorescence intensity for L. pneumophila, whereas other bacterial genera showed no detectable signals. The RPA-CRISPR/Cas12a LFB detection for L. pneumophila showed clearly positive color bands, while other bacterial genera showed no prominent positive color bands. The results indicate that both tests exhibited reasonable detection specificity.
To evaluate the effectiveness of RPA-CRISPR/Cas12a LFB in water samples from rivers, hotels, hospitals, and shopping malls, we simultaneously tested 160 samples using the established and optimized RPA-CRISPR/Cas12a LFB and the classical qPCR method. The comparison of the results is shown in Table III and Table SI-SIV. Among 160 water samples tested by the LFB method, 23 were positive and 137 were negative. The identical specimens were tested by qPCR, with 24 positive and 136 negative results. Based on the results of the two methods, a chi-square test was performed in SPSS 19.0, and the P value was greater than 0.05, indicating no significant difference between the two methods.
The results of two detection methods in environmental water samples.
| Methods | qPCR | Chi-square value | p-value | |||
|---|---|---|---|---|---|---|
| Positive | Negative | Total | ||||
| RPA-CRISPR/Cas12a LFB | Positive | 23 | 0 | 23 | 0.025 | 0.875 |
| Negative | 1 | 136 | 137 | |||
| Total | 24 | 136 | 160 | |||
The mip gene encodes the macrophage infectivity potentiator (MIP) protein, a key node in the virulence network of L. pneumophila. Its functions span multiple stages of bacterial infection, including host cell adhesion and invasion, intracellular survival and replication, motility and biofilm formation, immune evasion, and virulence synergy (Karagöz et al. 2022; Scheithauer et al. 2023). Given the complexity of its functions and its profound interactions with other virulence systems, mip is not only a research focus in studies of pathogenic mechanisms, but also a crucial target for vaccine development and antibacterial strategies (He et al. 2016; 2017), as well as an important target for nucleic acid detection and genotyping (Gong et al. 2017; Pascale et al. 2020). Numerous PCR-based methods for detecting Legionella have selected the mip gene as the target. Based on the mip gene sequence of L. pneumophila available in GenBank, we conducted a thorough analysis to select and design target regions for primers and crRNAs, confirming that these regions exhibit minimal variation while maintaining high conservation and specificity (Table II).
In this study, the RPA-CRISPR/Cas12a system for detecting L. pneumophila was established. Experiments showed that this system has advantages in sensitivity, specificity, rapidity, and economy. Furthermore, it is combined with LFB to realize naked-eye visualization of results. Without the need for professional technicians or expensive equipment, this system can be used for large-scale on-site detection and can even be operated by individuals at home, boasting broad application prospects.
Within the CRISPR/Cas12a system, the selection of an effective crRNA contributes to the efficiency of target recognition, binding, and cleavage, playing a crucial role in the detection results (Gootenberg et al. 2017). The two crRNAs designed in this study differ by only two nucleotides. However, during testing, crRNA1 rapidly reached a plateau within 10 minutes, with fluorescence in the first 10 minutes twice that of crRNA2 (Fig. 2C). Therefore, we chose crRNA1 and confirmed that fluorescence detection takes only 10 minutes.
In this study, in addition to obtaining results via fluorescence detection, we also aim to develop LFB with the advantage of portability. The probe concentration significantly affects the accuracy of LFB results. At a low probe concentration (0.1 μmol/l), AuNPs on the swab strip are incompletely captured by the C line, causing an abnormal light red T line in negative samples. Conversely, an excessively high concentration (3.2 μmol/l) leads to incomplete probe cleavage, resulting in an abnormal, light-red C line. Enhancing the specificity of a detection method is crucial for reducing the probability of false-positive and false-negative results. To address this, we combined the RPA reaction with the CRISPR reaction. On the one hand, we used RPA to amplify the sample DNA, where the selected primer enables specific amplification, and compared with traditional PCR and qPCR, RPA operates under isothermal conditions without the need for equipment and is less time-consuming (Tan et al. 2022). On the other hand, CRISPR/Cas12a has strong specific recognition, determined by crRNA-DNA complementarity and PAM. Our experimental results confirmed that our detection system exhibits strong specificity, whether detected by fluorescence or LFB, thus fulfilling our initial goal.
Finally, we investigated the applicability of the RPA-CRISPR/Cas12a LFB for detecting L. pneumophila in environmental samples. Comparison with the conventional qPCR method showed that the chisquare test P value was 0.875, indicating no significant difference between the two methods (Table III). The L. pneumophila detection method established in this study achieves rapidity and simplicity while maintaining high specificity and sensitivity, providing a feasible approach for the practical L. pneumophila detection task.
This method also has certain limitations: i) The L. pneumophila mip gene sequences deposited in GenBank cannot cover all mip sequences of L. pneumophila. If the target sequence to be detected has polymorphisms and variations, there is a risk of missing them. ii) The source distribution and quantity of specimens tested by this method are insufficient, and further validation with a larger sample size is required. iii) The impact of potential inhibitors in environmental samples on the detection method has not been explored. iv) The cost of quantitative detection we established is slightly higher than that of real-time fluorescent quantitative PCR.
This study established a rapid detection method for L. pneumophila, with a sensitivity of up to 5.0 copies/μl. The environmental sampling results are consistent with classical PCR detection. Therefore, the method developed in this study is very suitable and hopeful for outdoor research on L. pneumophila.