
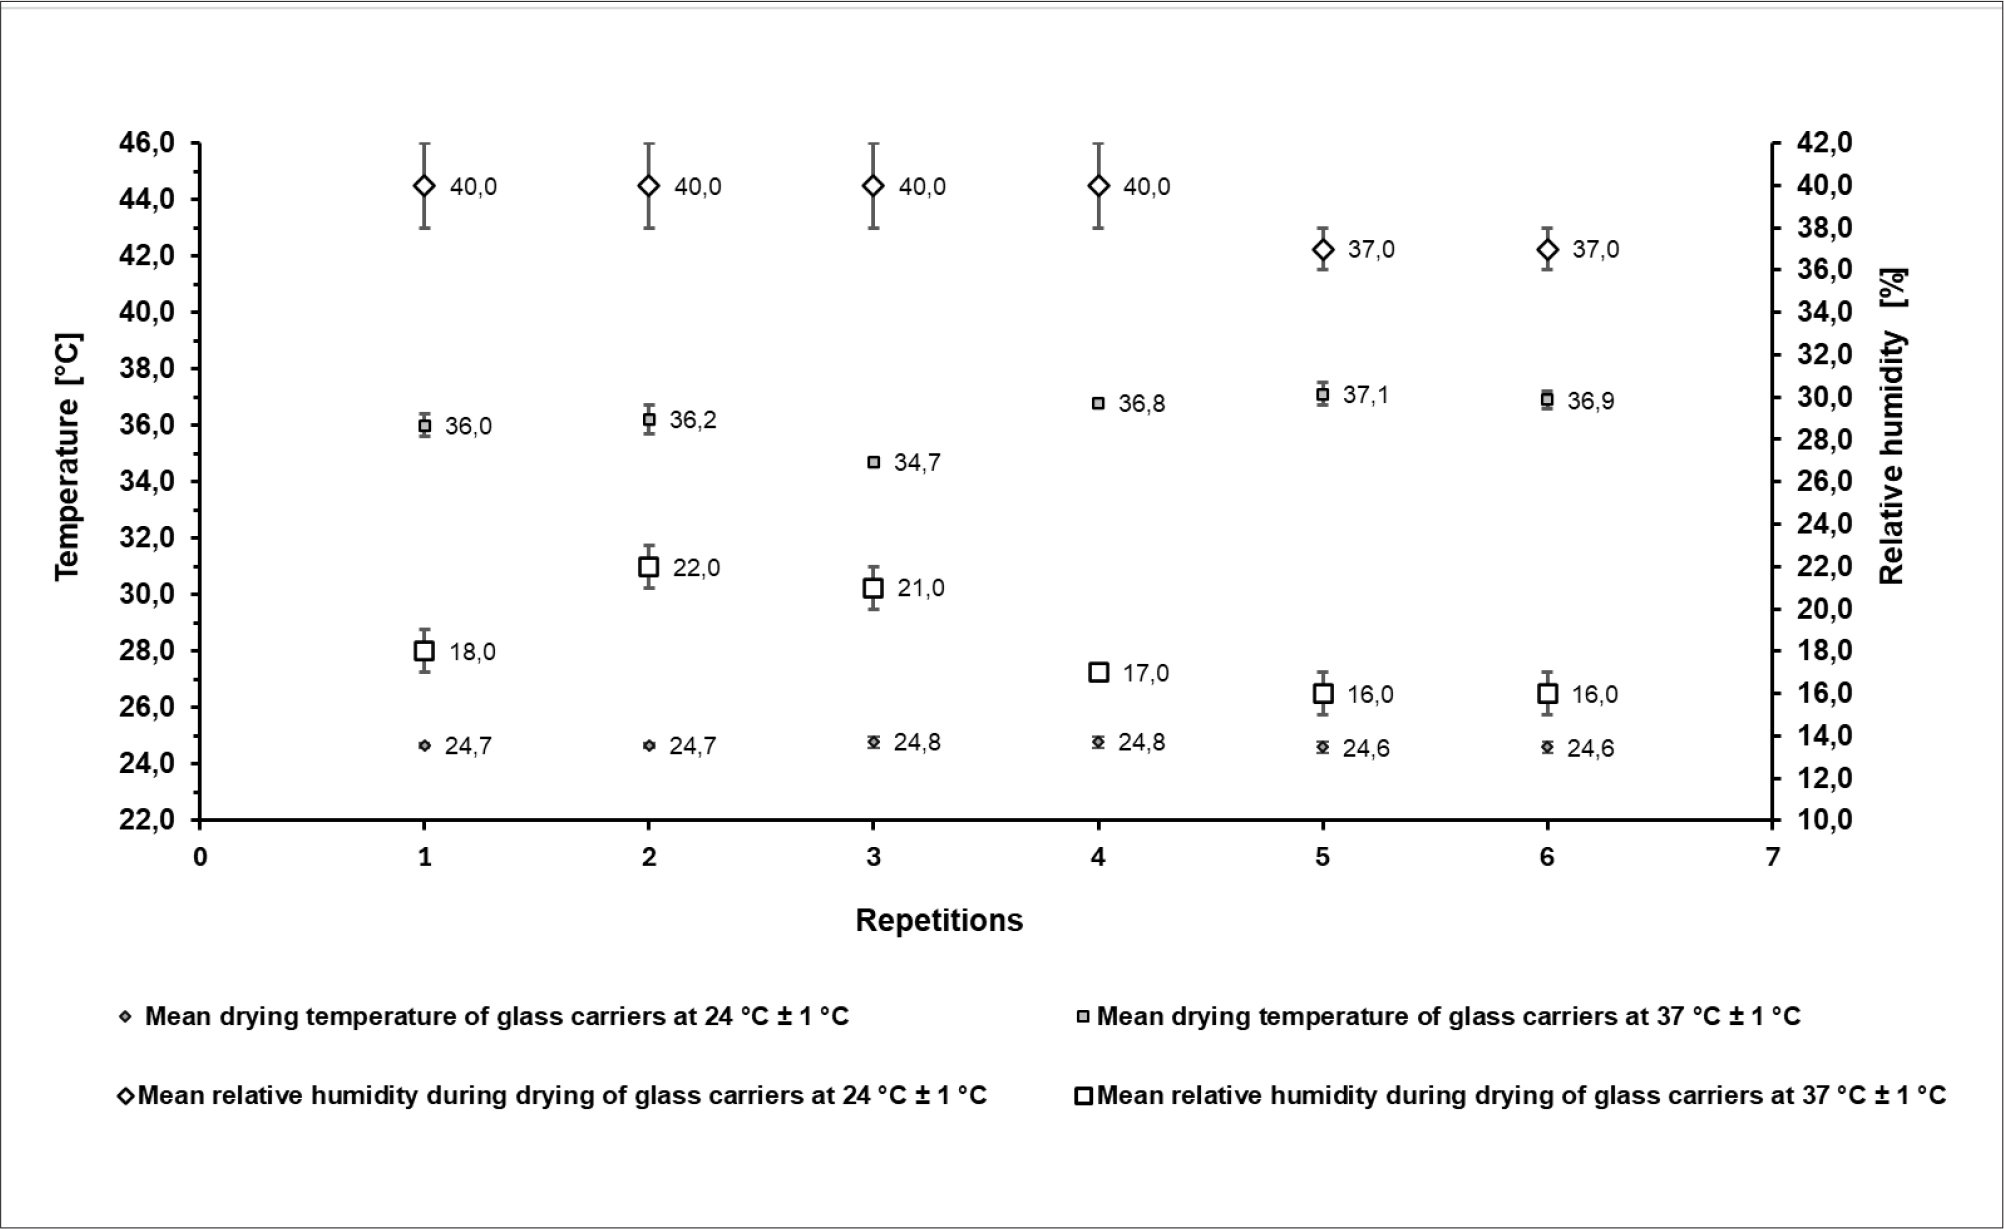
Fig. 1.
Mean changes in temperature and relative humidity (± standard deviation) during the drying of glass carriers contaminated with Pseudomonas aeruginosa, recorded across individual replicates under two temperature conditions: 24°C ± 1°C and 37°C ± 1°C.
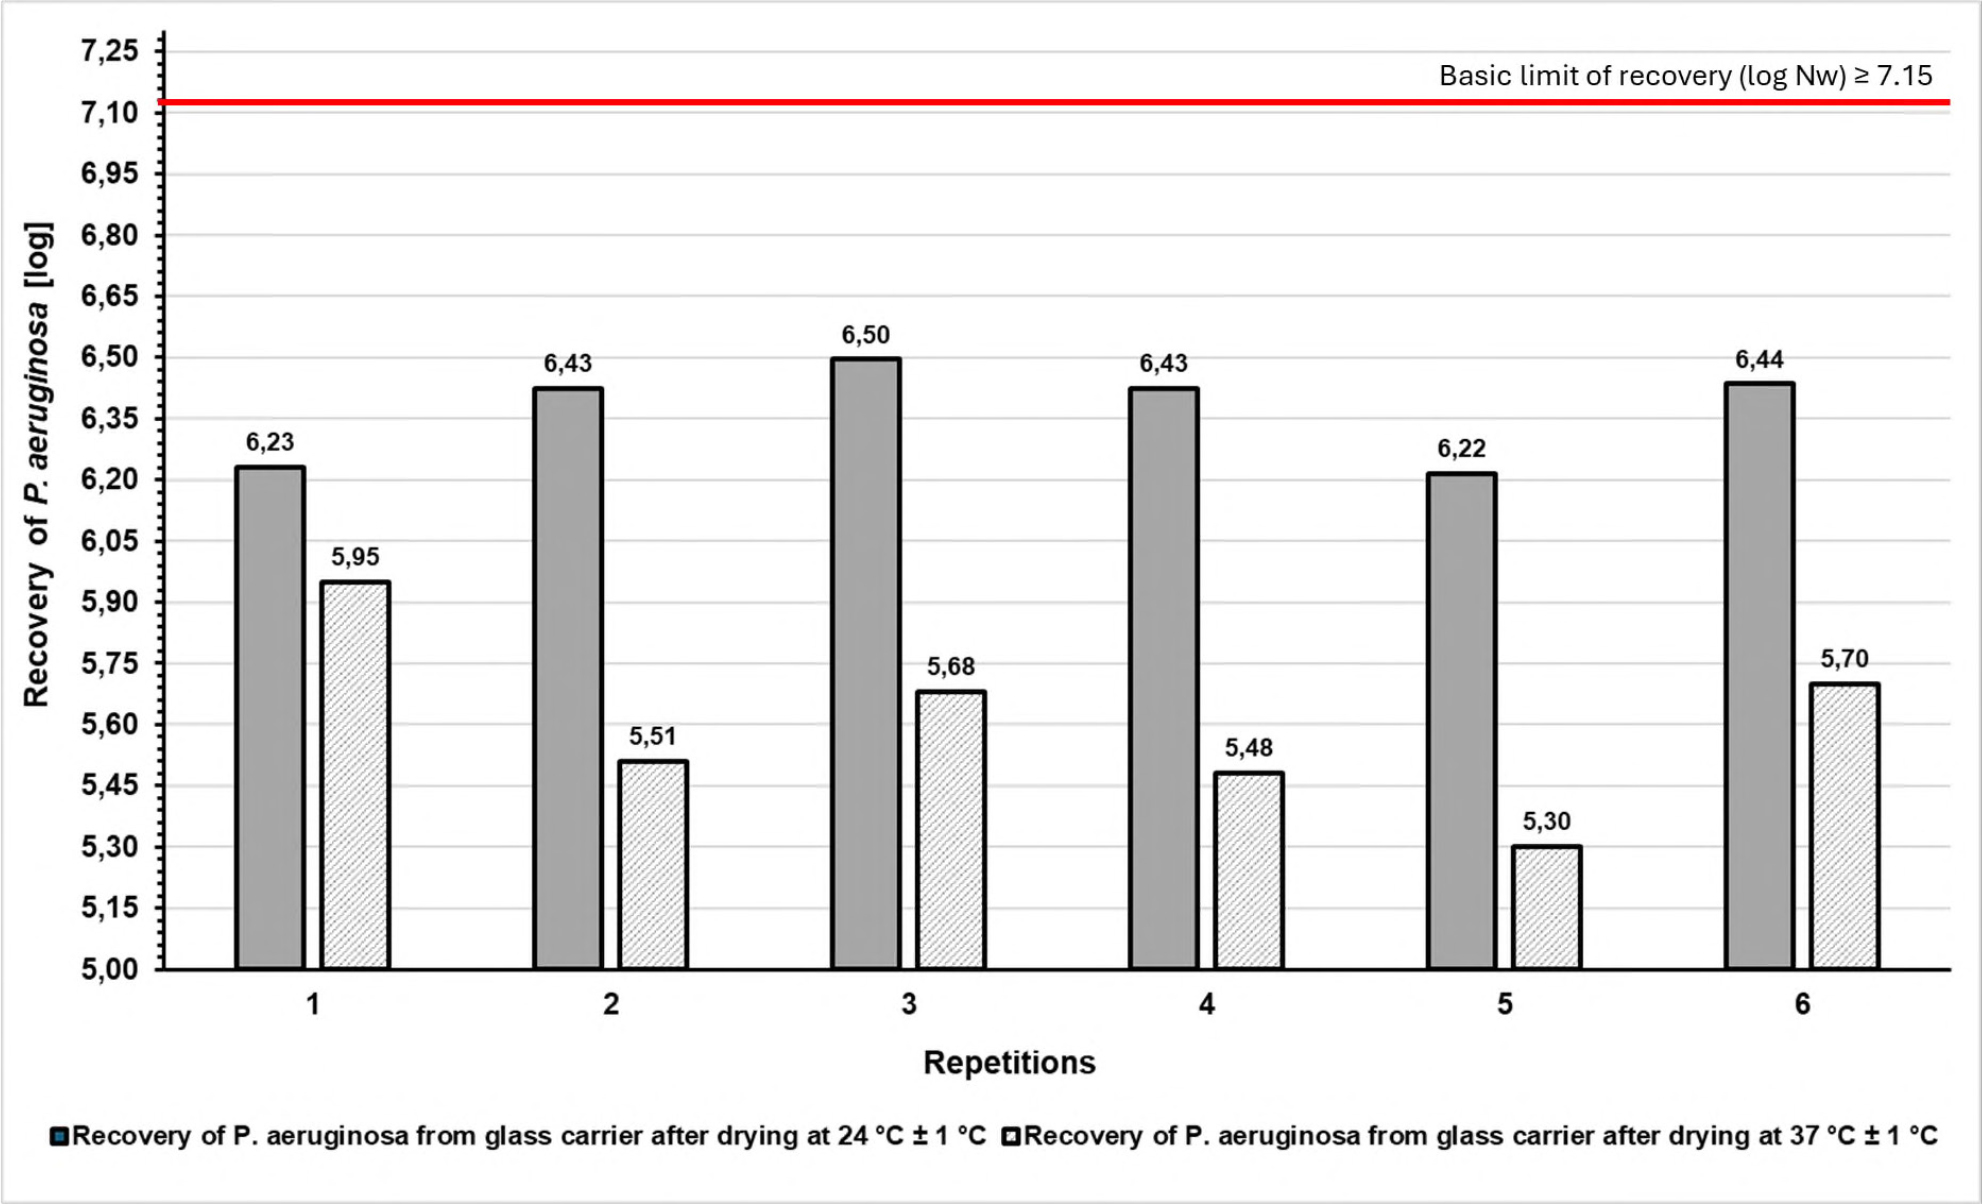
Fig. 2.
Recovery of Pseudomonas aeruginosa from glass carriers [log] after drying in individual replicates (n = 6) under two different temperatures: 24°C ± 1°C and 37°C ± 1°C (clean conditions).
Table I
Mean values (MN) and standard deviations (SD) of suspension density (N), recovery of Pseudomonas aeruginosa from glass carrier (Nw) and drying time (t) of contaminated glass carriers (n = 6) in two different temperatures: 24°C ± 1°C and 37°C ± 1°C.
| N [log] | Nw [log] | t [min] | |||||||||
|---|---|---|---|---|---|---|---|---|---|---|---|
| 24°C | 37°C | 24°C | 37°C | 24°C | 37°C | ||||||
| MN | SD | MN | SD | MN | SD | MN | SD | MN | SD | MN | SD |
| 9,63 | 0,09 | 9,62 | 0,05 | 6,37 | 0,12 | 5,60 | 0,22 | 122 | 9 | 59 | 10 |