
Fig. 1.
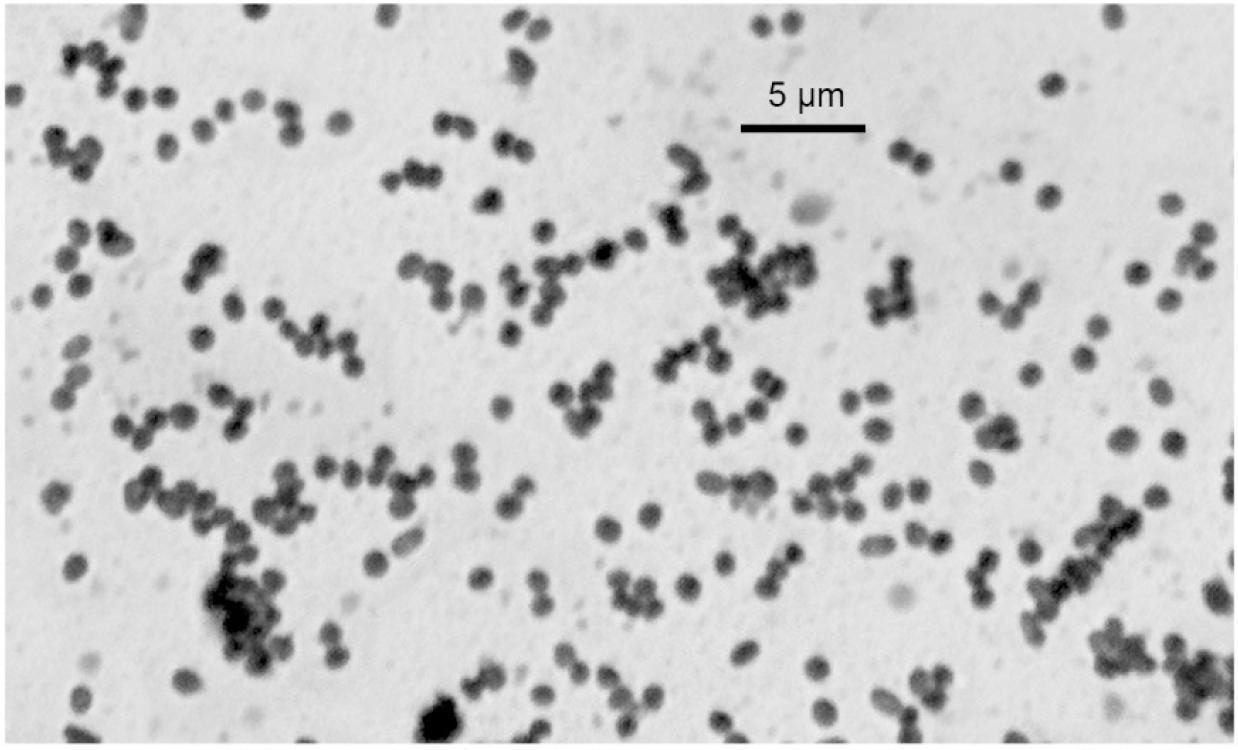
Fig. 2.
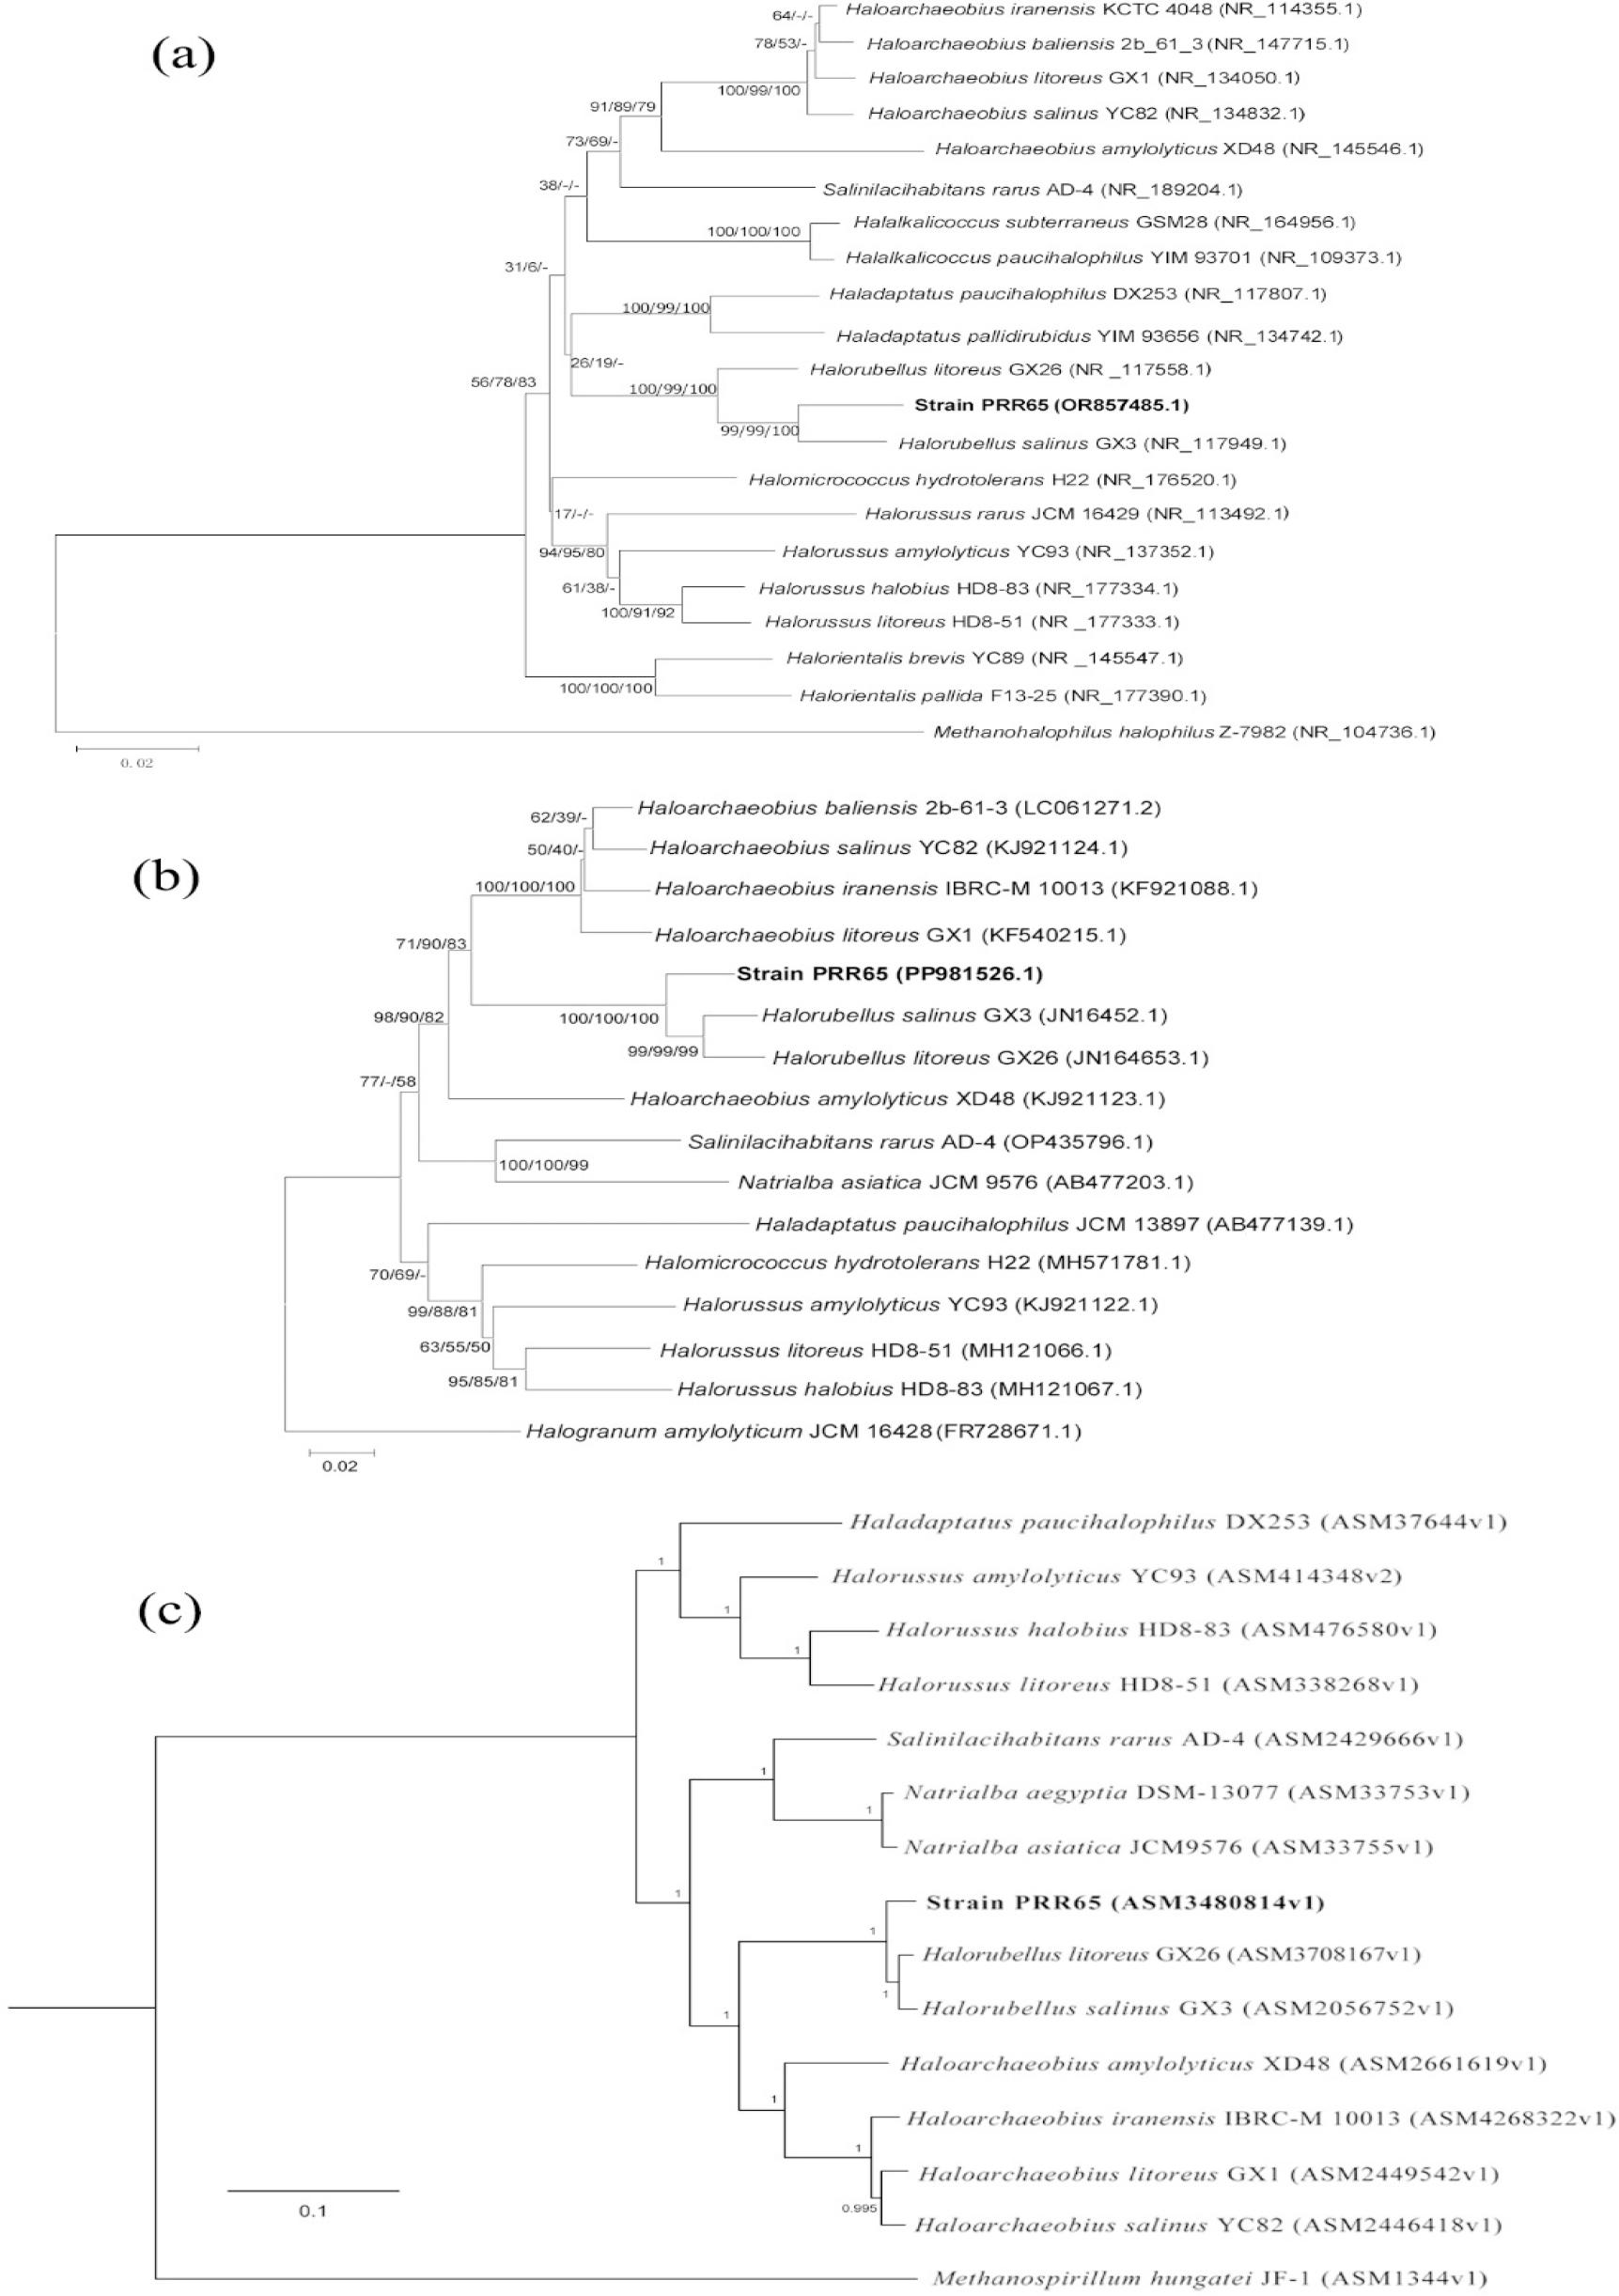
Fig. 3.
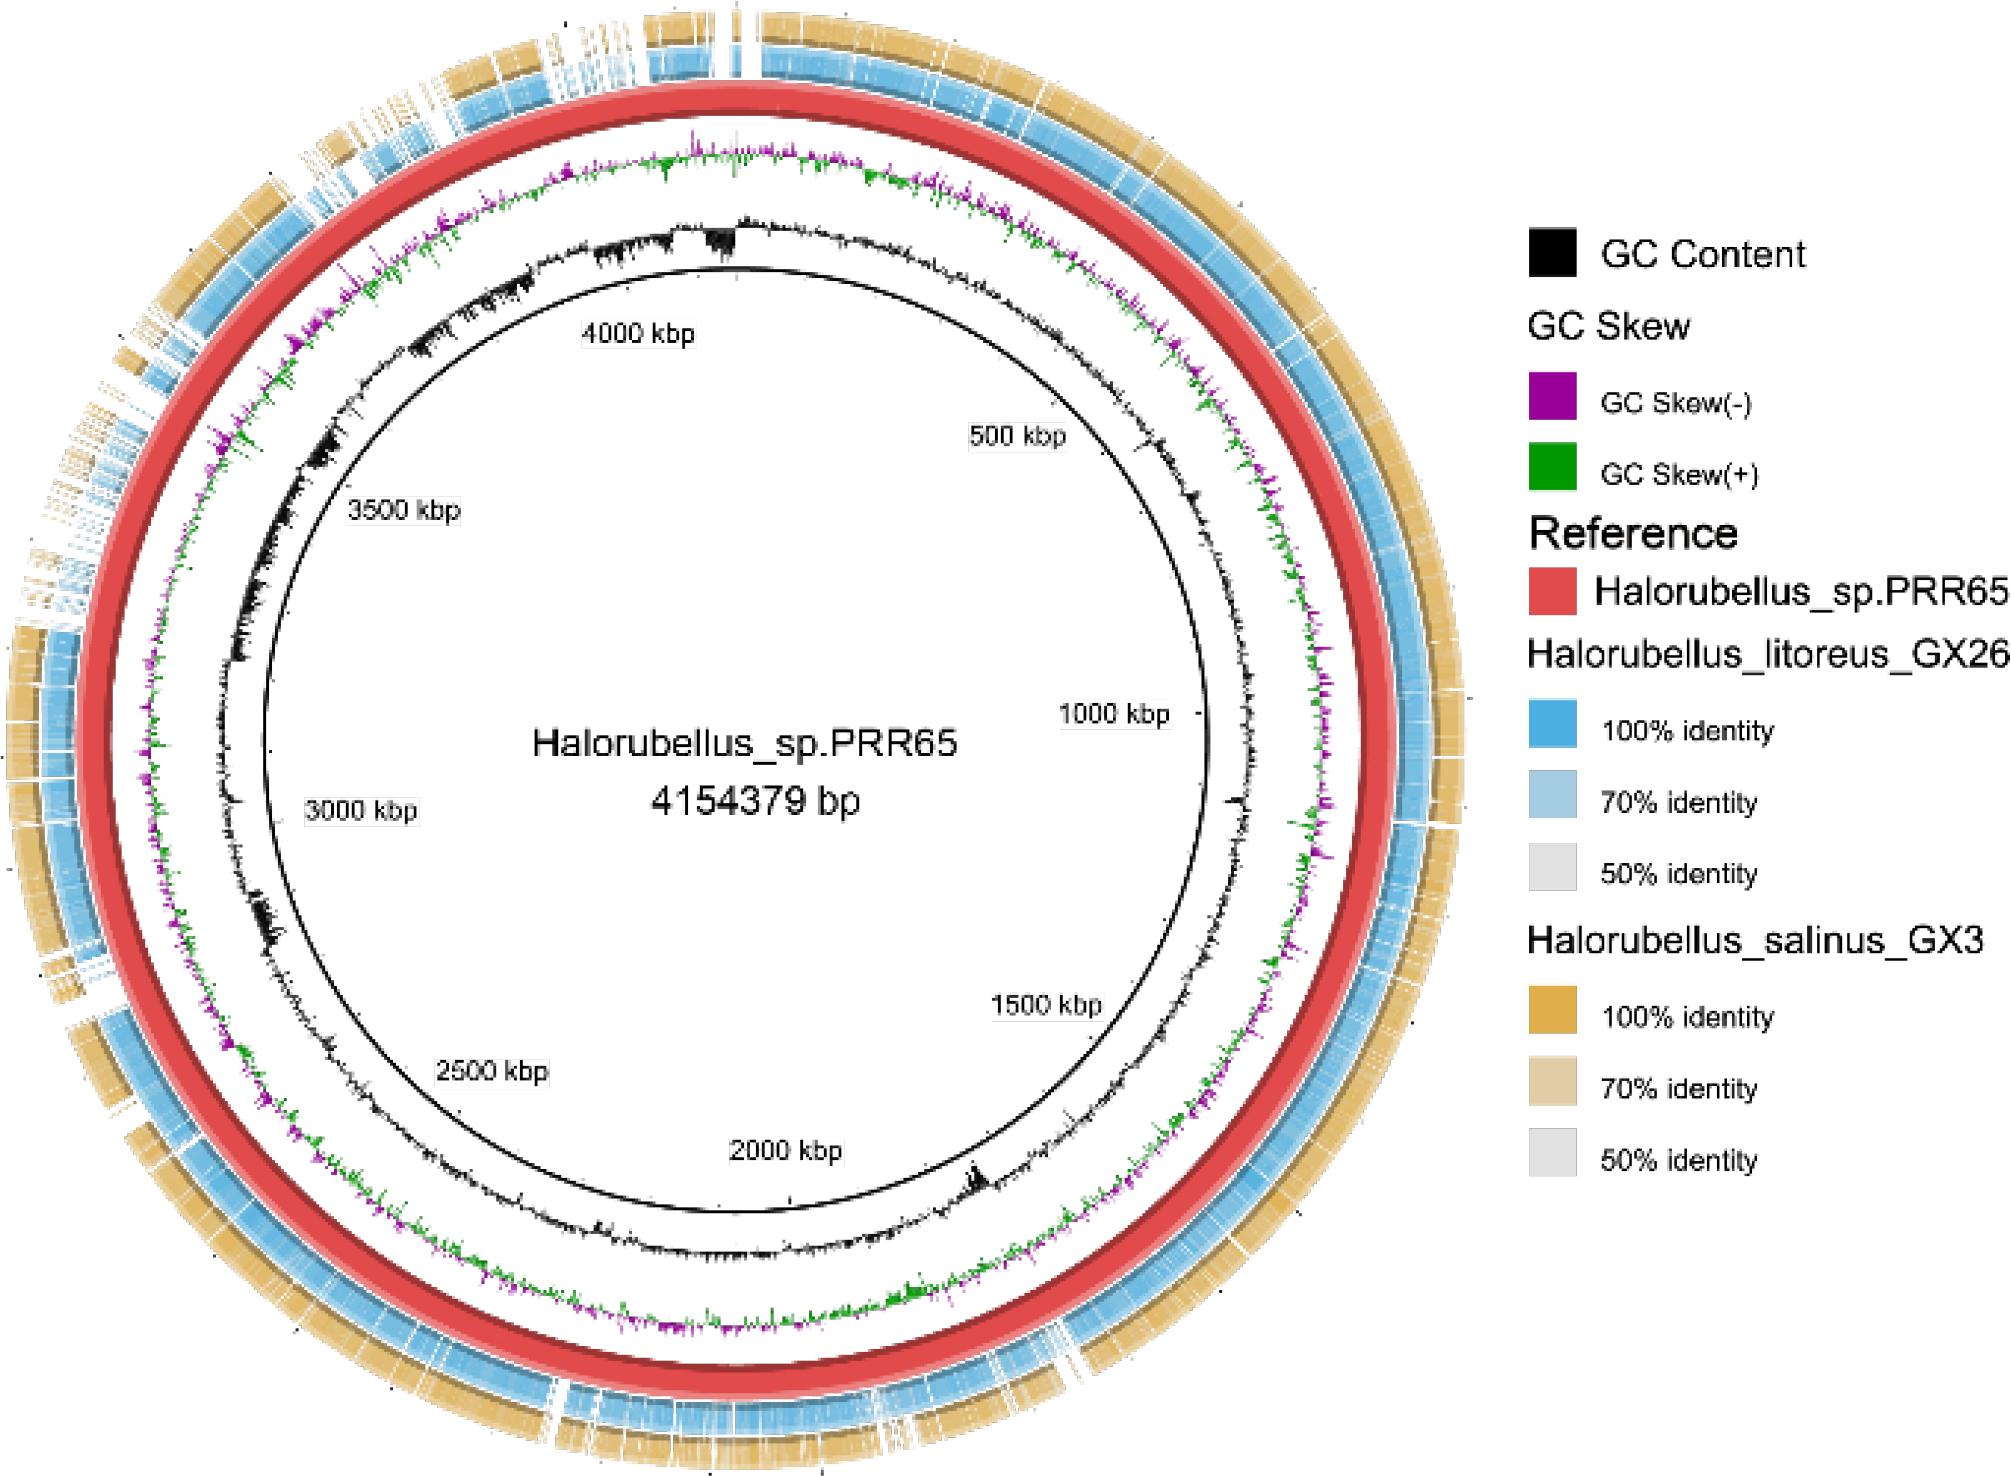
Fig. 4.
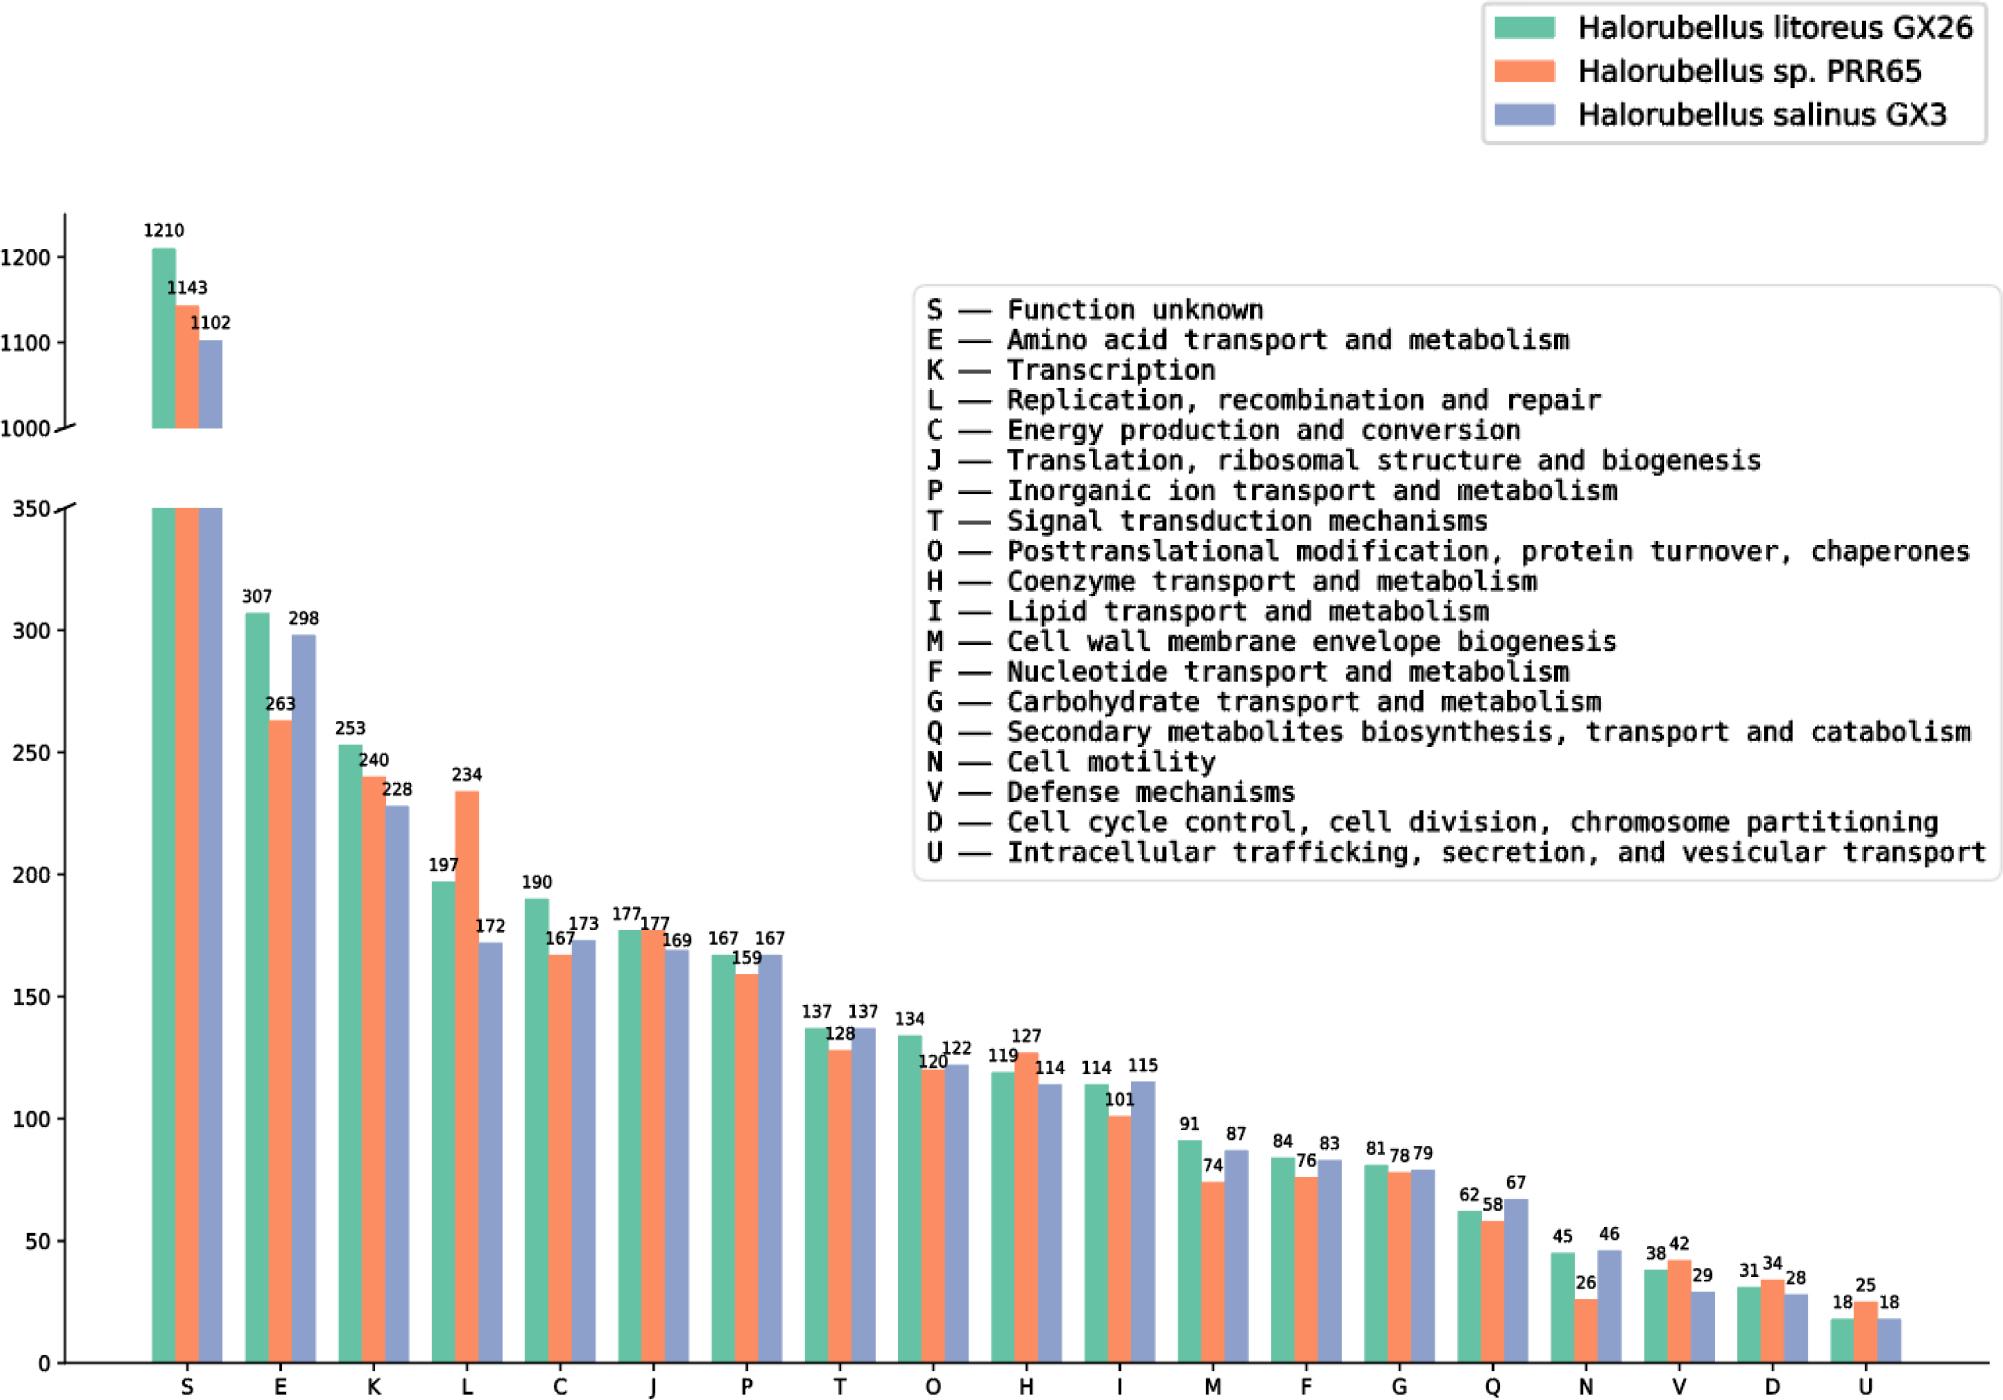
Fig. 5.
Differential characteristics of strain PRR65T and its closely related species within the genus Halorubellus_
| Characteristics | 1 | 2 | 3 |
|---|---|---|---|
| Shape | Cocci | Pleomorphic | Polymorphic |
| NaCl range (M) | 2.0–5.1 | 1.4–5.1 | 1.4–5.1 |
| Optimum NaCl (M) | 3.4 | 3.1 | 3.1 |
| Mg2+ requirement | + | – | – |
| Optimum Mg2+(M) | 0.01 | 0.05 | 0.05 |
| Anaerobic growth in: | |||
| l-arginine | + | - | - |
| KNO3 | + | - | - |
| Utilization of | |||
| d-glucose | + | - | - |
| d-mannose | + | - | - |
| d-galactose | + | - | + |
| Starch | + | - | + |
| Mannitol | + | - | - |
| Sorbitol | + | - | - |
| Lactate | - | - | + |
| Succinate | - | + | - |
| Malate | - | - | + |
| Citrate | - | - | + |
| l-alanine | + | - | + |
| l-lysine | - | + | - |
| Gelatin hydrolysis | - | + | + |
| H2S formation | - | + | + |
| Oxidase activity | - | + | + |
| G + C content (mol%) | 67.2 | 67.3 | 67.2 |
Average amino acid identity (AAI) between strain PRR65 and its closely related species_
| Strain | AAI (%) |
|---|---|
| Halorubellus salinus GX3 | 86.32 |
| Halorubellus litoreus GX26 | 86.47 |
| Halomicrococcus hydrotolerans H22 | 79.43 |
| Haloarchaeobius salinus YC82 | 79.21 |
| Haloarchaebius iranensis KCTC 4080 | 77.56 |
| Haloarchaebius amylolyticus XD48 | 76.13 |
Genome-based sequence similarity analysis between strain PRR65 and closely related species_
| dDDH (%)\ANI (%) | 1 | 2 | 3 | 4 | 5 | 6 | 7 |
|---|---|---|---|---|---|---|---|
| 1. PRR65 | 87.12 | 88.97 | 74.12 | 75.54 | 76.65 | 75.15 | |
| 2. GX3 | 32.7 | 89.52 | 74.03 | 75.55 | 75.24 | 75.17 | |
| 3. GX26 | 39.2 | 38.4 | 73.99 | 75.28 | 75.22 | 75.19 | |
| 4. H22 | 19.9 | 19.9 | 20 | 75.15 | 75.04 | 75.11 | |
| 5. YC82 | 16.2 | 20.9 | 21 | 20.4 | 88.12 | 78.72 | |
| 6. KCTC 4080 | 21.4 | 20.7 | 20.9 | 20.2 | 34.4 | 78.50 | |
| 7. XD48 | 20.7 | 20.5 | 20.7 | 20.3 | 22.2 | 21.9 |