
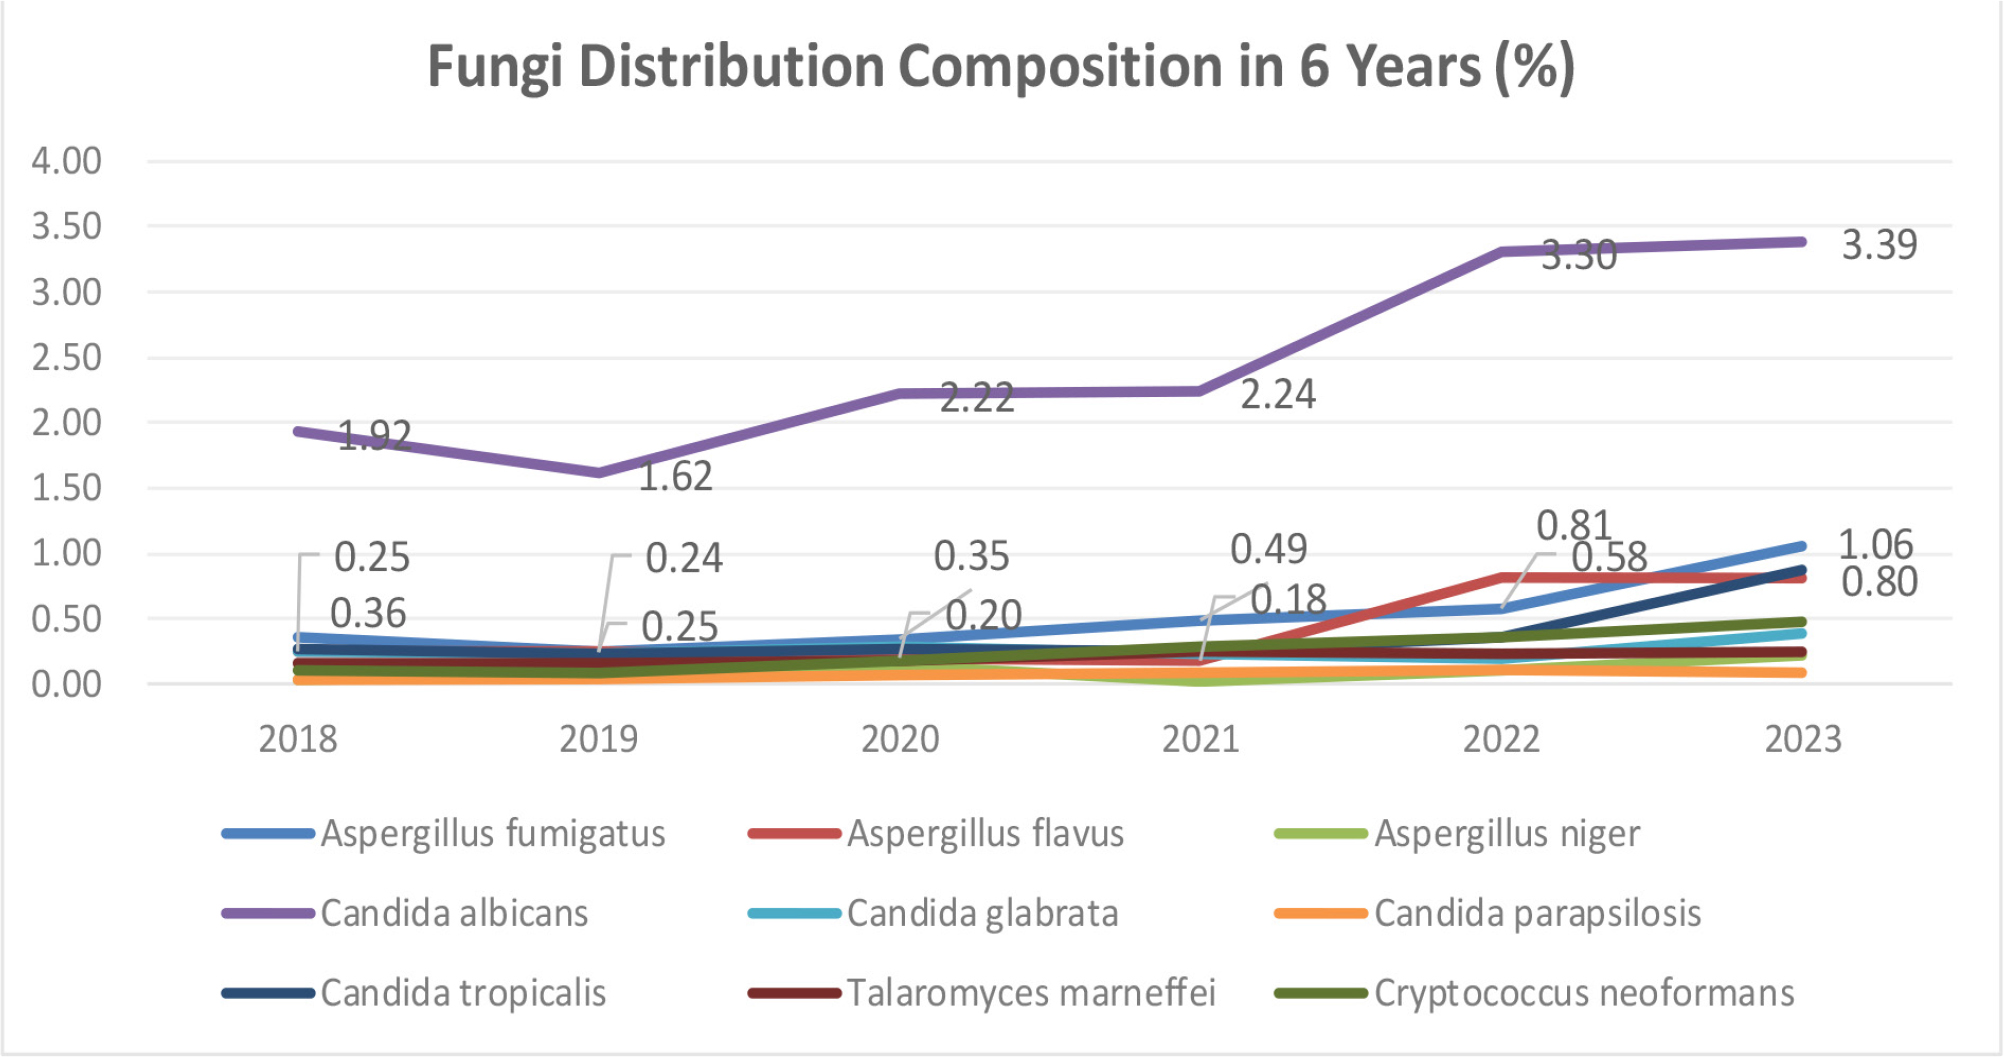
Fig. 1.
Distribution of fungal species among infectious disease patients.
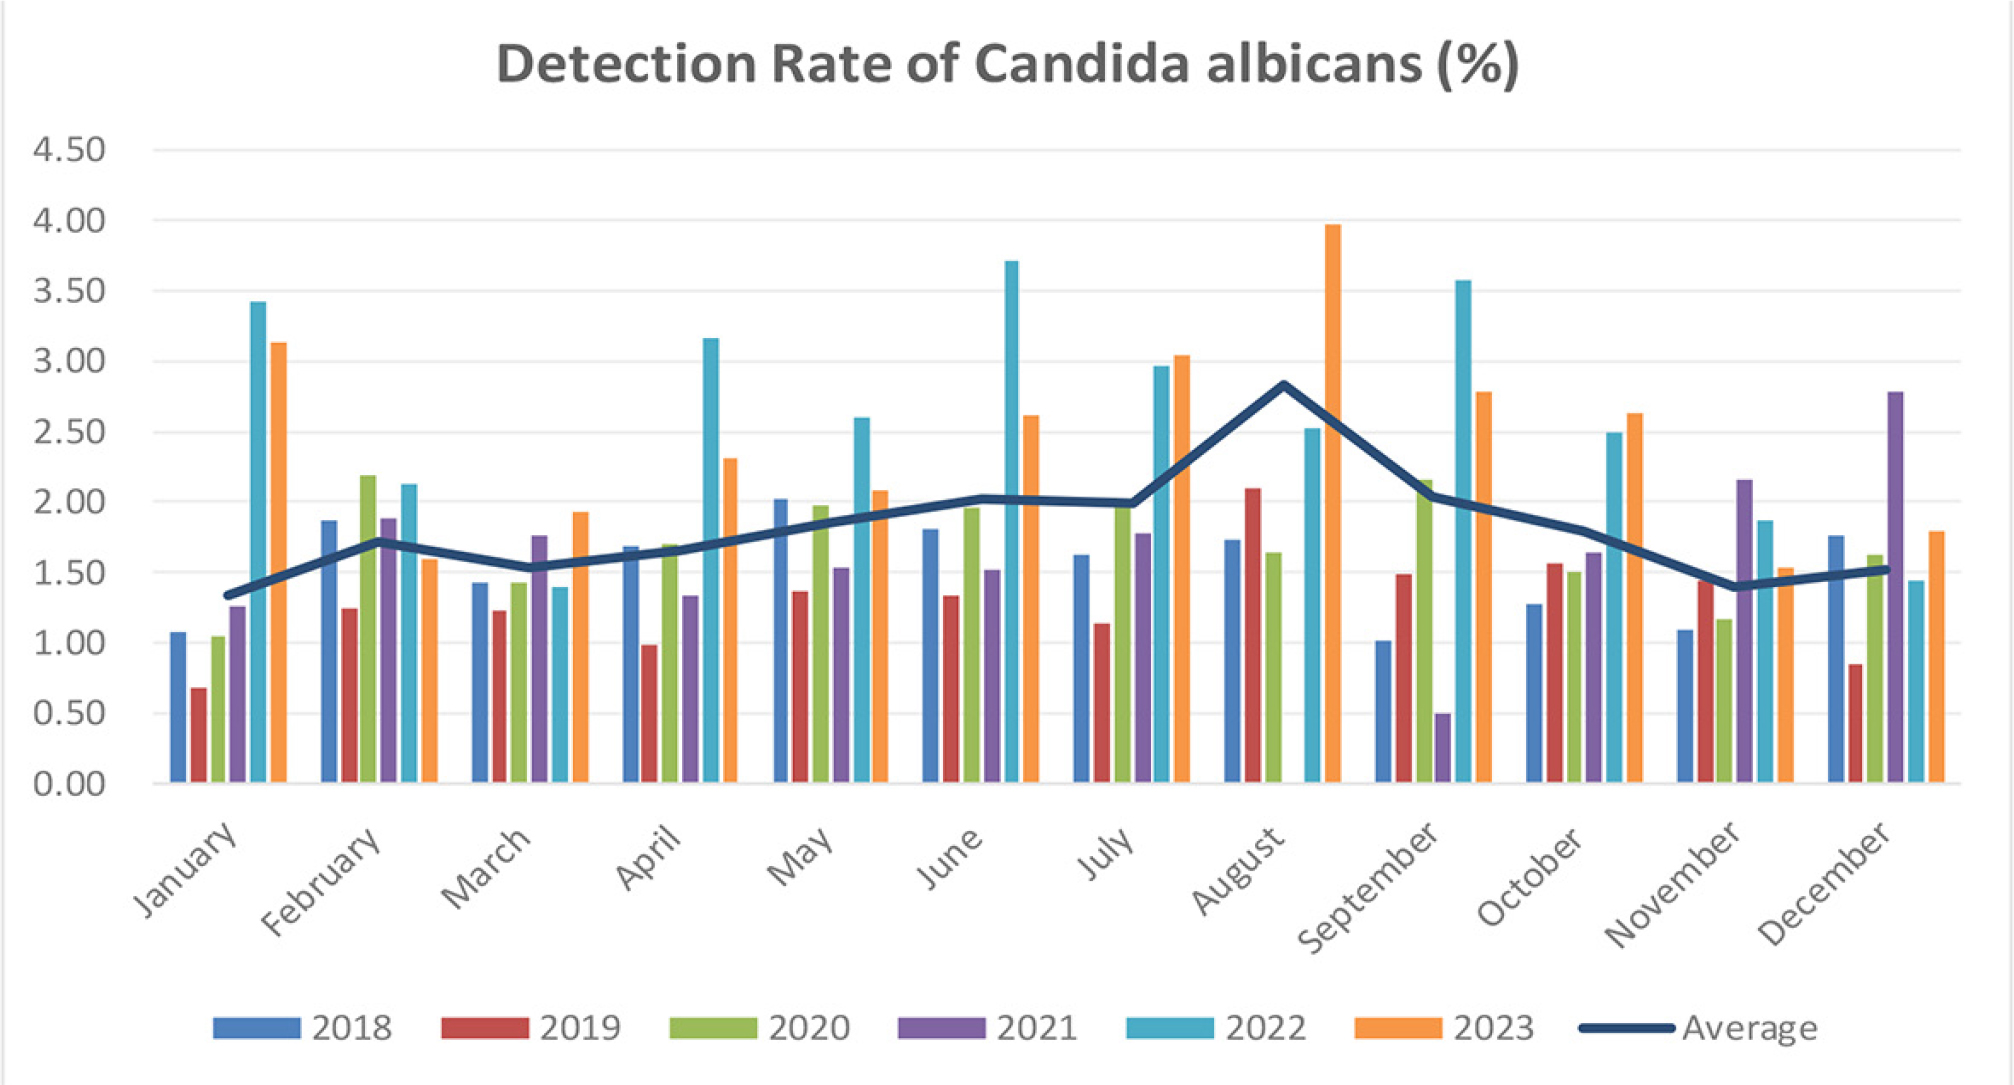
Fig. 2.
Distribution of Candida albicans among infectious disease patients in different months.
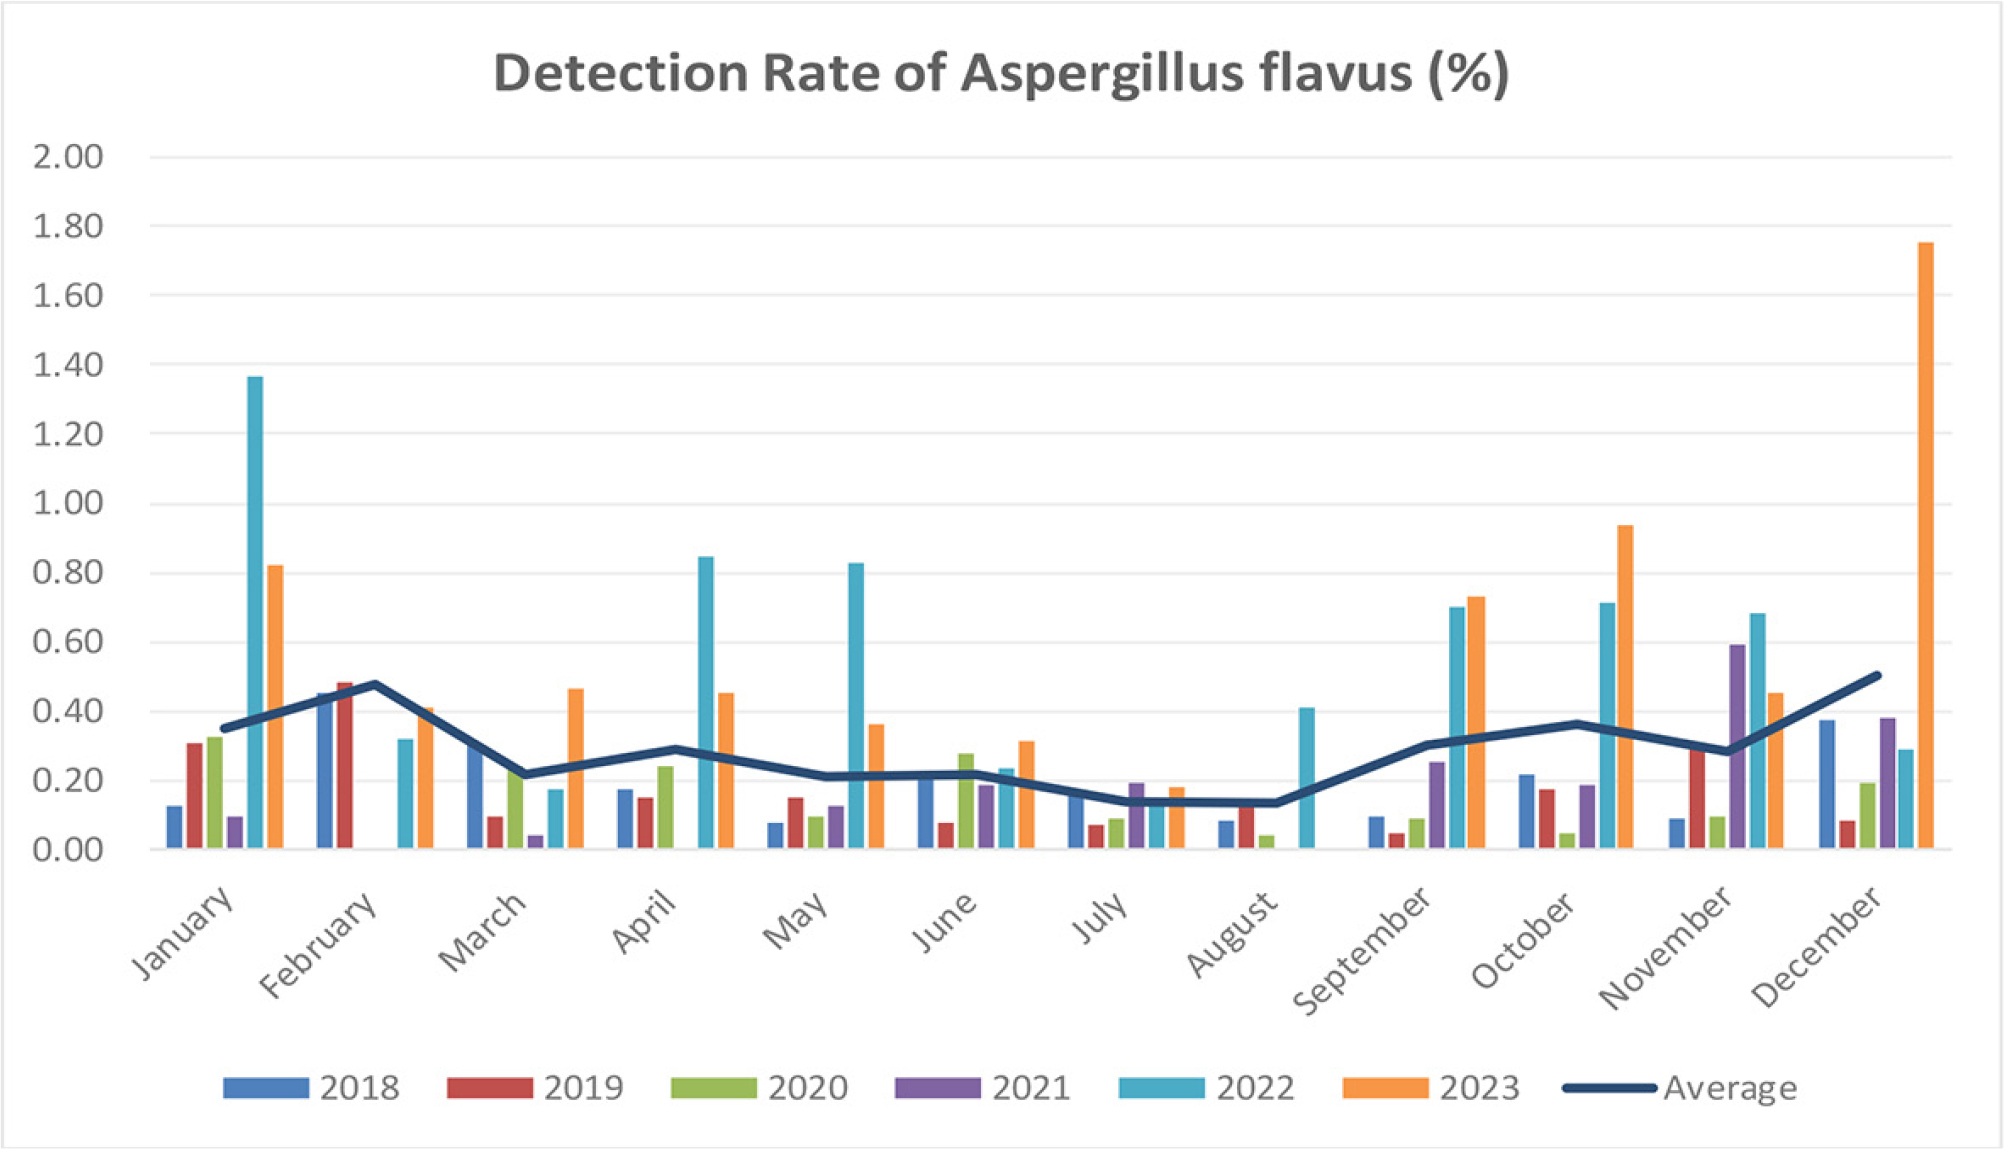
Fig. 3.
Distribution of Aspergillus flavus among infectious disease patients in different months.
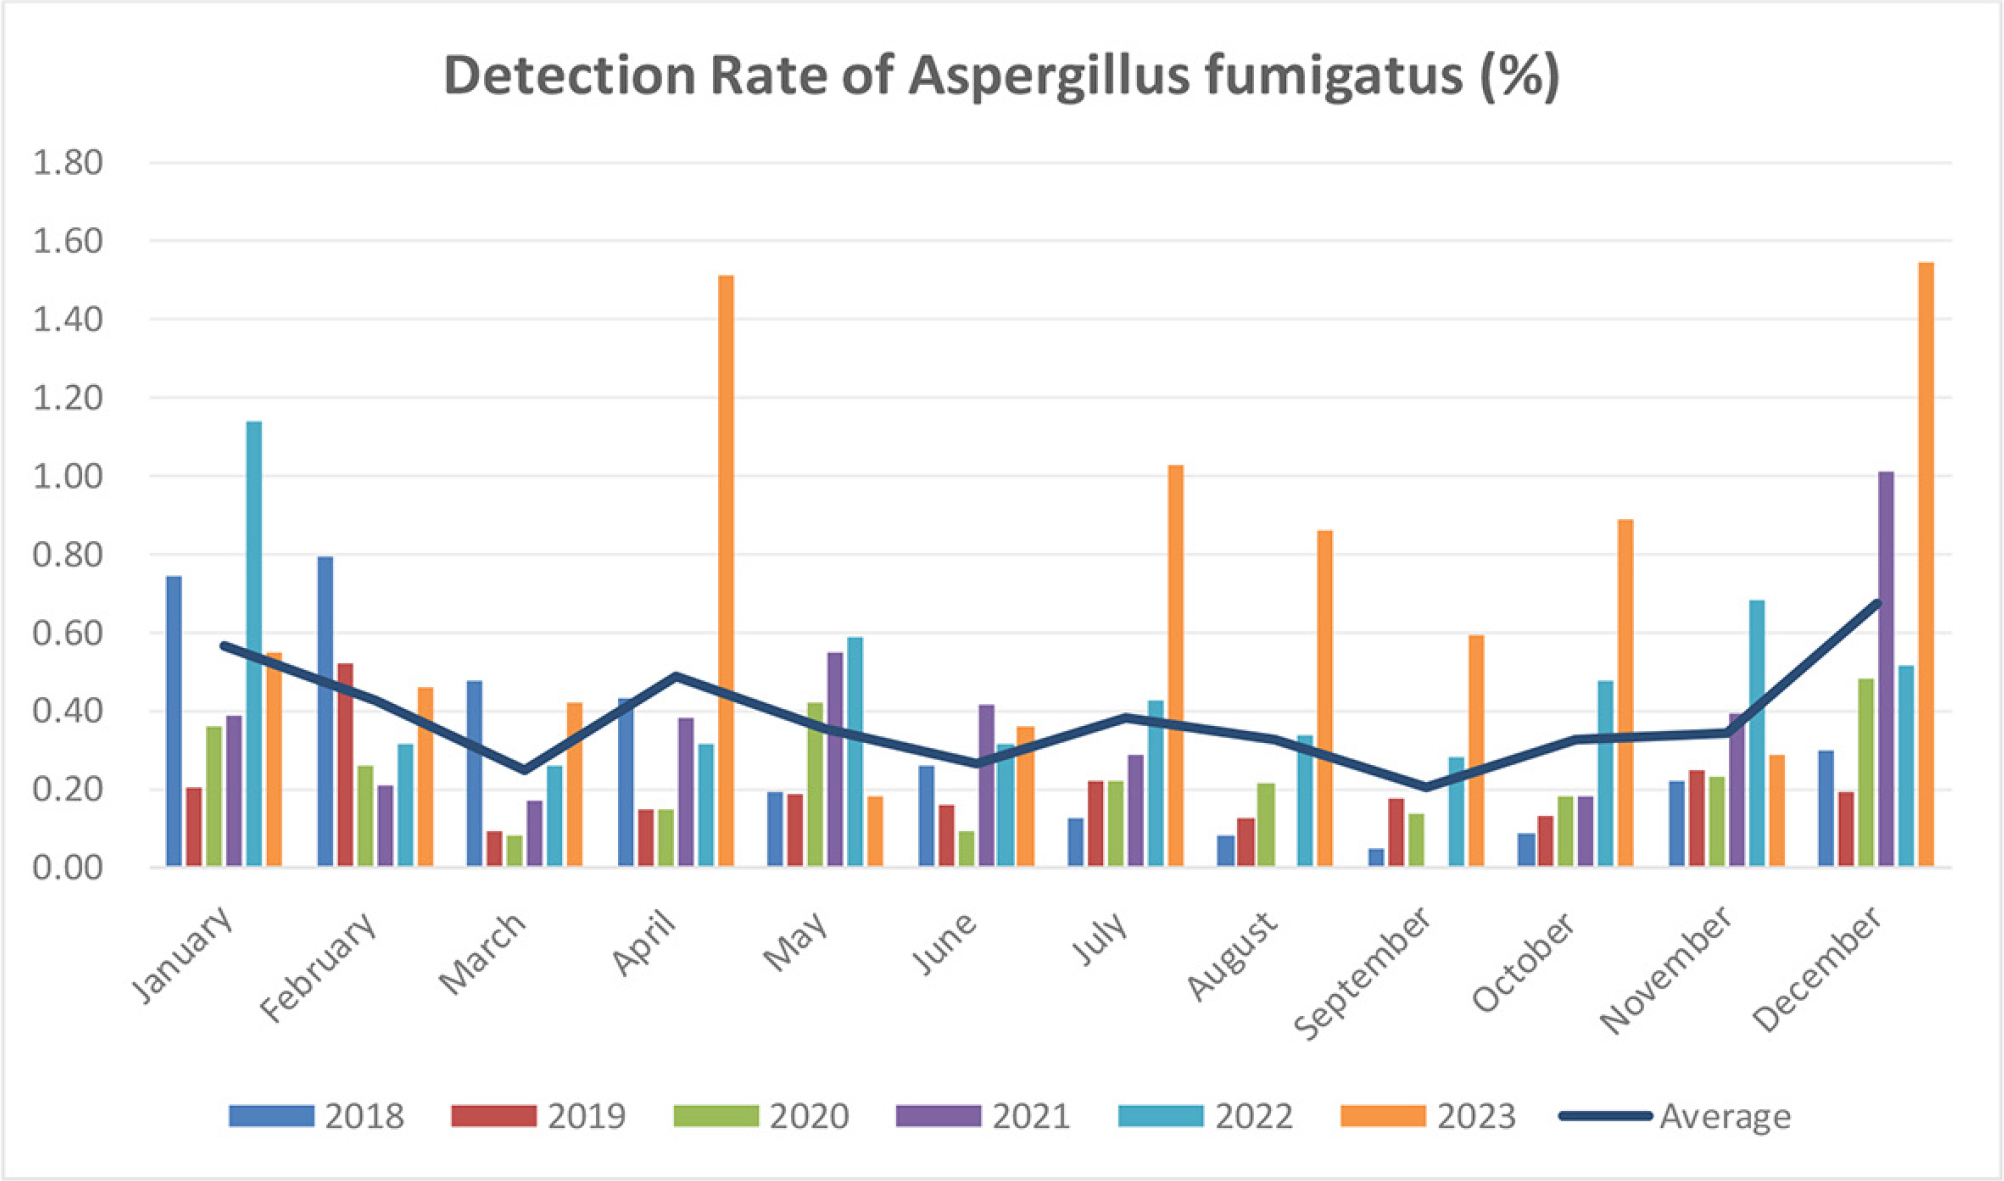
Fig.4.
Distribution of Aspergillus fumigatus among infectious disease patients in different months.
Table I
The main specimen sources and corresponding fungal isolates [n (%)].
| Fungal species | Sputum | Lavage fluid | Blood | Cerebrospinal fluid, pleural fluid, ascites, etc. (other sterile body fluids) | Swabs, urine, feces, etc. (other non-sterile specimens) | |||||
|---|---|---|---|---|---|---|---|---|---|---|
| n | (%) | n | (%) | n | (%) | n | (%) | n | (%) | |
| Aspergillus fumigatus | 299 | (63.48) | 159 | (33.76) | 0 | (0.00) | 0 | (0.00) | 13 | (2.76) |
| Aspergillus flavus | 244 | (55.96) | 188 | (43.12) | 0 | (0.00) | 0 | (0.00) | 4 | (0.92) |
| Aspergillus niger | 75 | (63.03) | 0 | (0.00) | 31 | (26.05) | 4 | (3.36) | 9 | (7.56) |
| Candida albicans | 798 | (33.13) | 66 | (2.74) | 159 | (6.60) | 50 | (2.08) | 1,336 | (55.46) |
| Candida glabrata | 103 | (33.88) | 16 | (5.26) | 18 | (5.92) | 23 | (7.57) | 144 | (47.37) |
| Candida parapsilosis | 10 | (13.16) | 6 | (7.89) | 7 | (9.21) | 4 | (5.26) | 49 | (64.47) |
| Candida tropicalis | 37 | (64.91) | 0 | (0.00) | 0 | (0.00) | 0 | (0.00) | 20 | (35.09) |
| Talaromyces marneffei | 22 | (8.89) | 11 | (5.45) | 133 | (65.84) | 21 | (12.40) | 15 | (7.43) |
| Cryptococcus neoformans | 2 | (0.81) | 4 | (1.61) | 85 | (34.27) | 157 | (63.31) | 0 | (0.00) |
Table II
Fungal detection rates in hospitalized patients in different departments [n (%)].
| Species | AIDS Department (N = 9,113) | Tuberculosis Department (N = 22,494) | Hepatology Department (N = 9,068) | ICU (N = 2,963) | Other Departments (N = 31,364) | |||||
|---|---|---|---|---|---|---|---|---|---|---|
| n | (%) | n | (%) | n | (%) | n | (%) | n | (%) | |
| Aspergillus fumigatus | 154 | (1.69) | 159 | (0.71) | 13 | (0.15) | 65 | (2.18) | 50 | (0.16) |
| Aspergillus flavus | 100 | (1.10) | 162 | (0.72) | 10 | (0.11) | 69 | (2.33) | 33 | (0.10) |
| Aspergillus niger | 30 | (0.33) | 49 | (0.22) | 6 | (0.06) | 14 | (0.46) | 4 | (0.01) |
| Candida albicans | 1,286 | (14.11) | 462 | (2.05) | 21 | (0.23) | 282 | (9.53) | 288 | (0.92) |
| Candida glabrata | 93 | (1.02) | 94 | (0.42) | 1 | (0.01) | 52 | (1.75) | 50 | (0.16) |
| Candida parapsilosis | 18 | (0.19) | 16 | (0.07) | 2 | (0.02) | 16 | (0.52) | 18 | (0.06) |
| Candida tropicalis | 126 | (1.38) | 111 | (0.49) | 8 | (0.09) | 81 | (2.75) | 57 | (0.18) |
| Talaromyces marneffei | 141 | (1.54) | 5 | (0.02) | 3 | (0.03) | 33 | (1.10) | 12 | (0.04) |
| Cryptococcus neoformans | 166 | (1.82) | 19 | (0.08) | 0 | (0.00) | 41 | (1.40) | 2 | (0.01) |
| Fungal positivity | 1,755 | (19.26) | 992 | (4.41) | 64 | (0.71) | 564 | (19.04) | 445 | (1.42) |
Table III
Fungal detection rates in rural and urban patients [n (%)].
| Species | Rural (N = 28,359) | Urban (N = 46,642) | χ2 | p | ||
|---|---|---|---|---|---|---|
| n | (%) | n | (%) | |||
| Aspergillus fumigatus | 231 | (0.82) | 210 | (0.45) | 1.23 | 0.27 |
| Aspergillus flavus | 208 | (0.73) | 166 | (0.36) | 8.93 | < 0.01 |
| Aspergillus niger | 52 | (0.18) | 52 | (0.11) | 0.00 | 1.00 |
| Candida albicans | 1,264 | (4.46) | 1,075 | (2.31) | 234.12 | < 0.01 |
| Candida glabrata | 147 | (0.52) | 143 | (0.31) | 0.11 | 0.74 |
| Candida parapsilosis | 31 | (0.11) | 39 | (0.08) | 1.24 | 0.27 |
| Candida tropicalis | 180 | (0.63) | 203 | (0.44) | 2.06 | 0.15 |
| Talaromyces marneffei | 123 | (0.43) | 71 | (0.15) | 13.97 | < 0.01 |
| Cryptococcus neoformans | 132 | (0.47) | 96 | (0.21) | 5.99 | 0.01 |
| Fungal positivity | 1,927 | (6.80) | 1,623 | (3.48) | 429.89 | < 0.001 |
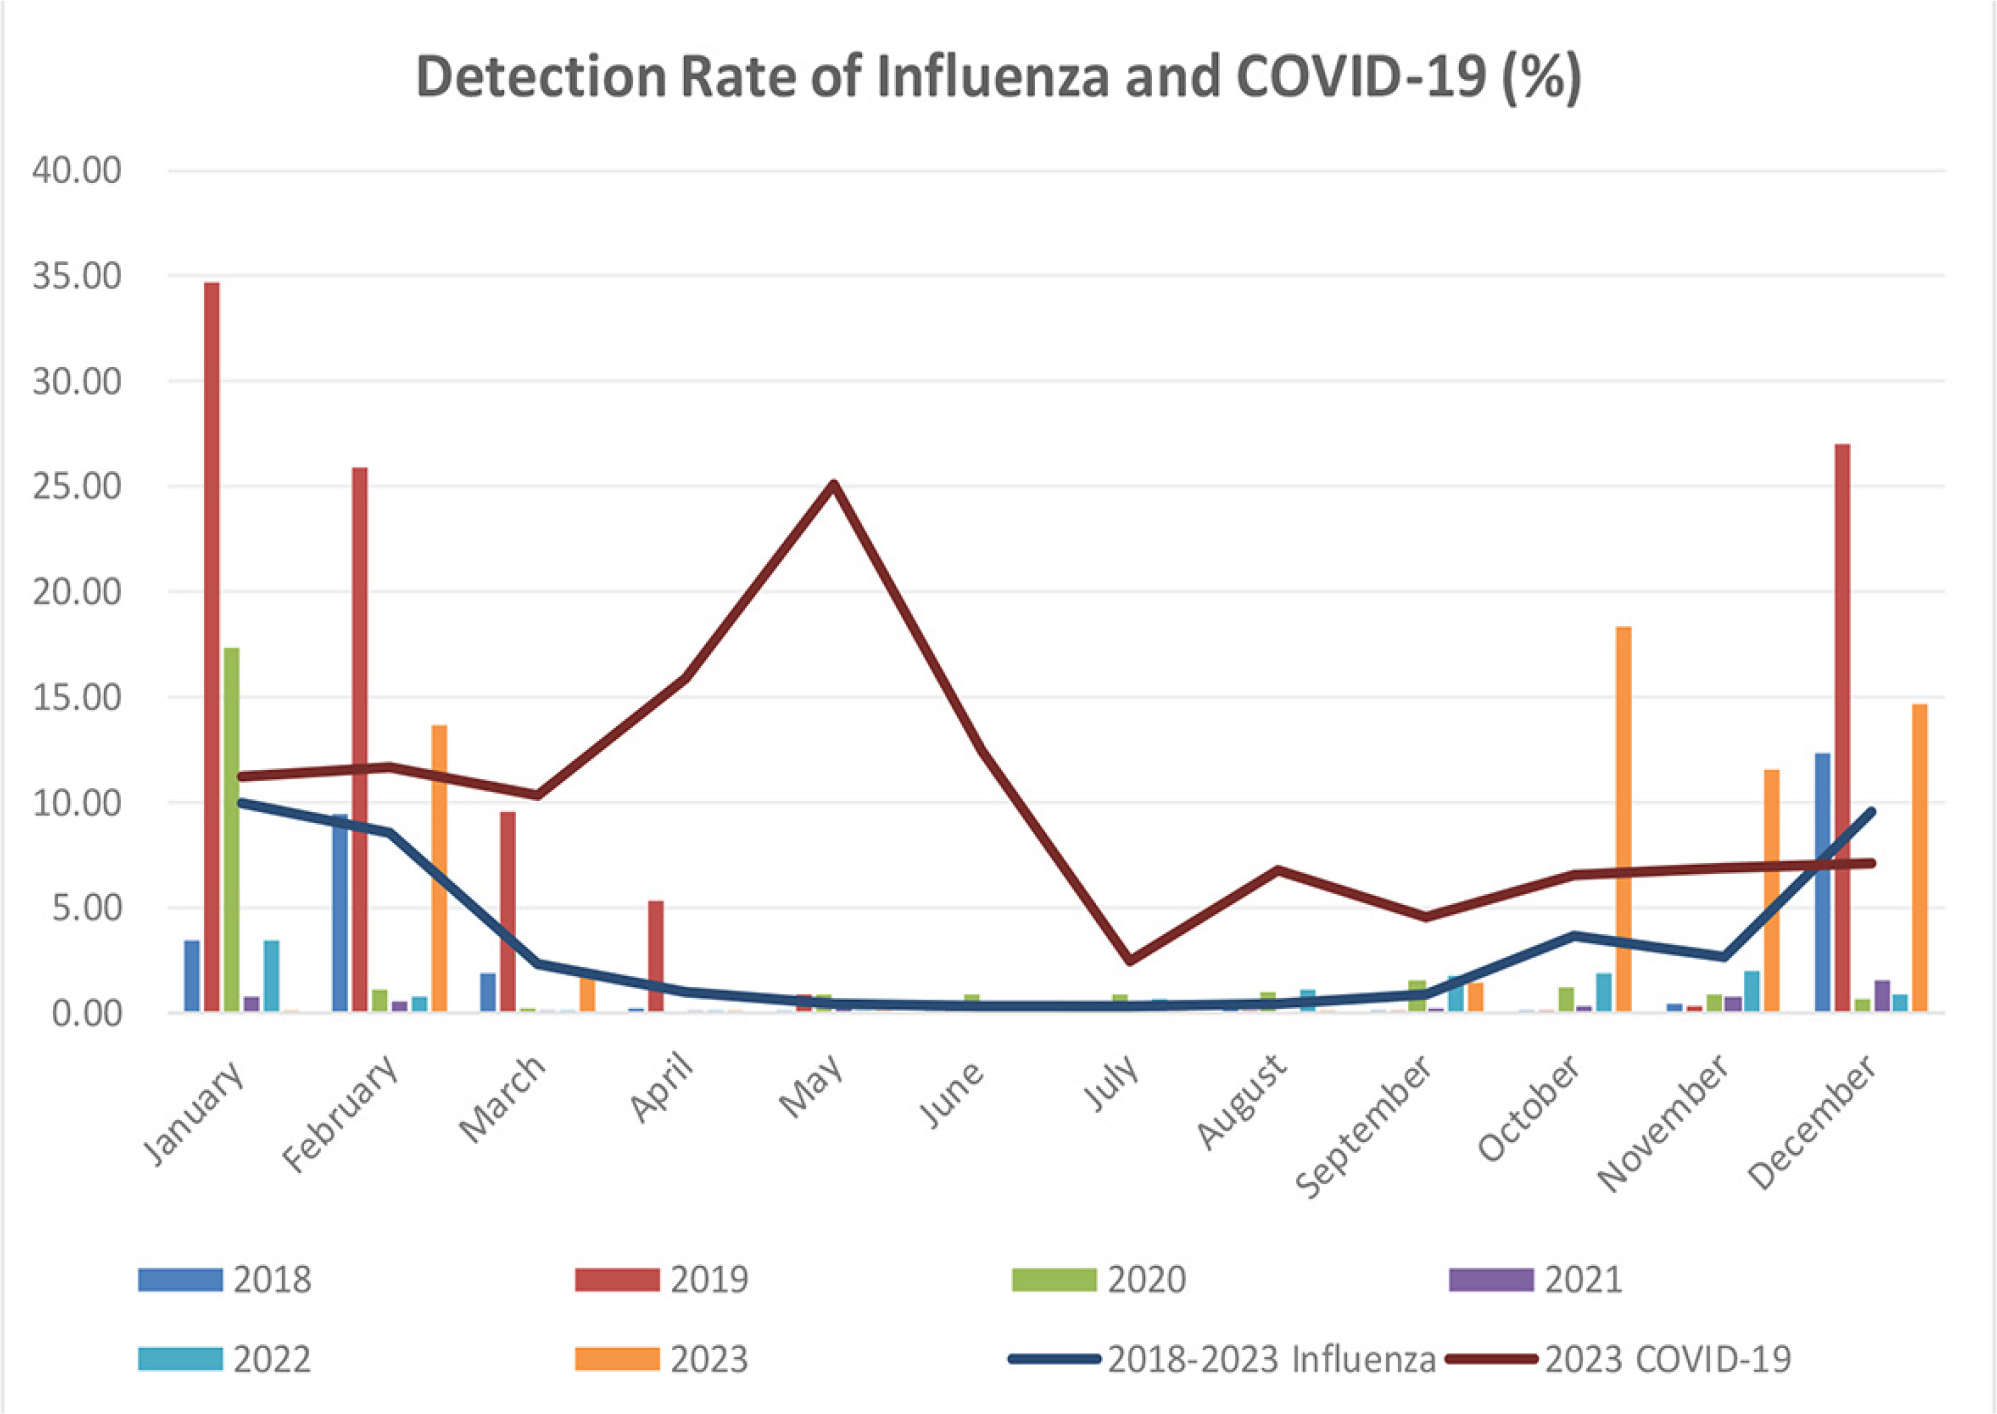
Fig. 5.
Detection rates of influenza and COVID-19 in throat swab samples (tested by PCR).