Fig. 1.
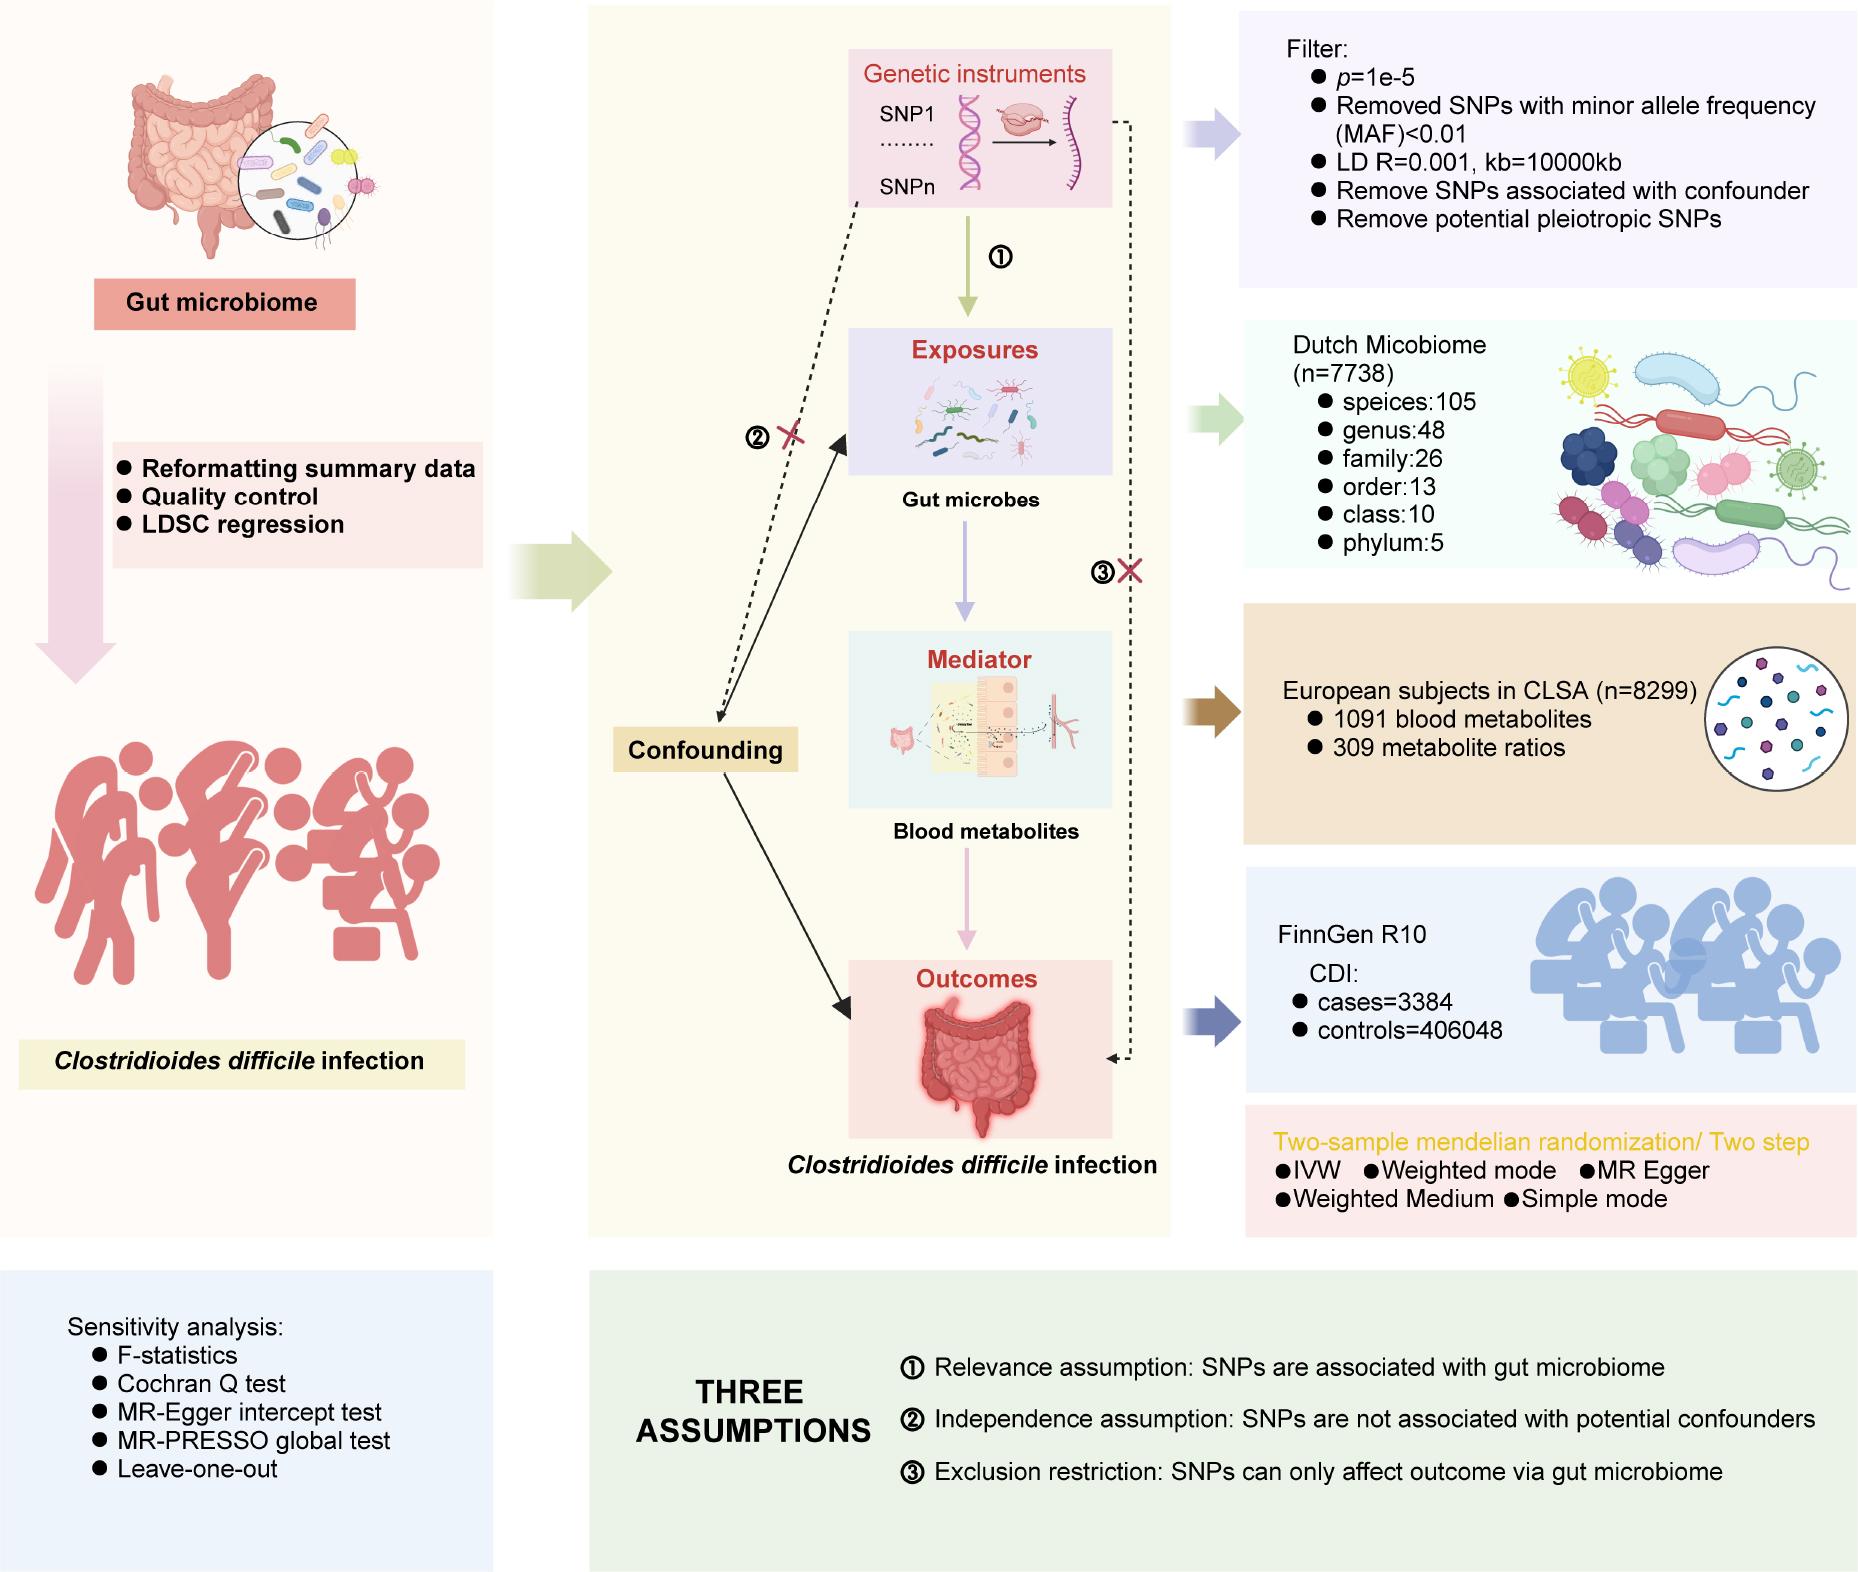
Fig. 2.
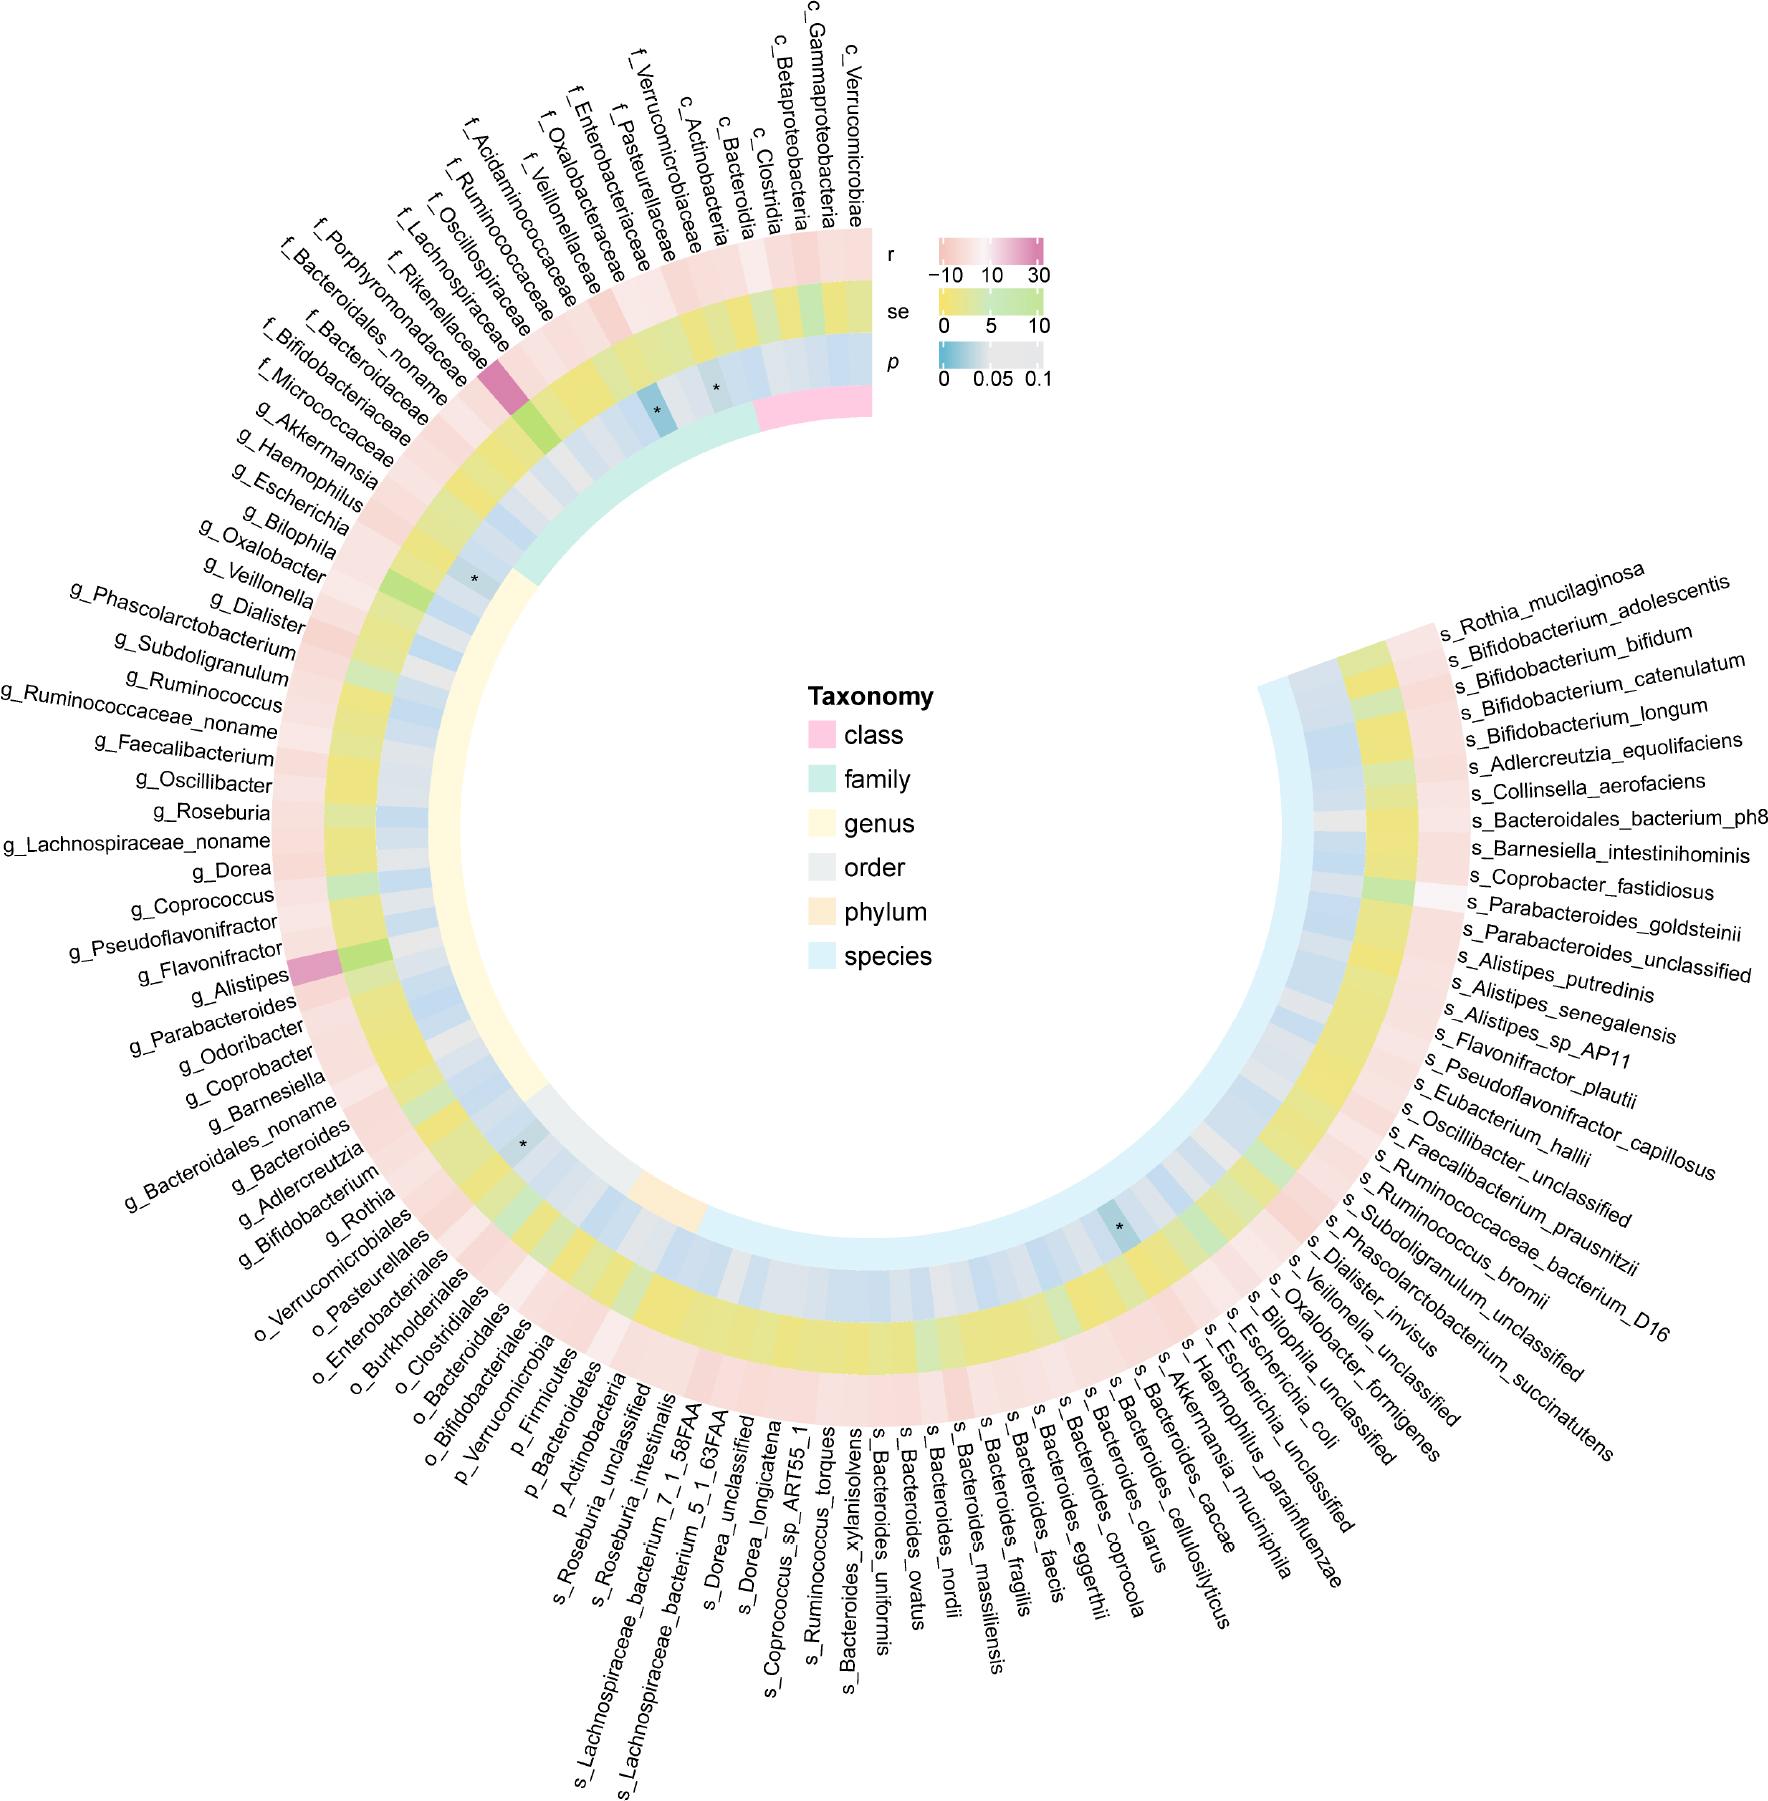
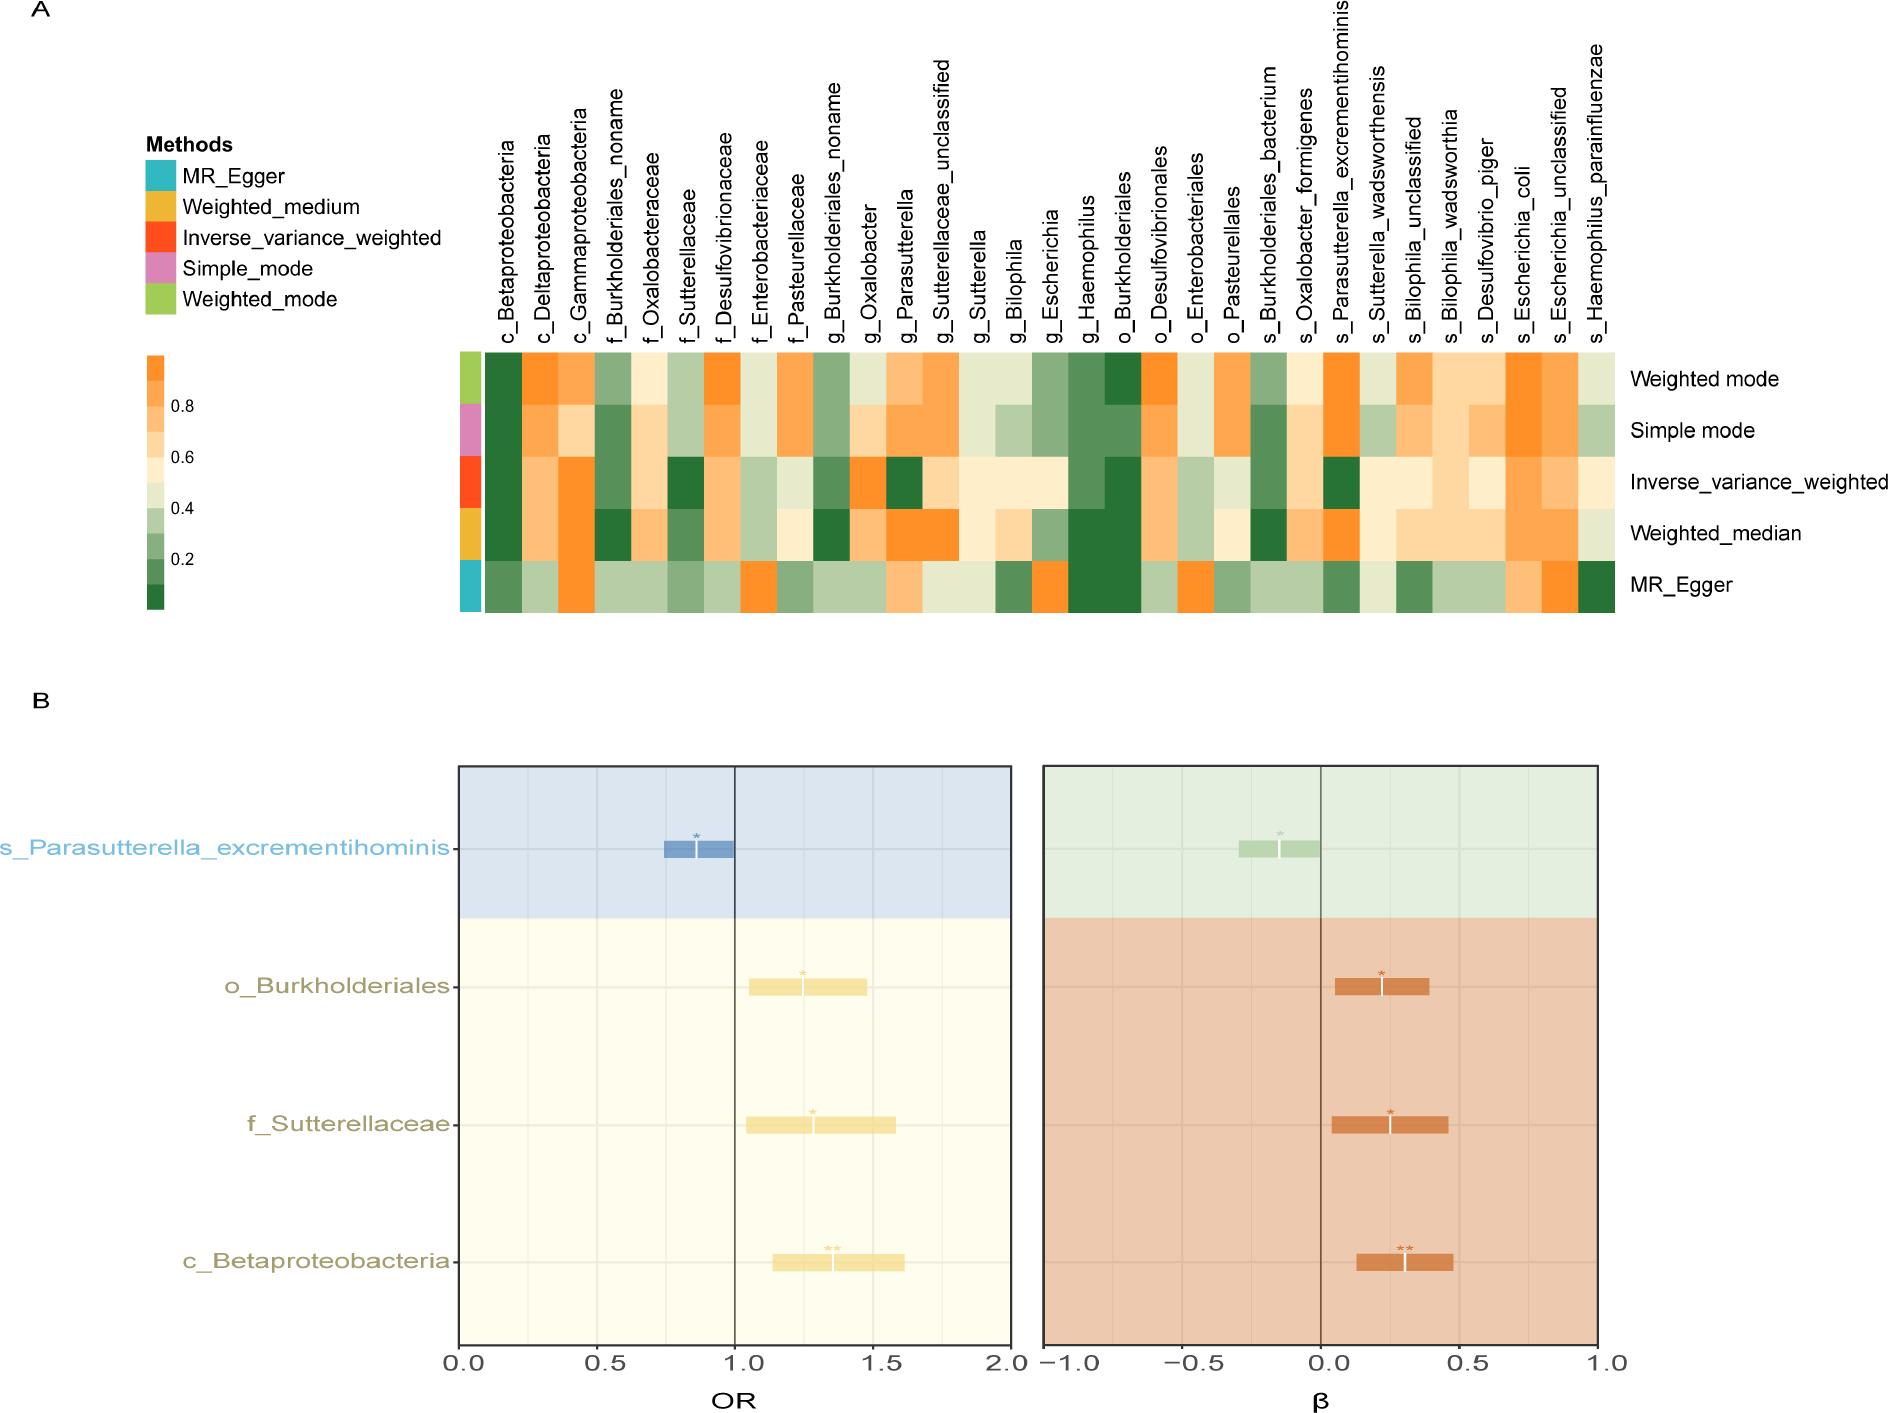
Fig. 3.
Detailed information of studies and datasets used for analysis_
| Data source | Phenotype | Sample size | Cases | Population |
|---|---|---|---|---|
| Dutch Microbiome | Gut microbial | 7,738 | / | Netherlands |
| European subjects in CLSA | Metabolites | 8,299 | / | European |
| FinnGen R10 | CDI | 409,432 | 3,384 | European |
Metabolites as intermediates in causal effects of gut microbiota on Clostridioides difficile infection (CDI)_
| Exposure | βe-i | ORe-i | Pe-i | Intermediate | βi-o | ORi-o | Pi-o | Outcome | βe-o | ORe-o |
|---|---|---|---|---|---|---|---|---|---|---|
| o_Burkholderiales | –0.110 | 0.896 | 0.047 | 3-hydroxylaurate | –0.616 | 0.540 | 0.010 | CDI | 0.220 | 1.247 |