Fig. 1.
Fig. 2.
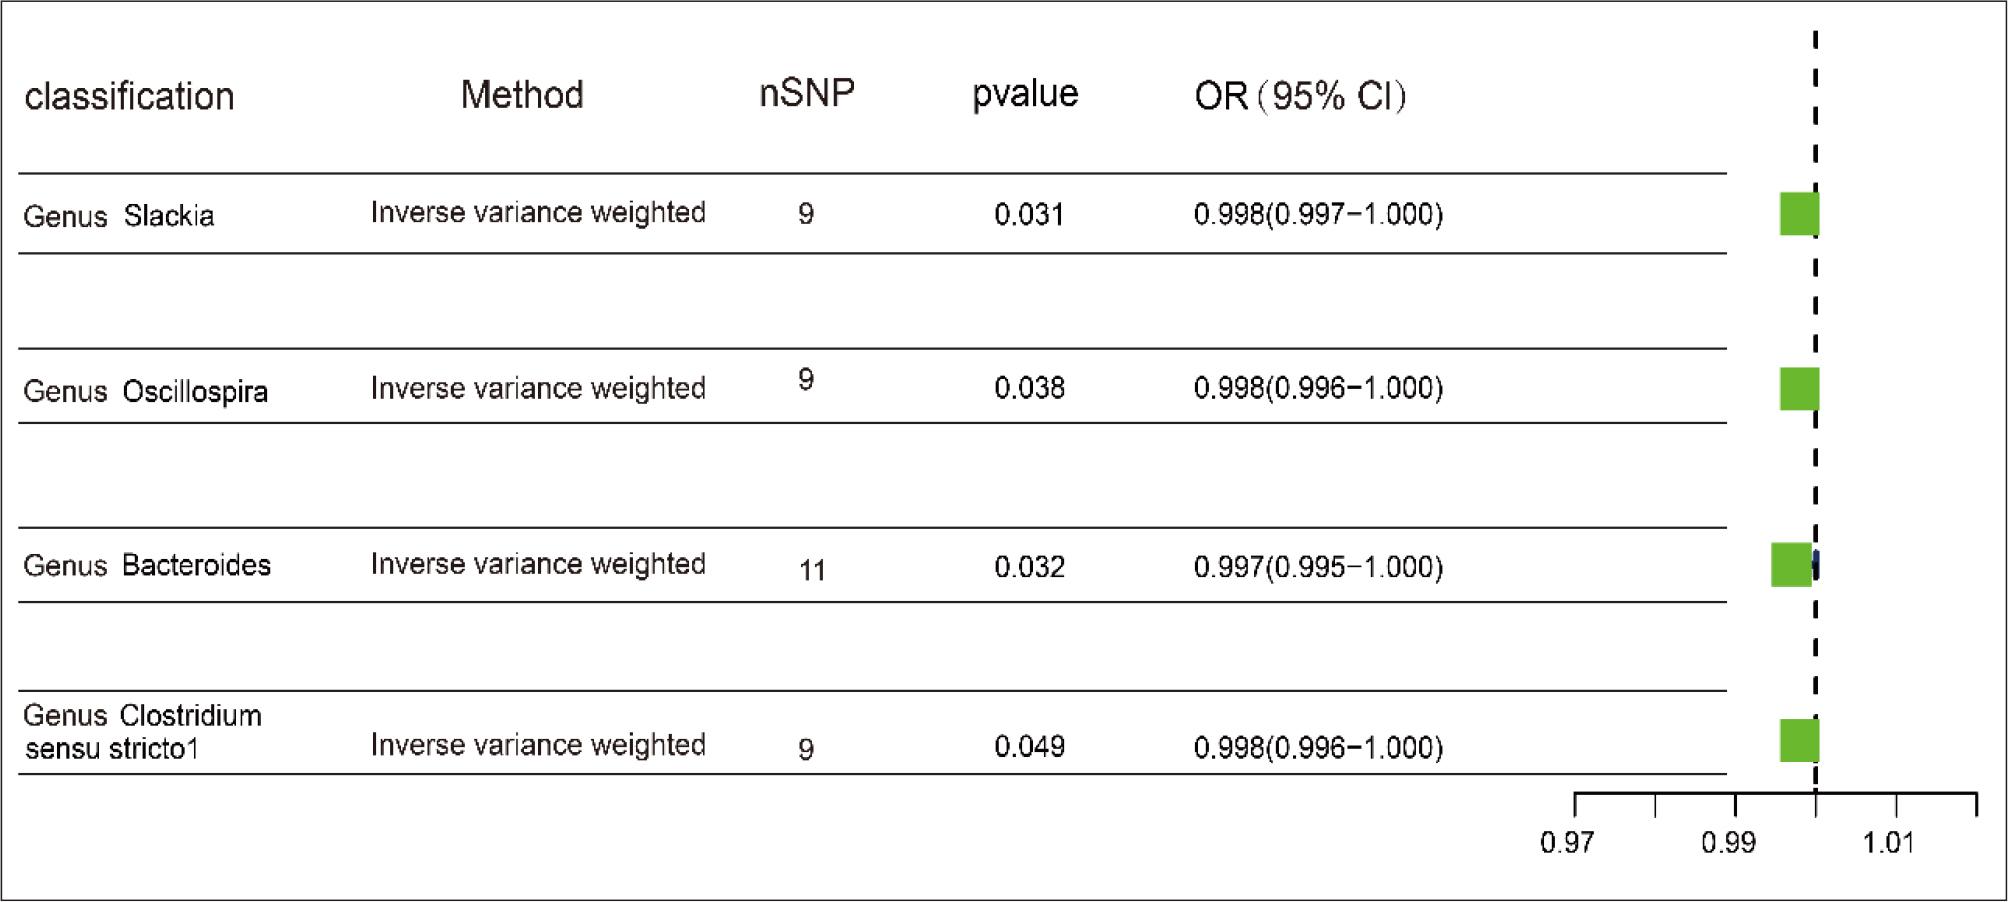
Fig. 3.
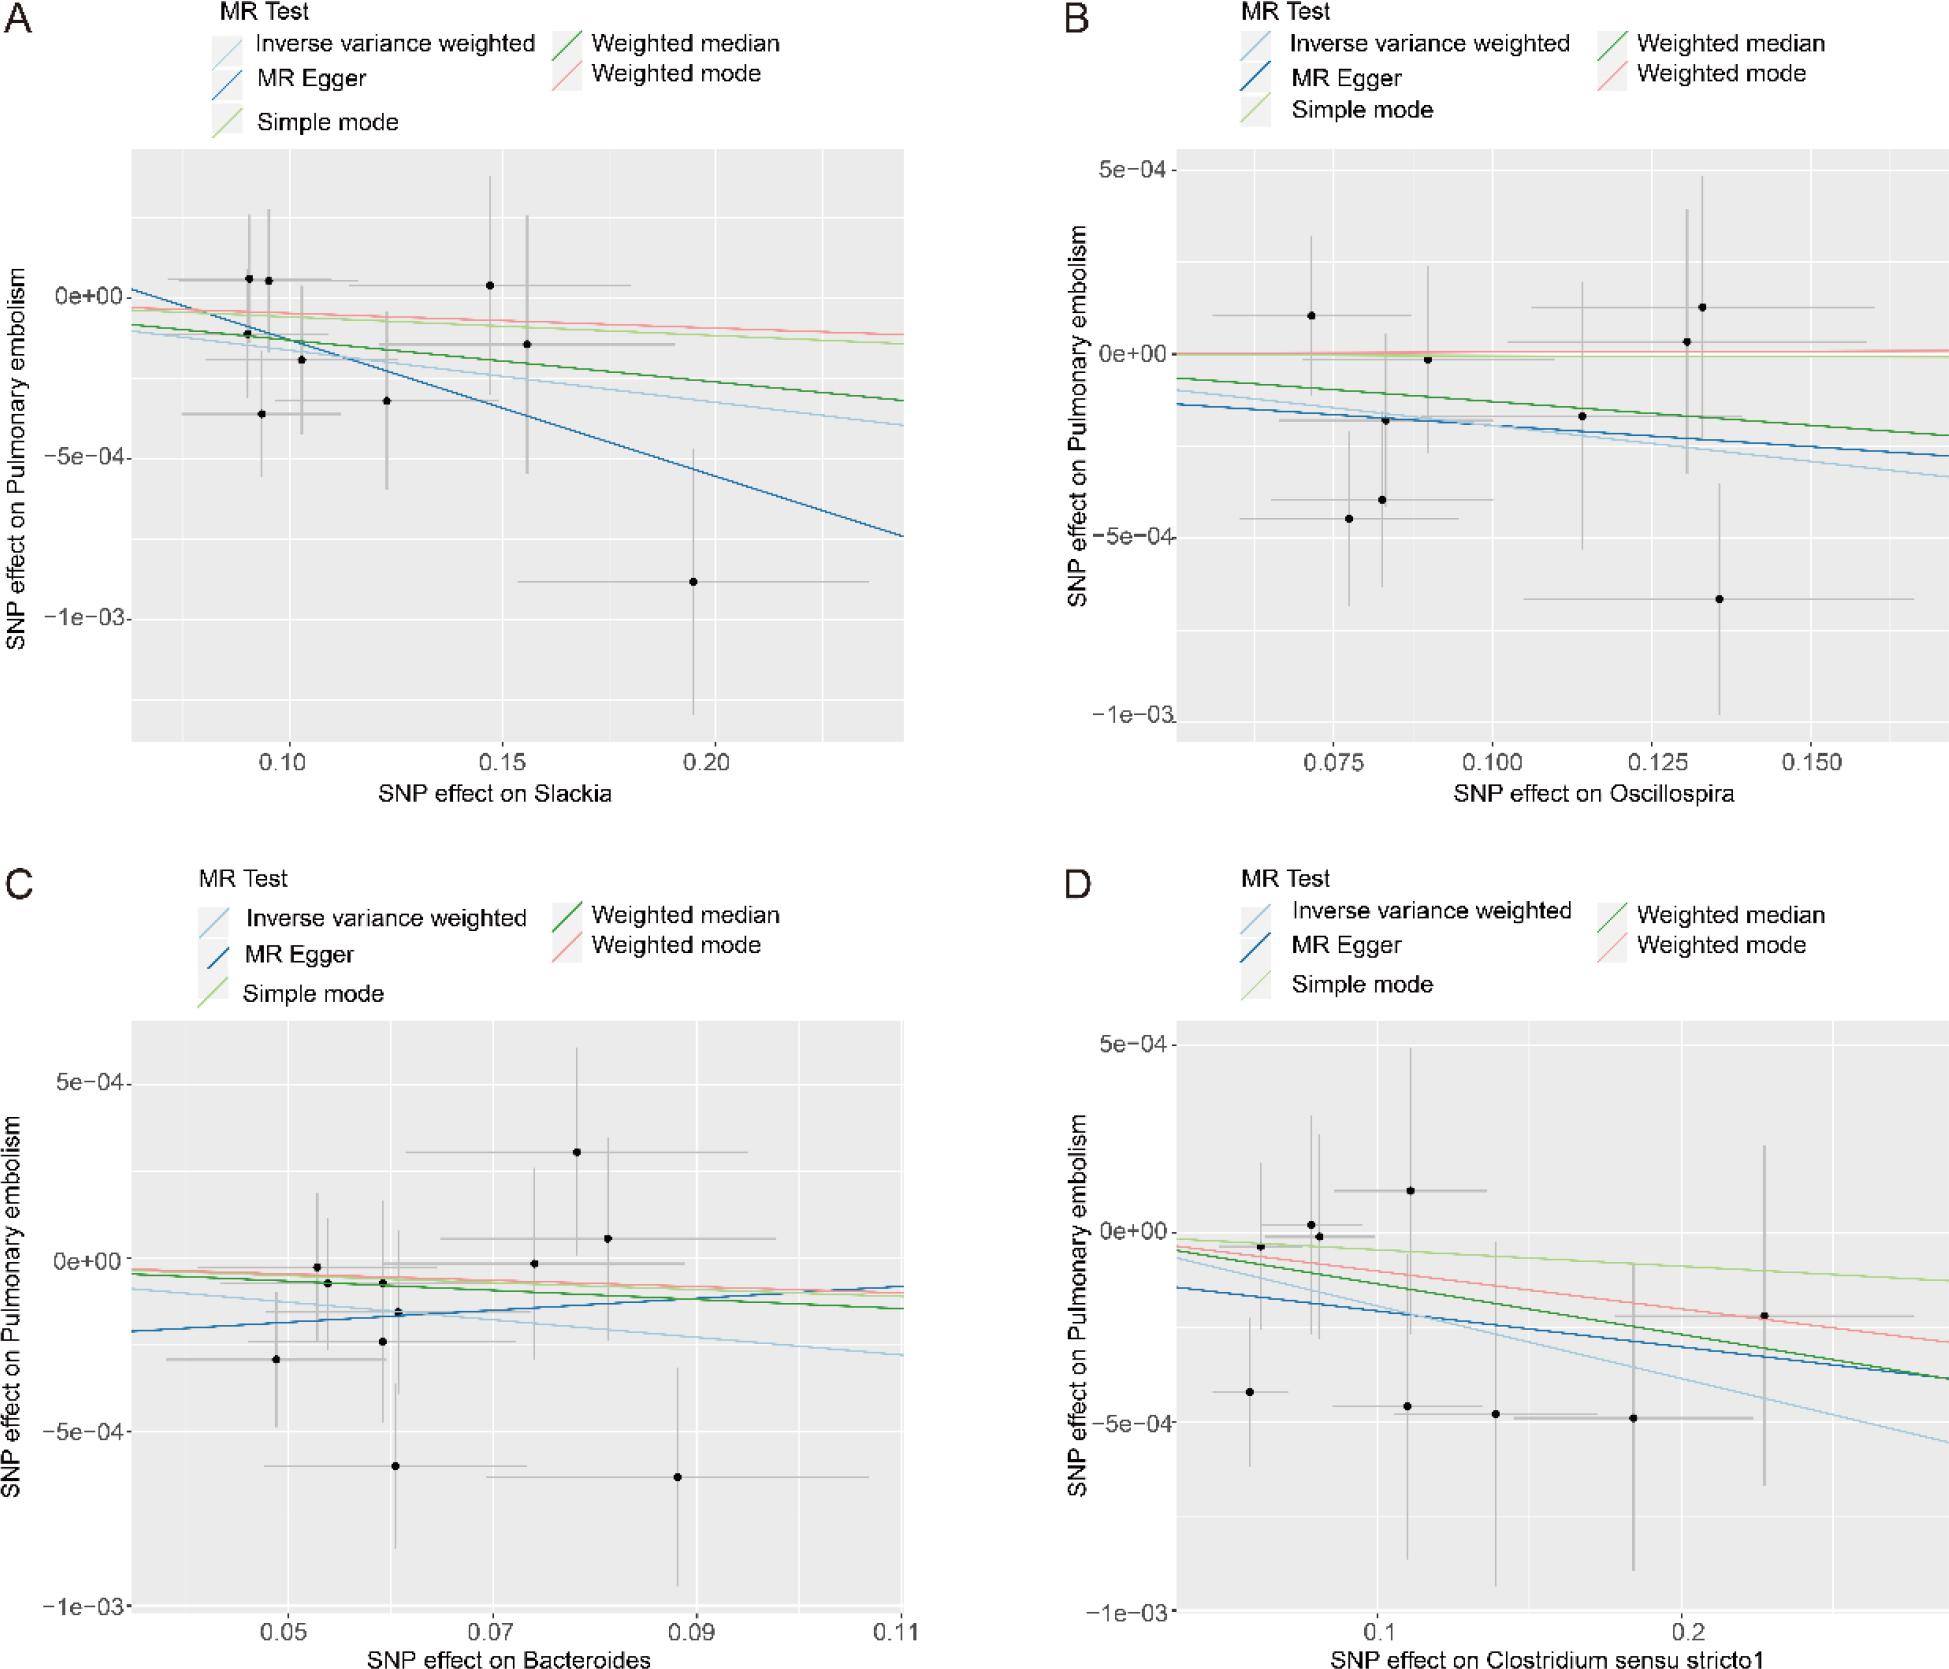
Fig. 4.
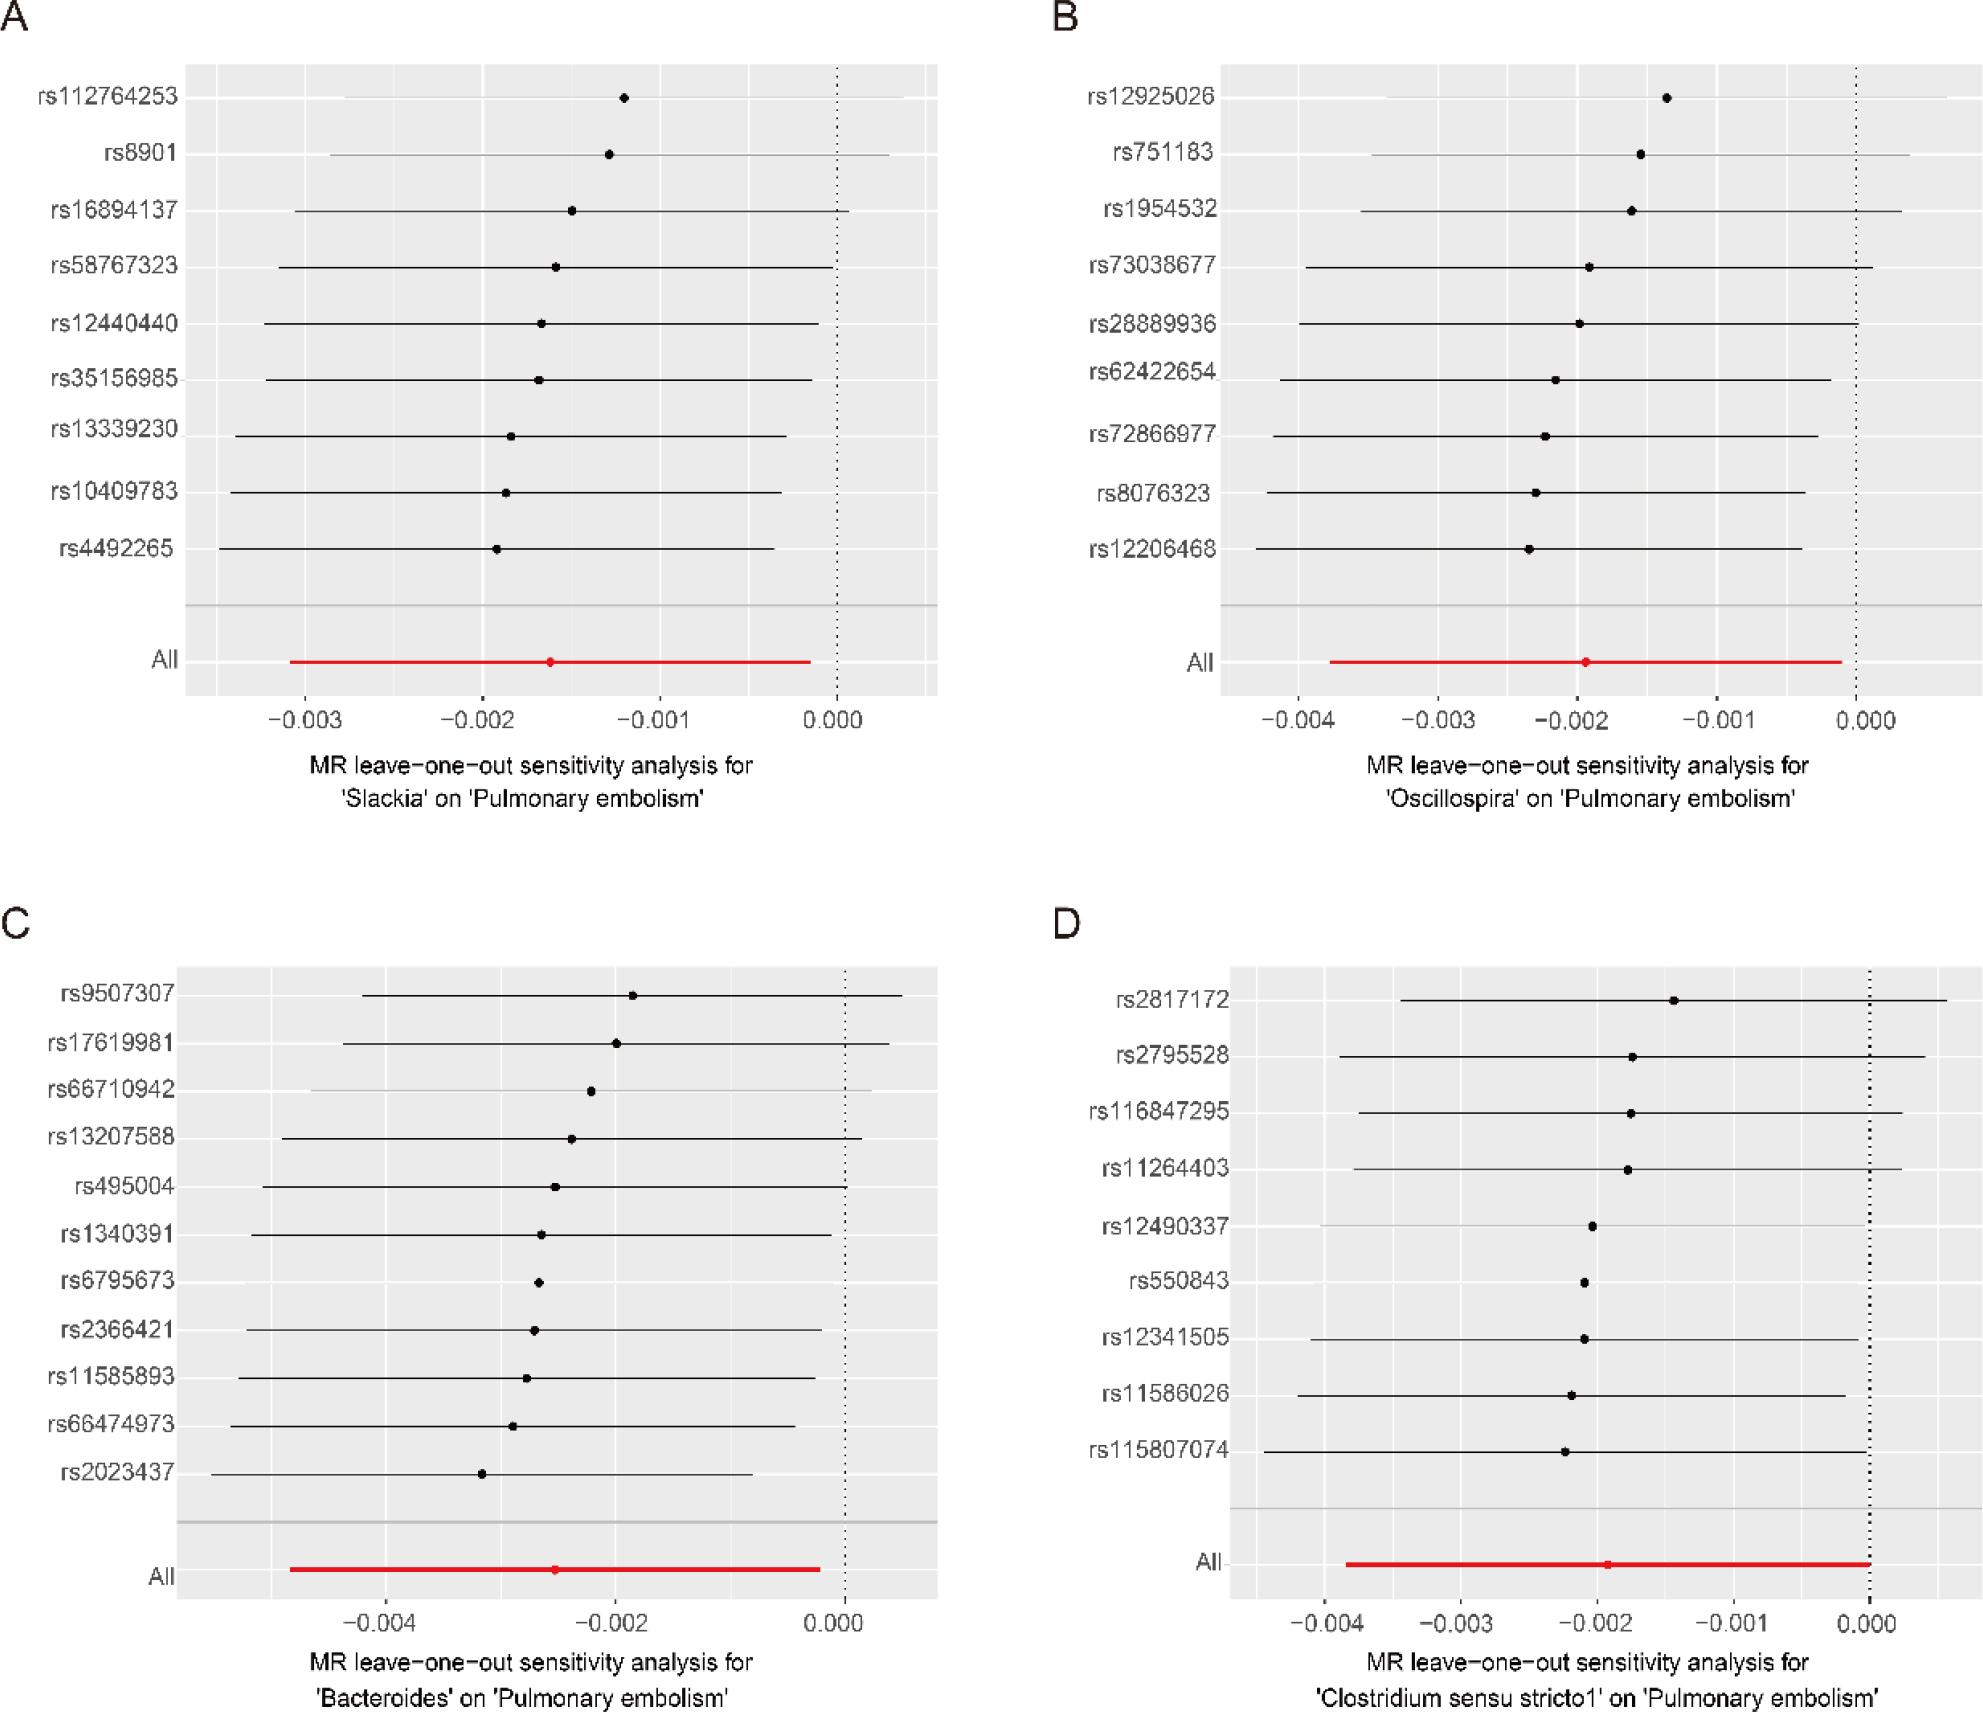
Fig. 5.
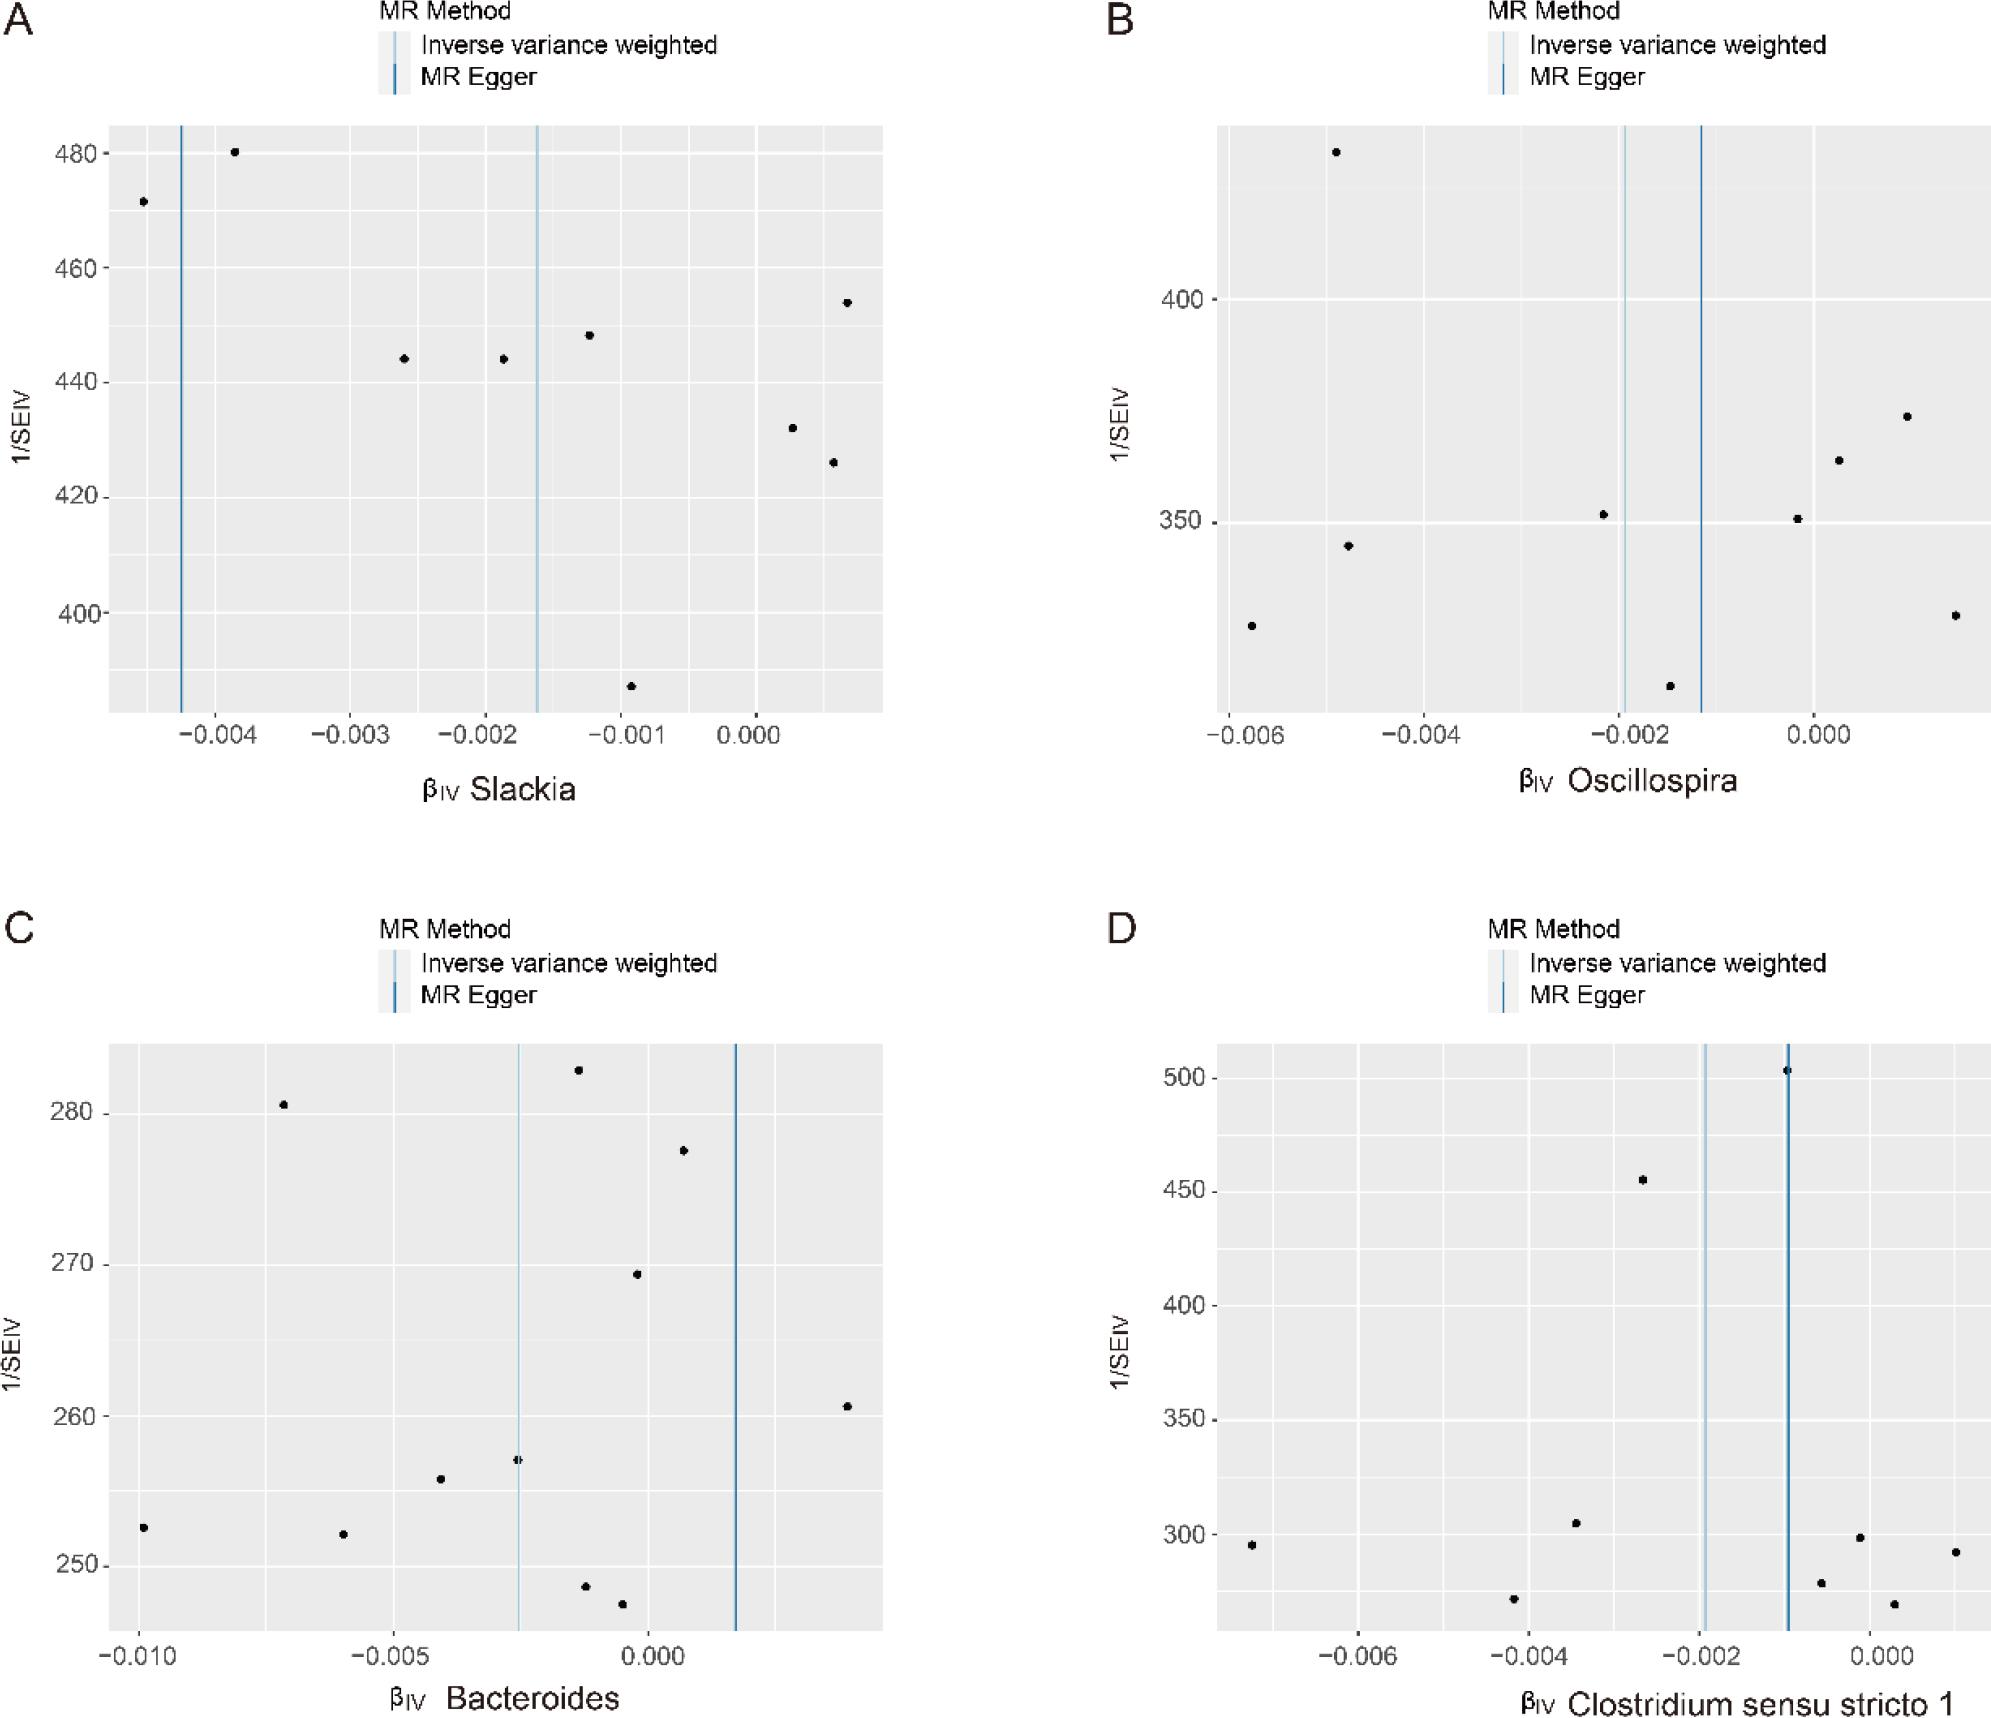
MR results of causal links between gut microbiota and pulmonary embolism risk_
| Classification | SNP | SE | p-value | OR (95%Cl) | Pleiotropy | Heterogeneity | MR-PRESSO | ||||
|---|---|---|---|---|---|---|---|---|---|---|---|
| Egger intercept | SE | p-value | Method | Q | p-value | ||||||
| Slackia | 9 | 0.0007 | 0.031 | 0.998 (0.997–1.000) | 0.0003 | 0.0003 | 0.424 | MR-Egger | 5.228 | 0.632 | 0.630 |
| IVW | 5.948 | 0.653 | |||||||||
| Oscillospira | 9 | 0.0006 | 0.038 | 0.998 (0.996–1.000) | –7.75 × 10⁻⁵ | 0.0004 | 0.851 | MR-Egger | 7.609 | 0.368 | 0.494 |
| IVW | 7.650 | 0.468 | |||||||||
| Bacteroides | 11 | 0.0012 | 0.032 | 0.997 (0.995–1.000) | –0.0003 | 0.0004 | 0.537 | MR-Egger | 10.079 | 0.344 | 0.403 |
| IVW | 10.541 | 0.394 | |||||||||
| Clostridium sensu stricto 1 | 9 | 0.0009 | 0.049 | 0.998 (0.996–1.000) | –0.0001 | 0.0002 | 0.634 | MR-Egger | 4.684 | 0.698 | 0.794 |
| IVW | 4.931 | 0.765 | |||||||||