

Fig. 1.
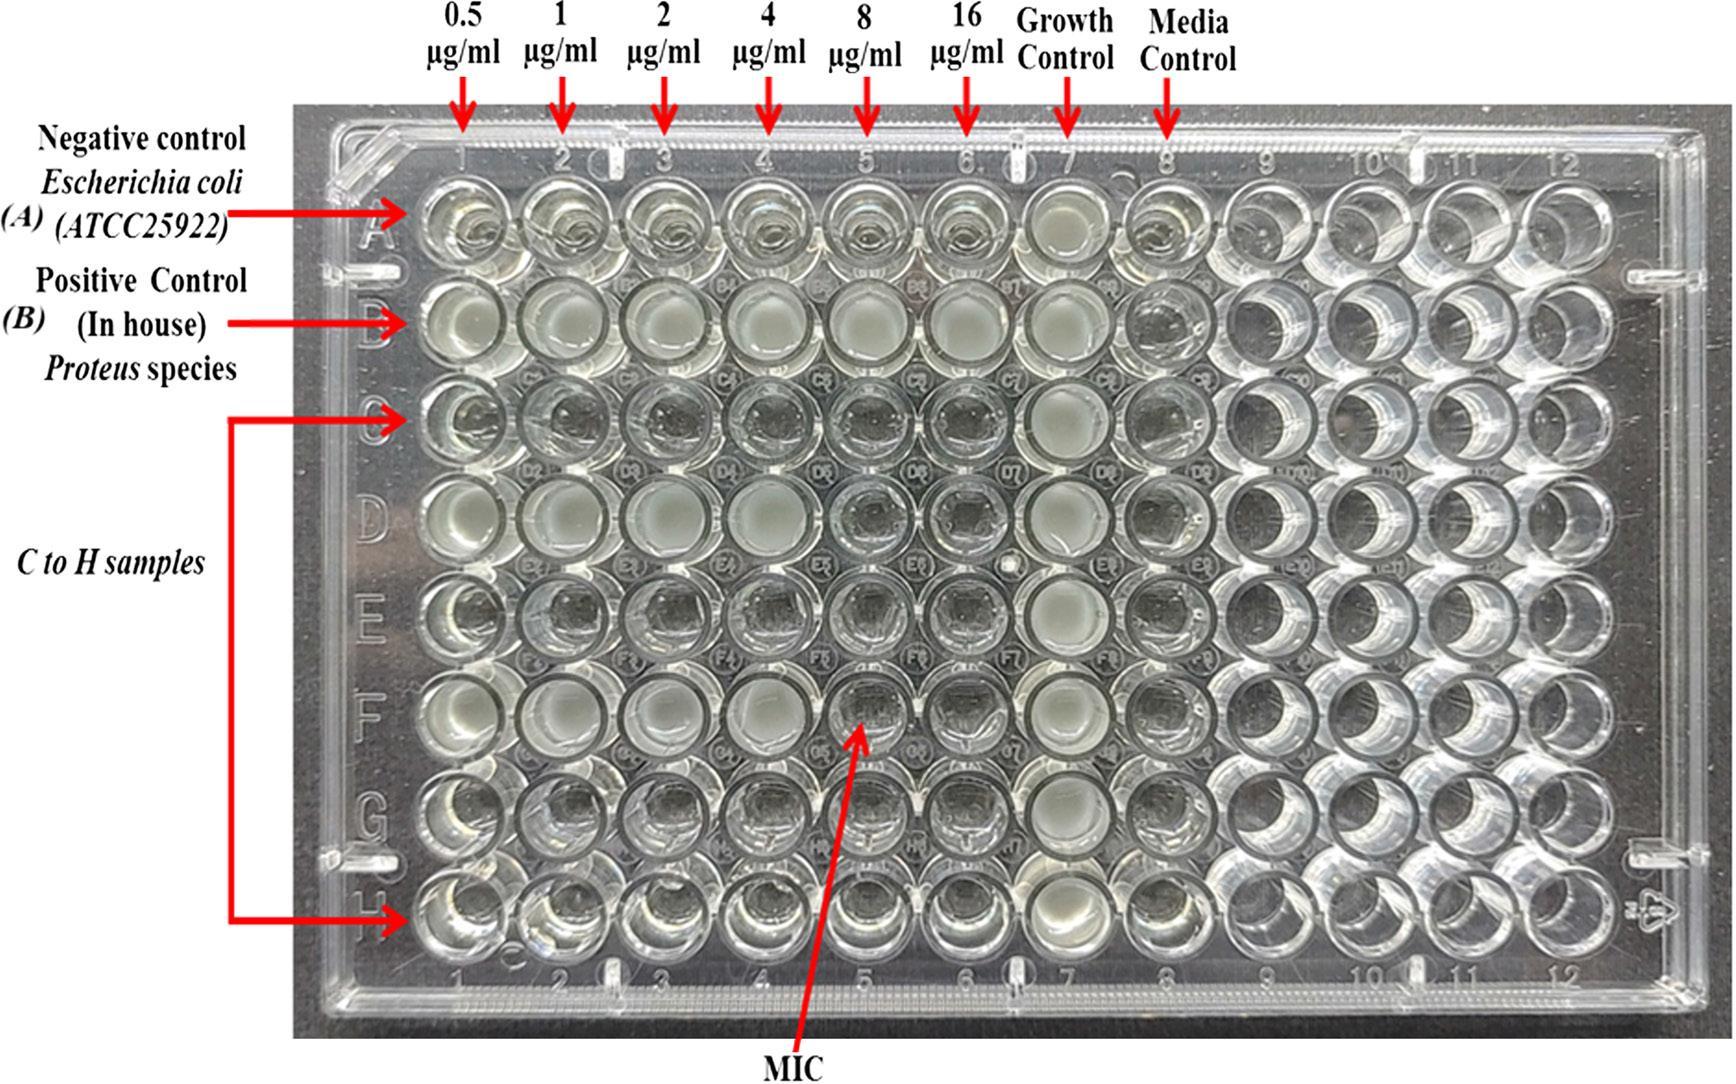
Fig. 2.
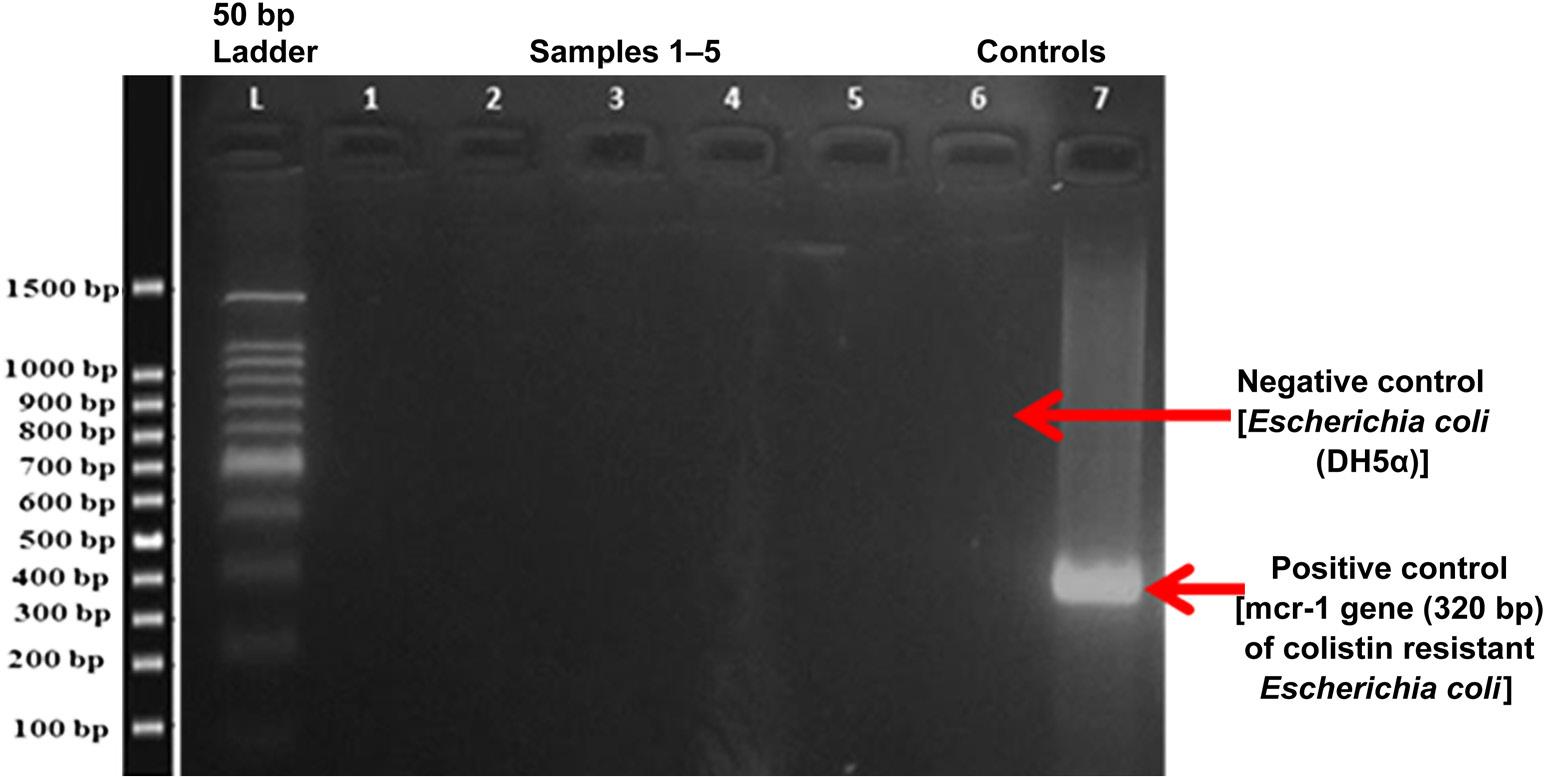
Fig. 3.
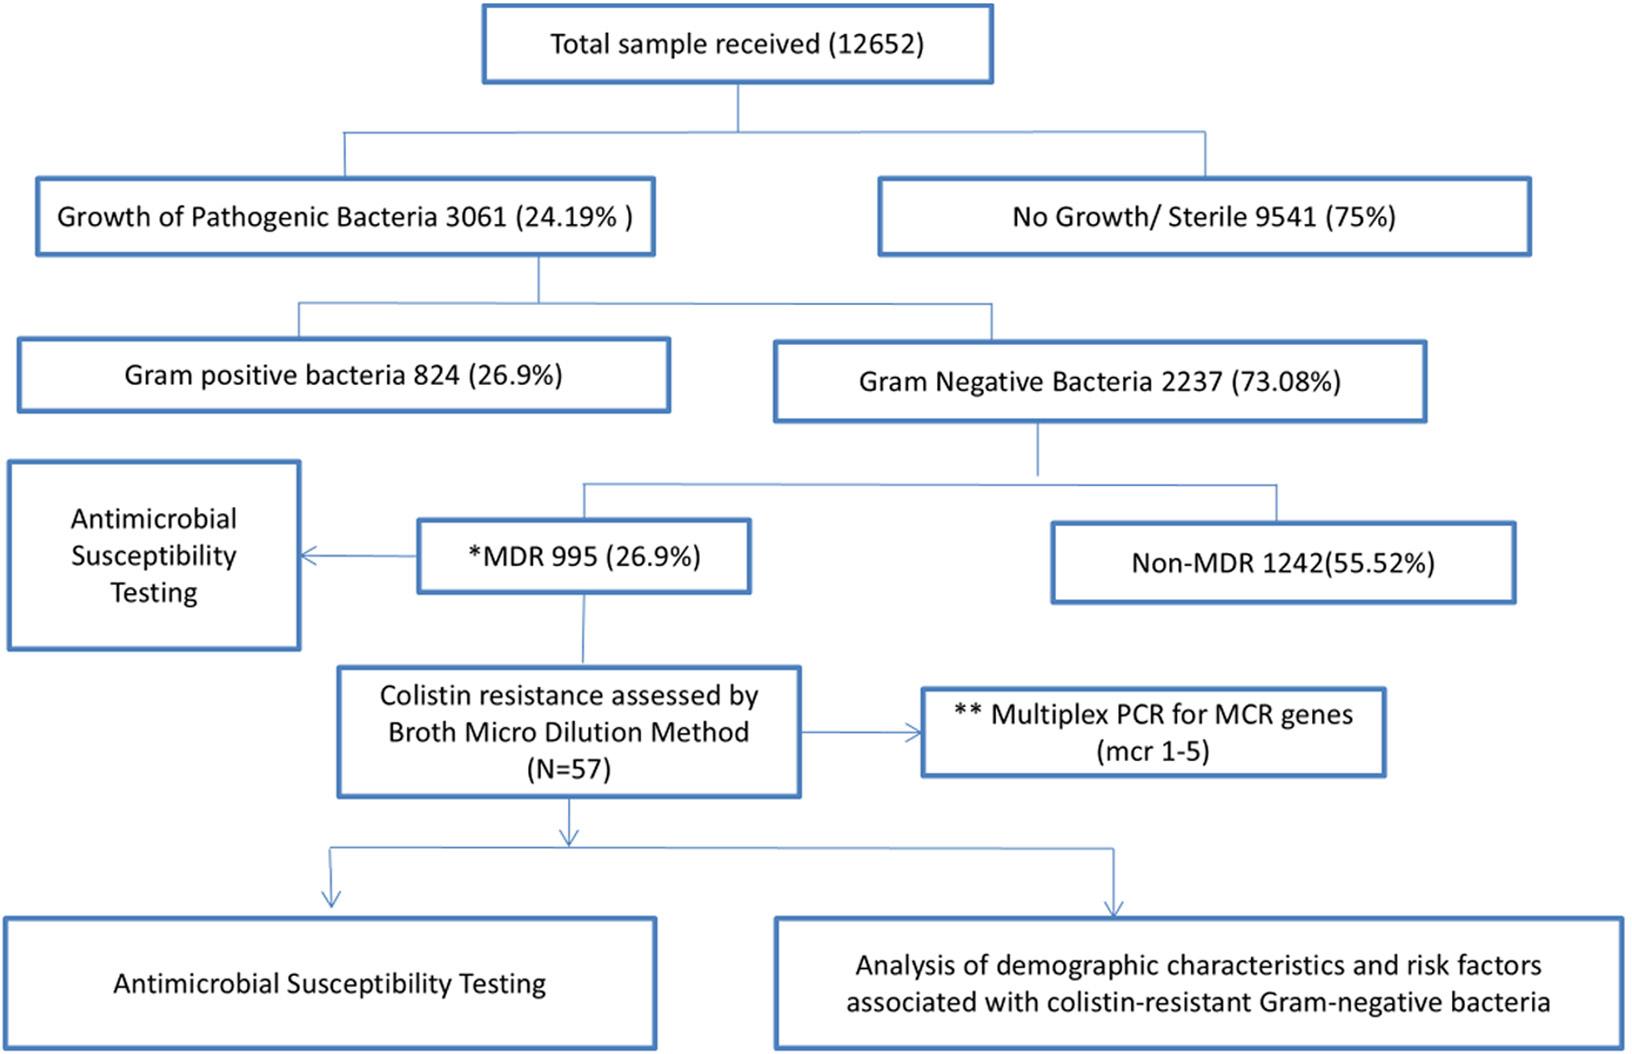
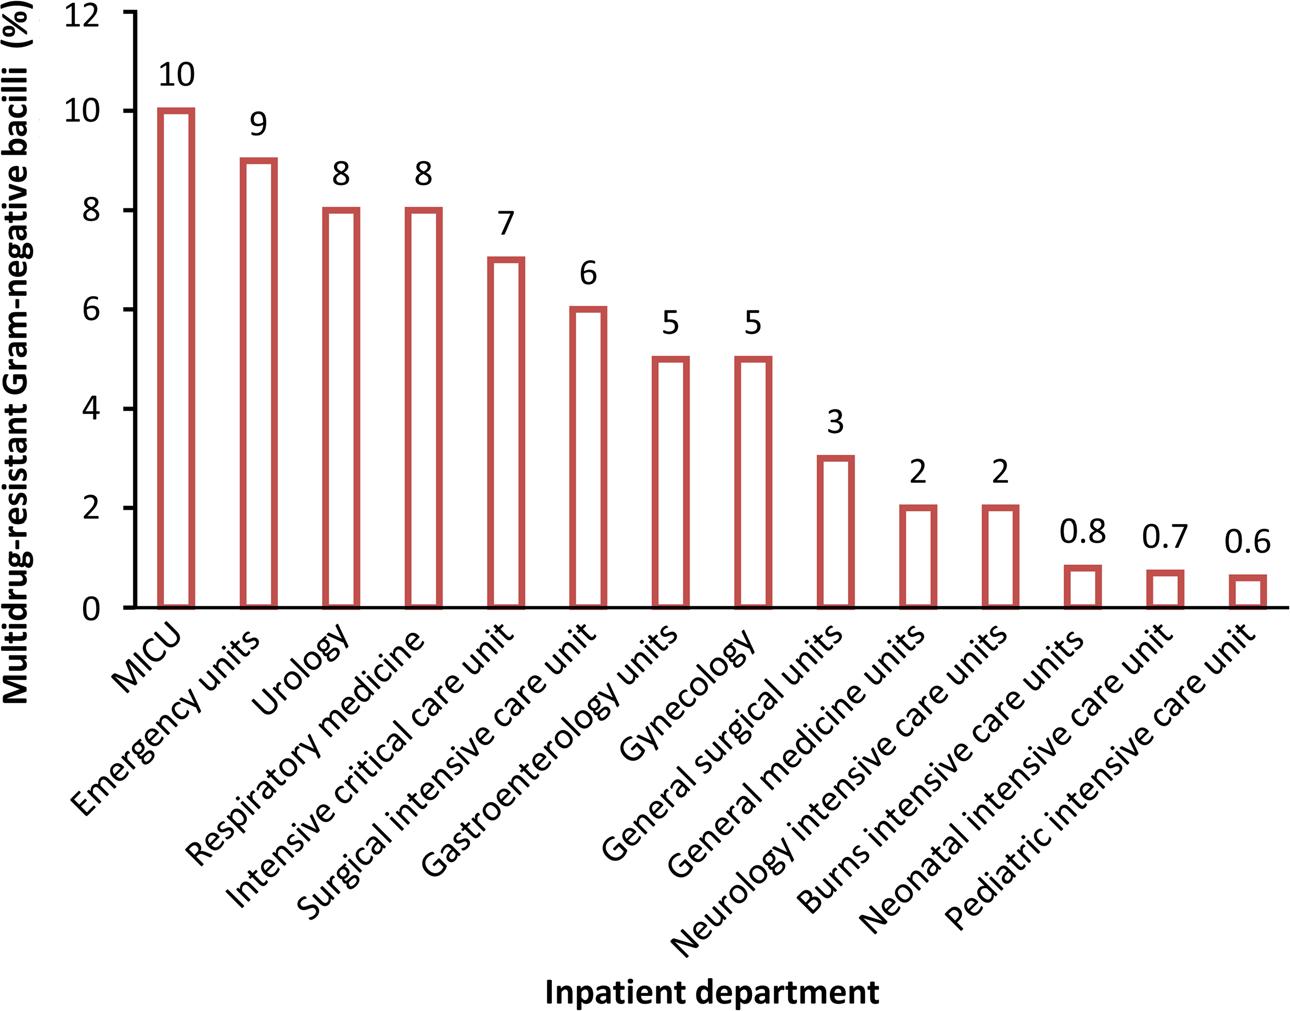
Fig. 4.
Antibiotic sensitivity pattern of colistin-resistant bacteria (n = 57)_
| Antibiotics | Escherichia coli (n = 16) (%) | Klebsiella pneumoniae (n = 13) (%) | Pseudomonas aeruginosa (n = 19) (%) | Acinetobacter spp. (n = 8) (%) | Citrobacter freundii (n = 1) (%) |
|---|---|---|---|---|---|
| Amoxicillin/clavulanic acid | 7 (44%) | 1 (8%) | ND | ND | – |
| Piperacillin/tazobactam | 5 (31%) | – | 6 (32%) | 1 (17%) | 1 (100%) |
| Cefotaxime | 1 (6%) | – | – | ND | – |
| Ceftriaxone | 2 (13%) | – | 3 (16%) | – | 1 (100%) |
| Cefepime | 2 (13%) | – | 1 (5%) | – | ND |
| Imipenem | – | – | – | – | – |
| Meropenem | 3 (9%) | – | 2 (11%) | 4 (50%) | – |
| Gentamicin | 8 (50%) | 5 (38%) | 7 (37%) | 2 (33%) | – |
| Amikacin | 13 (81%) | 5 (38%) | 10 (53%) | 6 (86%) | 1 (100%) |
| Ciprofloxacin | 3 (19%) | 1 (8%) | 2 (11%) | 1 (14%) | – |
| Cotrimoxazole | 10 (63%) | 4 (30%) | 0 | 1 (13%) | – |
The primers used for the targeted gene_
| Sr. No. | mcr genes | Amplicon size (bp) | Primer sequences (5’–3’)* |
|---|---|---|---|
| 1. | mcr-1 | 320 | F: AGTCCGTTTGTTCTTGTGGC |
| 2. | mcr-2 | 700 | F: CAAGTGTGTTGGTCGCAGTT |
| 3. | mcr-3 | 900 | F: AAATAAAAATTGTTCCGCTTATG |
| 4. | mcr-4 | 1,100 | F: TCACTTTCATCACTGCGTTG |
| 5. | mcr-5 | 1,644 | F: ATGCGGTTGTCTGCATTTATC |
Antibiotic-resistance rate (in percentage) among multidrug-resistant Gram-negative bacilli_
| Antibiotics | Escherichia coli (n = 481) (%) | Klebsiella pneumoniae (n = 265) (%) | Klebsiella oxytoca (n = 15) (%) | Pseudomonas aeruginosa (n = 157) (%) | Pseudomonas spp. (n = 06) (%) | Acinetobacter spp. (n = 70) (%) | Citrobacter freundii (n = 1) (%) |
|---|---|---|---|---|---|---|---|
| Amoxycillin/Clavulanic acid | 257 (53%) | 189 (71%) | 13 (87%) | ND | ND | ND | ND |
| Piperacillin/tazobactam | 200 (42%) | 176 (66%) | 12 (80%) | 85 (54%) | 4 (67%) | 62 (89%) | – |
| Cefotaxime | 455 (95%) | 251 (94%) | 14 (93%) | 24 (86 | ND* | 7 (88%) | 1 (100%) |
| Ceftriaxone | 405 (84%) | 239 (90%) | 13 (87%) | 110 (70%) | 4 (67%) | 59 (84%) | – |
| Cefepime | 93 (78%) | 198 (75%) | 14 (93%) | 115 (73%) | 4 (67%) | 65 (93%) | ND |
| Imipenem | 399 (82%) | 223 (84%) | 11 (73%) | 104 (66%) | 5 (83%) | 68 (97%) | 1 (100%) |
| Meropenem | 193 (40%) | 127 (48%) | 8 (53%) | 82 (52%) | 4 (67%) | 57 (81%) | 1 (100%) |
| Gentamicin | 218 (45%) | 150 (7%) | 8 (53%) | 79 (50%) | 4 (67%) | 60 (86%) | 1 (100%) |
| Amikacin | 79 (16%) | 85 (32%) | 8 (53%) | 72 (46%) | 4 (67%) | 36 (51%) | – |
| Ciprofloxacin | 450 (94%) | 229 (86%) | 14 (93%) | 110 (70%) | 5 (83%) | 68 (97%) | 1 (100%) |
| Cotrimoxazole | 257 (53%) | 175 (66%) | 09 (60%) | 143 (91%) | 05 (83%) | 59 (84%) | – |
Determination of colistin minimum inhibitory concentration (MICs) of different MDR Gram-negative isolates by Broth Micro Dilution method_
| MICs of colistin (n = 995) | Klebsiella spp. (n = 280) (%) | Escherichia coli (n = 481) (%) | Pseudomonas spp. (n = 163) (%) | Acinetobacter spp. (n = 70) (%) | Citrobacter freundii (n = 1) (%) |
|---|---|---|---|---|---|
| ≤ 0.5 μg/ml | 207 (74%) | 415 (86%) | 99 (61%) | 28 (40%) | – |
| 1 μg/ml | 17 (6%) | 23 (5%) | 36 (22%) | 30 (43%) | – |
| 2 μg/ml | 43 (16%) | 27 (6%) | 09 (6%) | 04 (6%) | – |
| 4 μg/ml | 09 (3%) | 06 (1%) | 17 (10%) | 06 (9%) | 01 (100%) |
| 8 μg/ml | 03 (1%) | 6 (1%) | 01 (0.61%) | 01 (1%) | – |
| ≥ 16 μg/ml | 01 (0.36%) | 04 (0.82%) | 01 (0.61%) | 01 (14%) | – |
Demographic characteristics and risk factors associated with colistin-resistant Gram-negative bacteria_
| Demographic characteristics | MDR-GNB (n = 995) (%) | Colistin resistance (n = 57) (%) | Level of significance (Chi-square test) | |
|---|---|---|---|---|
| Age (years) | 0–20 years | 64 (6%) | 08 (13%) | 0.0816 |
| 21–40 years | 279 (28%) | 15 (5%) | ||
| 41–60 years | 361 (36%) | 23 (6%) | ||
| Above 60 years | 291 (29%) | 11 (4%) | ||
| Gender | Male | 602 (61%) | 46 (8%) | 0.2439 |
| Female | 393 (39%) | 11 (3%) | ||
| Residence | Rural | 724 (73%) | 40 (6%) | 0.6699 |
| Urban | 271 (27%) | 17 (6%) | ||
| Education | aIntermediate level | 530 (55%) | 47 (9%) | < 0.0001 |
| bUndergraduate level | 357 (37%) | 06 (2%) | ||
| cGraduate level or higher | 108 (6%) | 01 (2%) | ||
| Risk factors associated with colistin resistance | ||||
| Duration of hospital stay | Less than 48 h | 19(2%) | – | < 0.001*** |
| 2–5 days | 99 (10%) | – | ||
| 5–15 days | 368 (37%) | 1 (2%) | ||
| > 15 days | 509 (51%) | 56 (98%) | ||
| History of previous hospitalization for more than 5 days with beta-lactam antibiotics | 448 (45%) | 41 (72%) | 0.0264* | |
| Diabetes | 278 (28%) | 32 (56%) | 0.0021** | |
| Chronic heart disease (CHD) | 139 (14%) | 1 (2%) | 0.0151* | |
| Chronic obstructive pulmonary disease (COPD) | 265 (27%) | 11 (19 %) | 0.0061** | |
| Chronic renal disease (CRD) | 129 (13%) | 4 (7%) | 0.2358 | |
Distribution of multidrug resistance and colistin-resistant Gram-negative bacilli in various samples_
| Specimens | Gram-negative isolates (n = 2,237) (%) | *MDR GNB (n = 995) (%) | Colistin resistant bacteria (n = 57) (%) |
|---|---|---|---|
| Blood | 402 (18%) | 112 (28%) | 9 (8%) |
| Sputum | 419 (19%) | 151 (36%) | 9 (6%) |
| Urine | 811 (34%) | 560 (69%) | 25 (4%) |
| Wound swab | 165 (10% | 32 (19%) | 2 (6%) |
| Pus | 322 (14%) | 137 (43%) | 12 (9%) |
| Endotracheal swab | 46 (2%) | 02 (4%) | – |
| Vaginal Swab | 72 (3%) | 01 (1%) | – |