
Fig. 1.
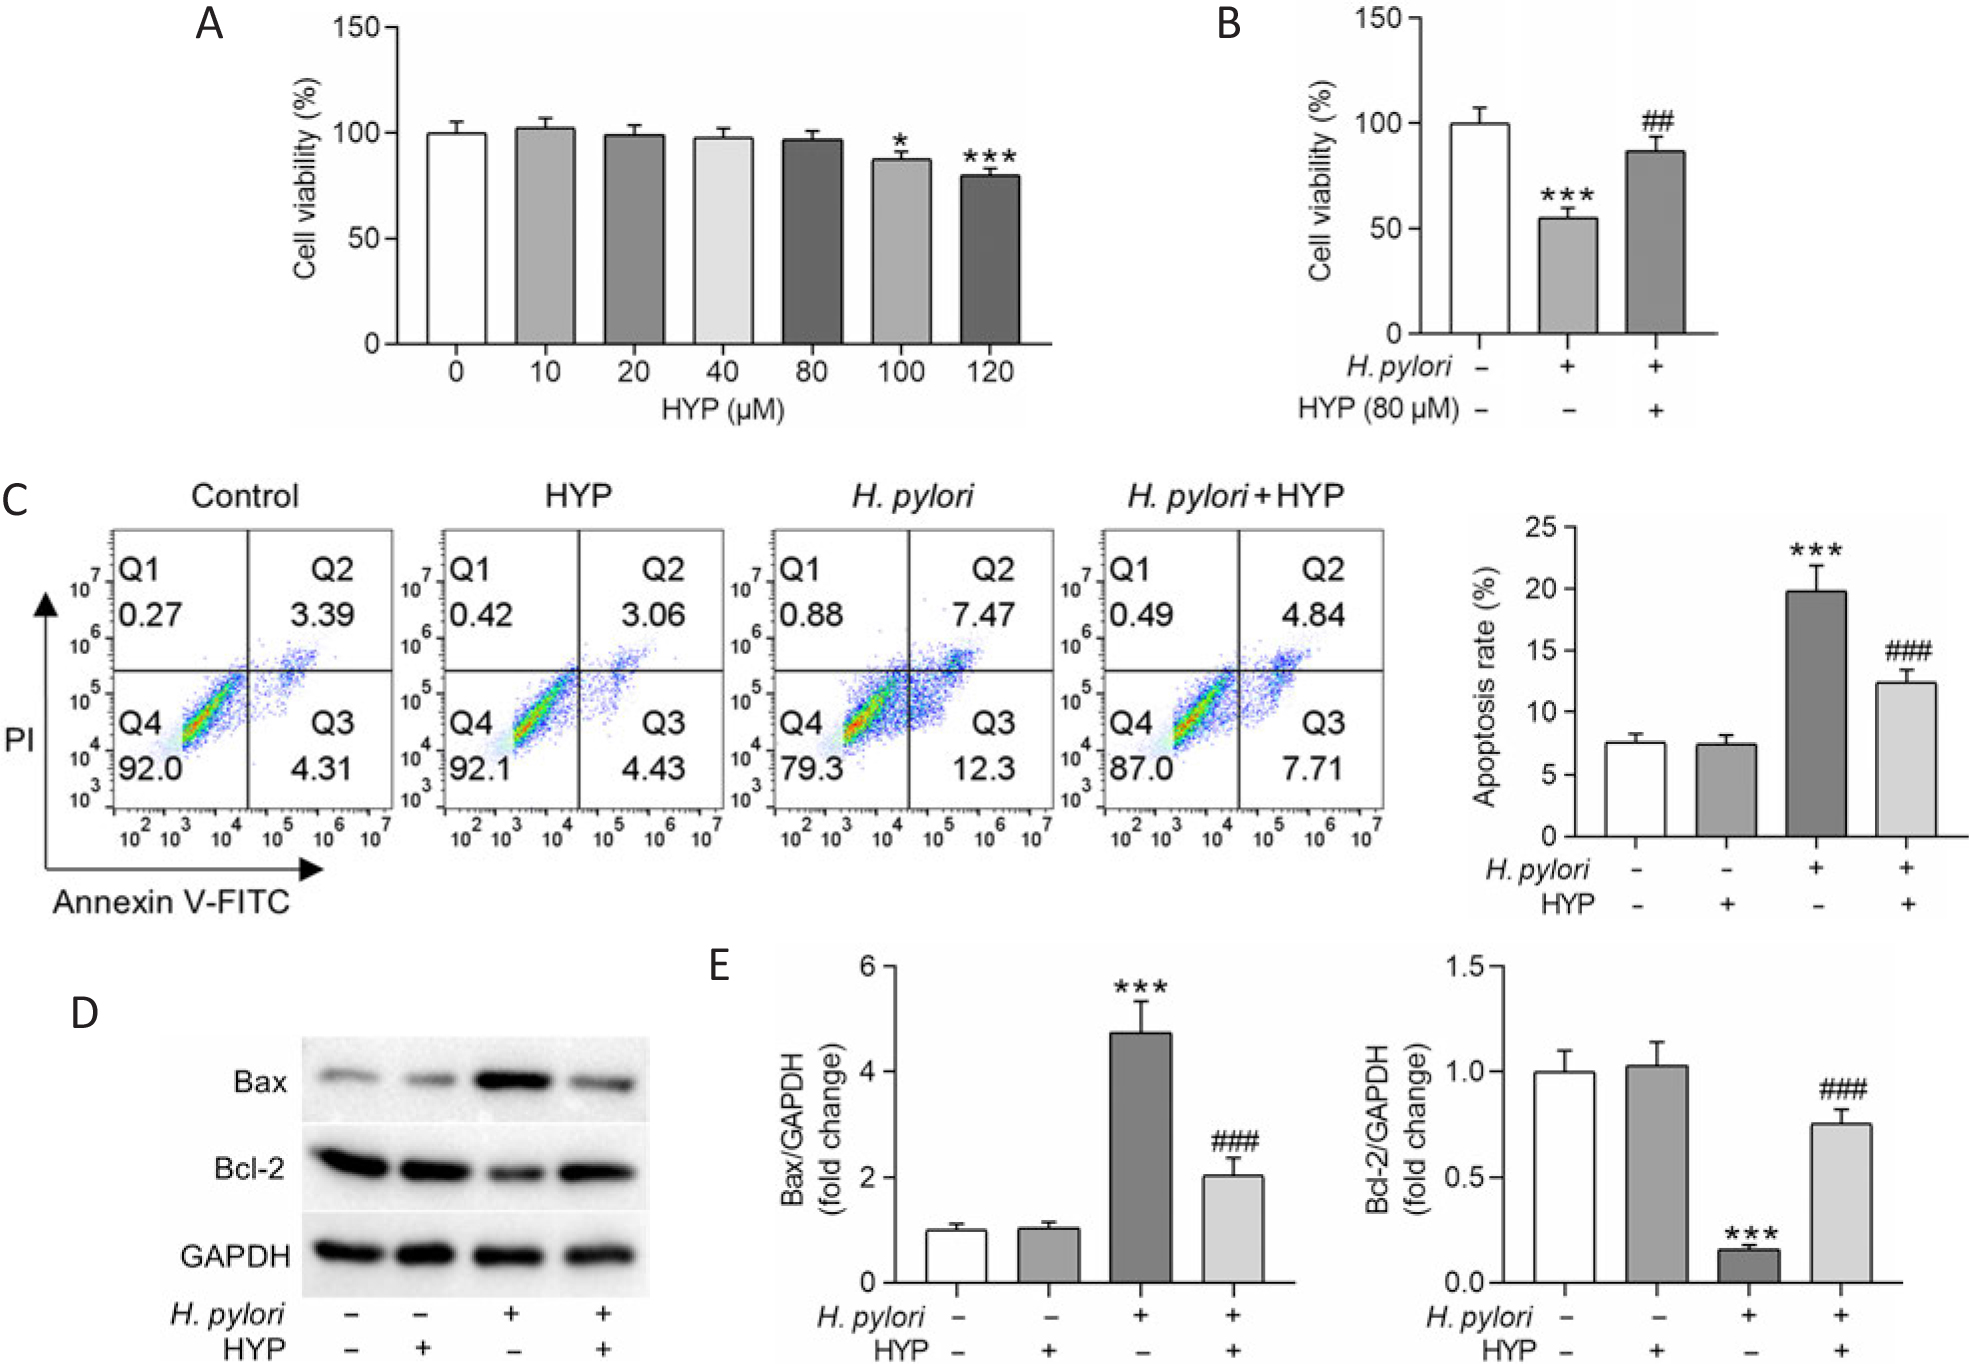
HYP reduces Helicobacter pylori-induced GES-1 cell apoptosis.
A) Assessment of GES-1 cell viability after 24 h treatment with HYP (0, 10, 20, 40, 80, 100, or 120 μM) by CCK-8 assay;
B) evaluation of the viability of H. pylori-infected GES-1 cells pre-treated with or without HYP (80 μM) by CCK-8 assay;
C) analysis of GES-1 cell apoptosis following HYP pre-treatment and H. pylori stimulation through flow cytometry assay;
D–E) measurement of Bax and Bcl-2 protein levels in H. pylori-infected GES-1 cells with or without HYP pre-treatment via western blotting. *p < 0.05, ***p < 0.001 vs. control; ##p < 0.01, ###p < 0.001 vs. H. pylori.
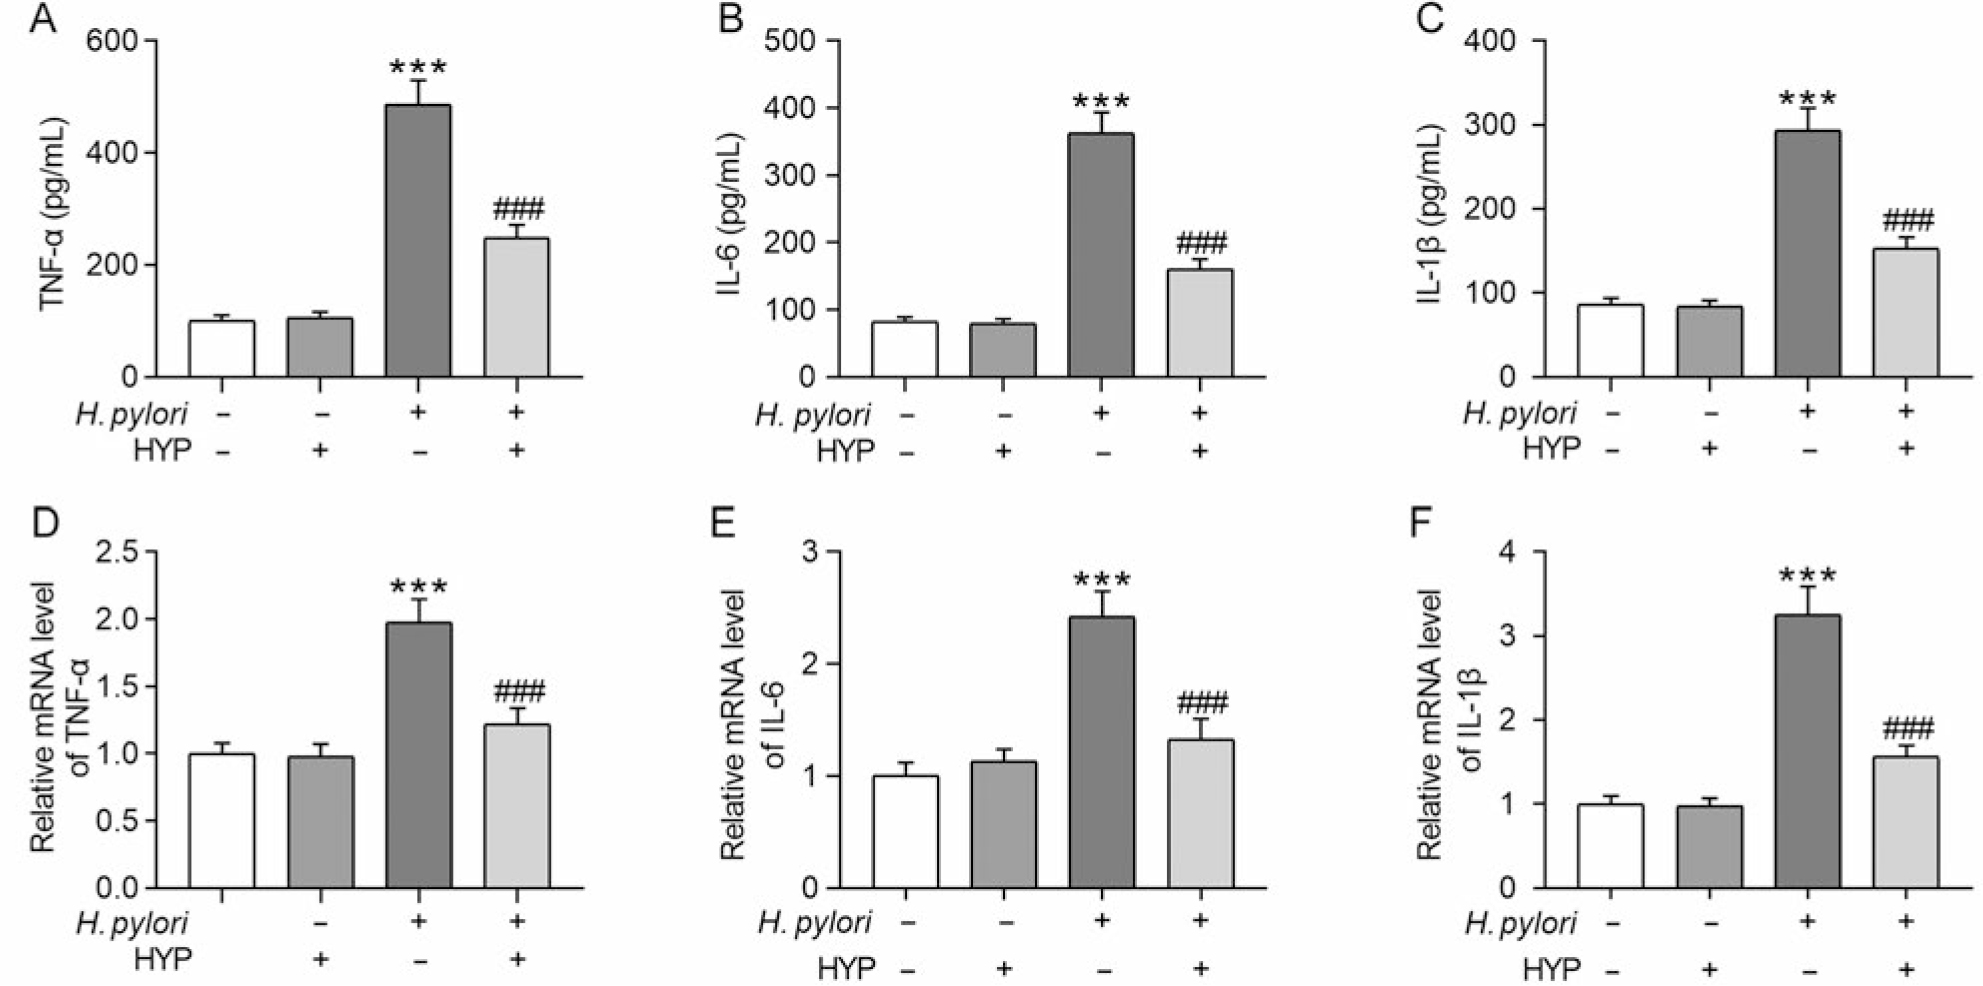
Fig. 2.
HYP mitigates Helicobacter pylori-induced GES-1 cell inflammation. GES-1 cells were pre-treated with HYP for 4 h (80 μM), followed by H. pylori infection for 24 h.
A–C) Detection of TNF-α, IL-6, and IL-1β levels in GES-1 cell supernatants by ELISA;
D–F) analysis of TNF-α, IL-6, and IL-1β mRNA levels in GES-1 cells through RT-qPCR. ***p < 0.001 vs. control; ###p < 0.001 vs. H. pylori.
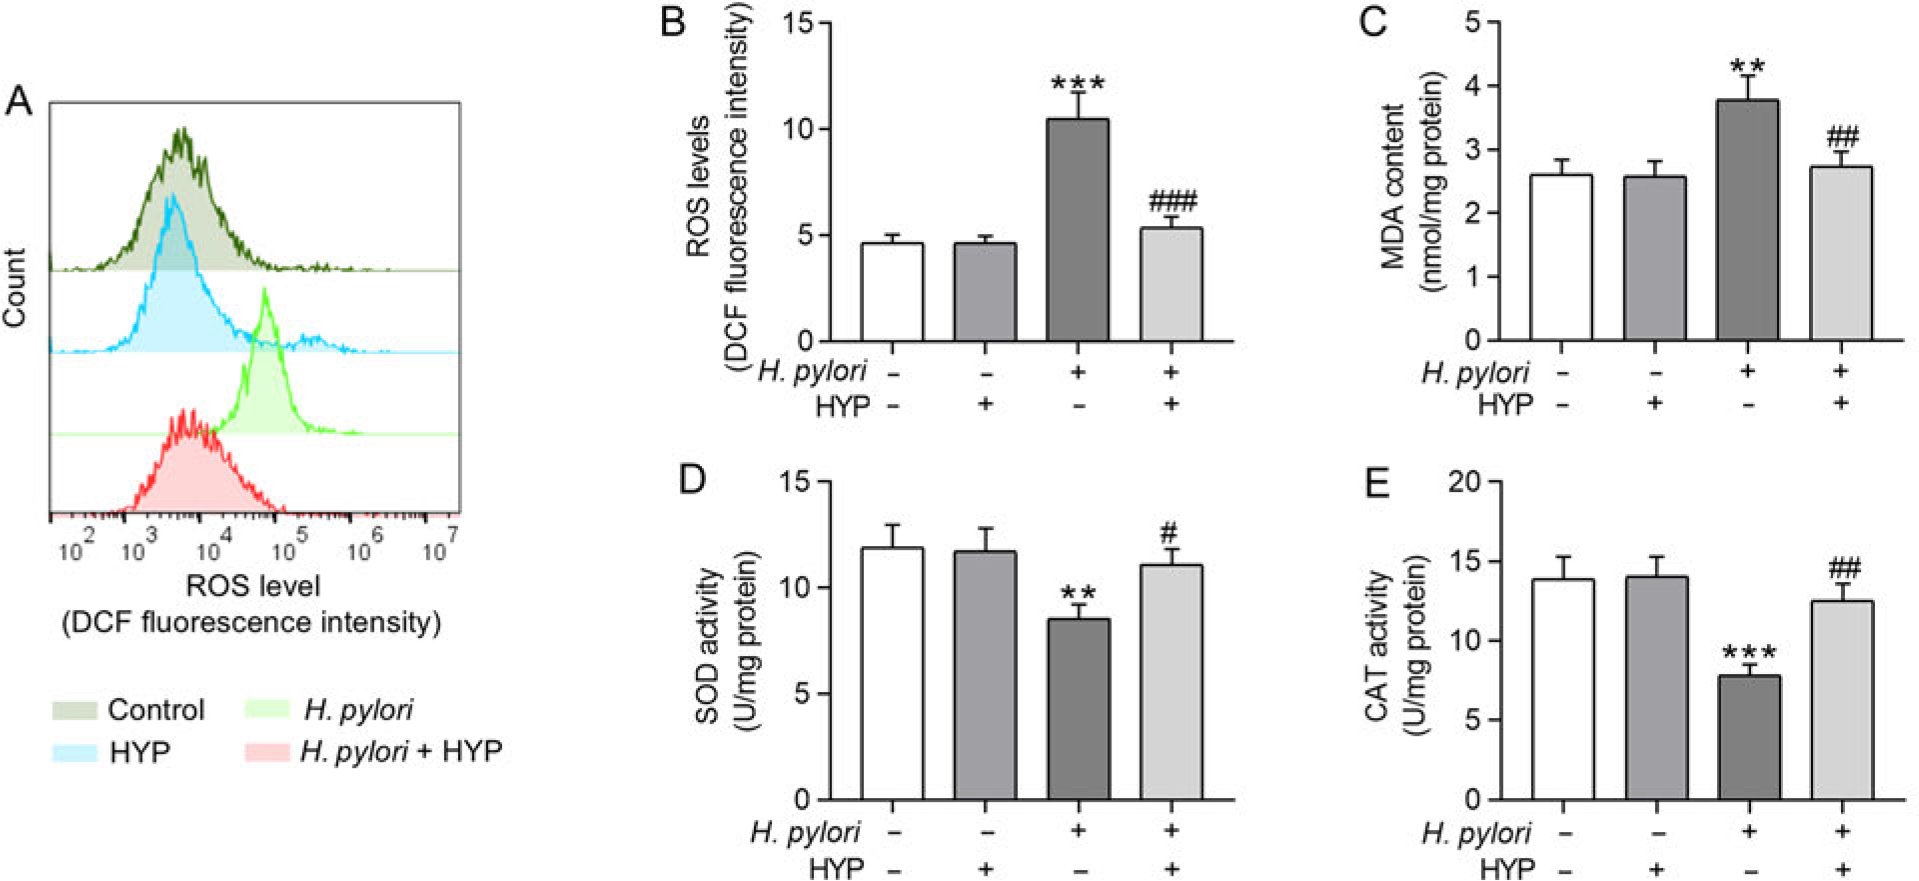
Fig. 3.
HYP ameliorates Helicobacter pylori-induced oxidative stress in GES-1 cells. GES-1 cells were pre-treated with HYP for 4 h (80 μM), followed by H. pylori infection for 24 h.
A) Measurement of DCF fluorescence intensity in GES-1 cells using flow cytometry;
B) quantification of intracellular ROS production by measuring DCF fluorescence intensity;
C–E) examination of MDA content and SOD and CAT activities in GES-1 cells using the corresponding assay kits. **p < 0.01, ***p < 0.001 vs. control; #p < 0.05, ##p < 0.01, ###p < 0.001 vs. H. pylori.
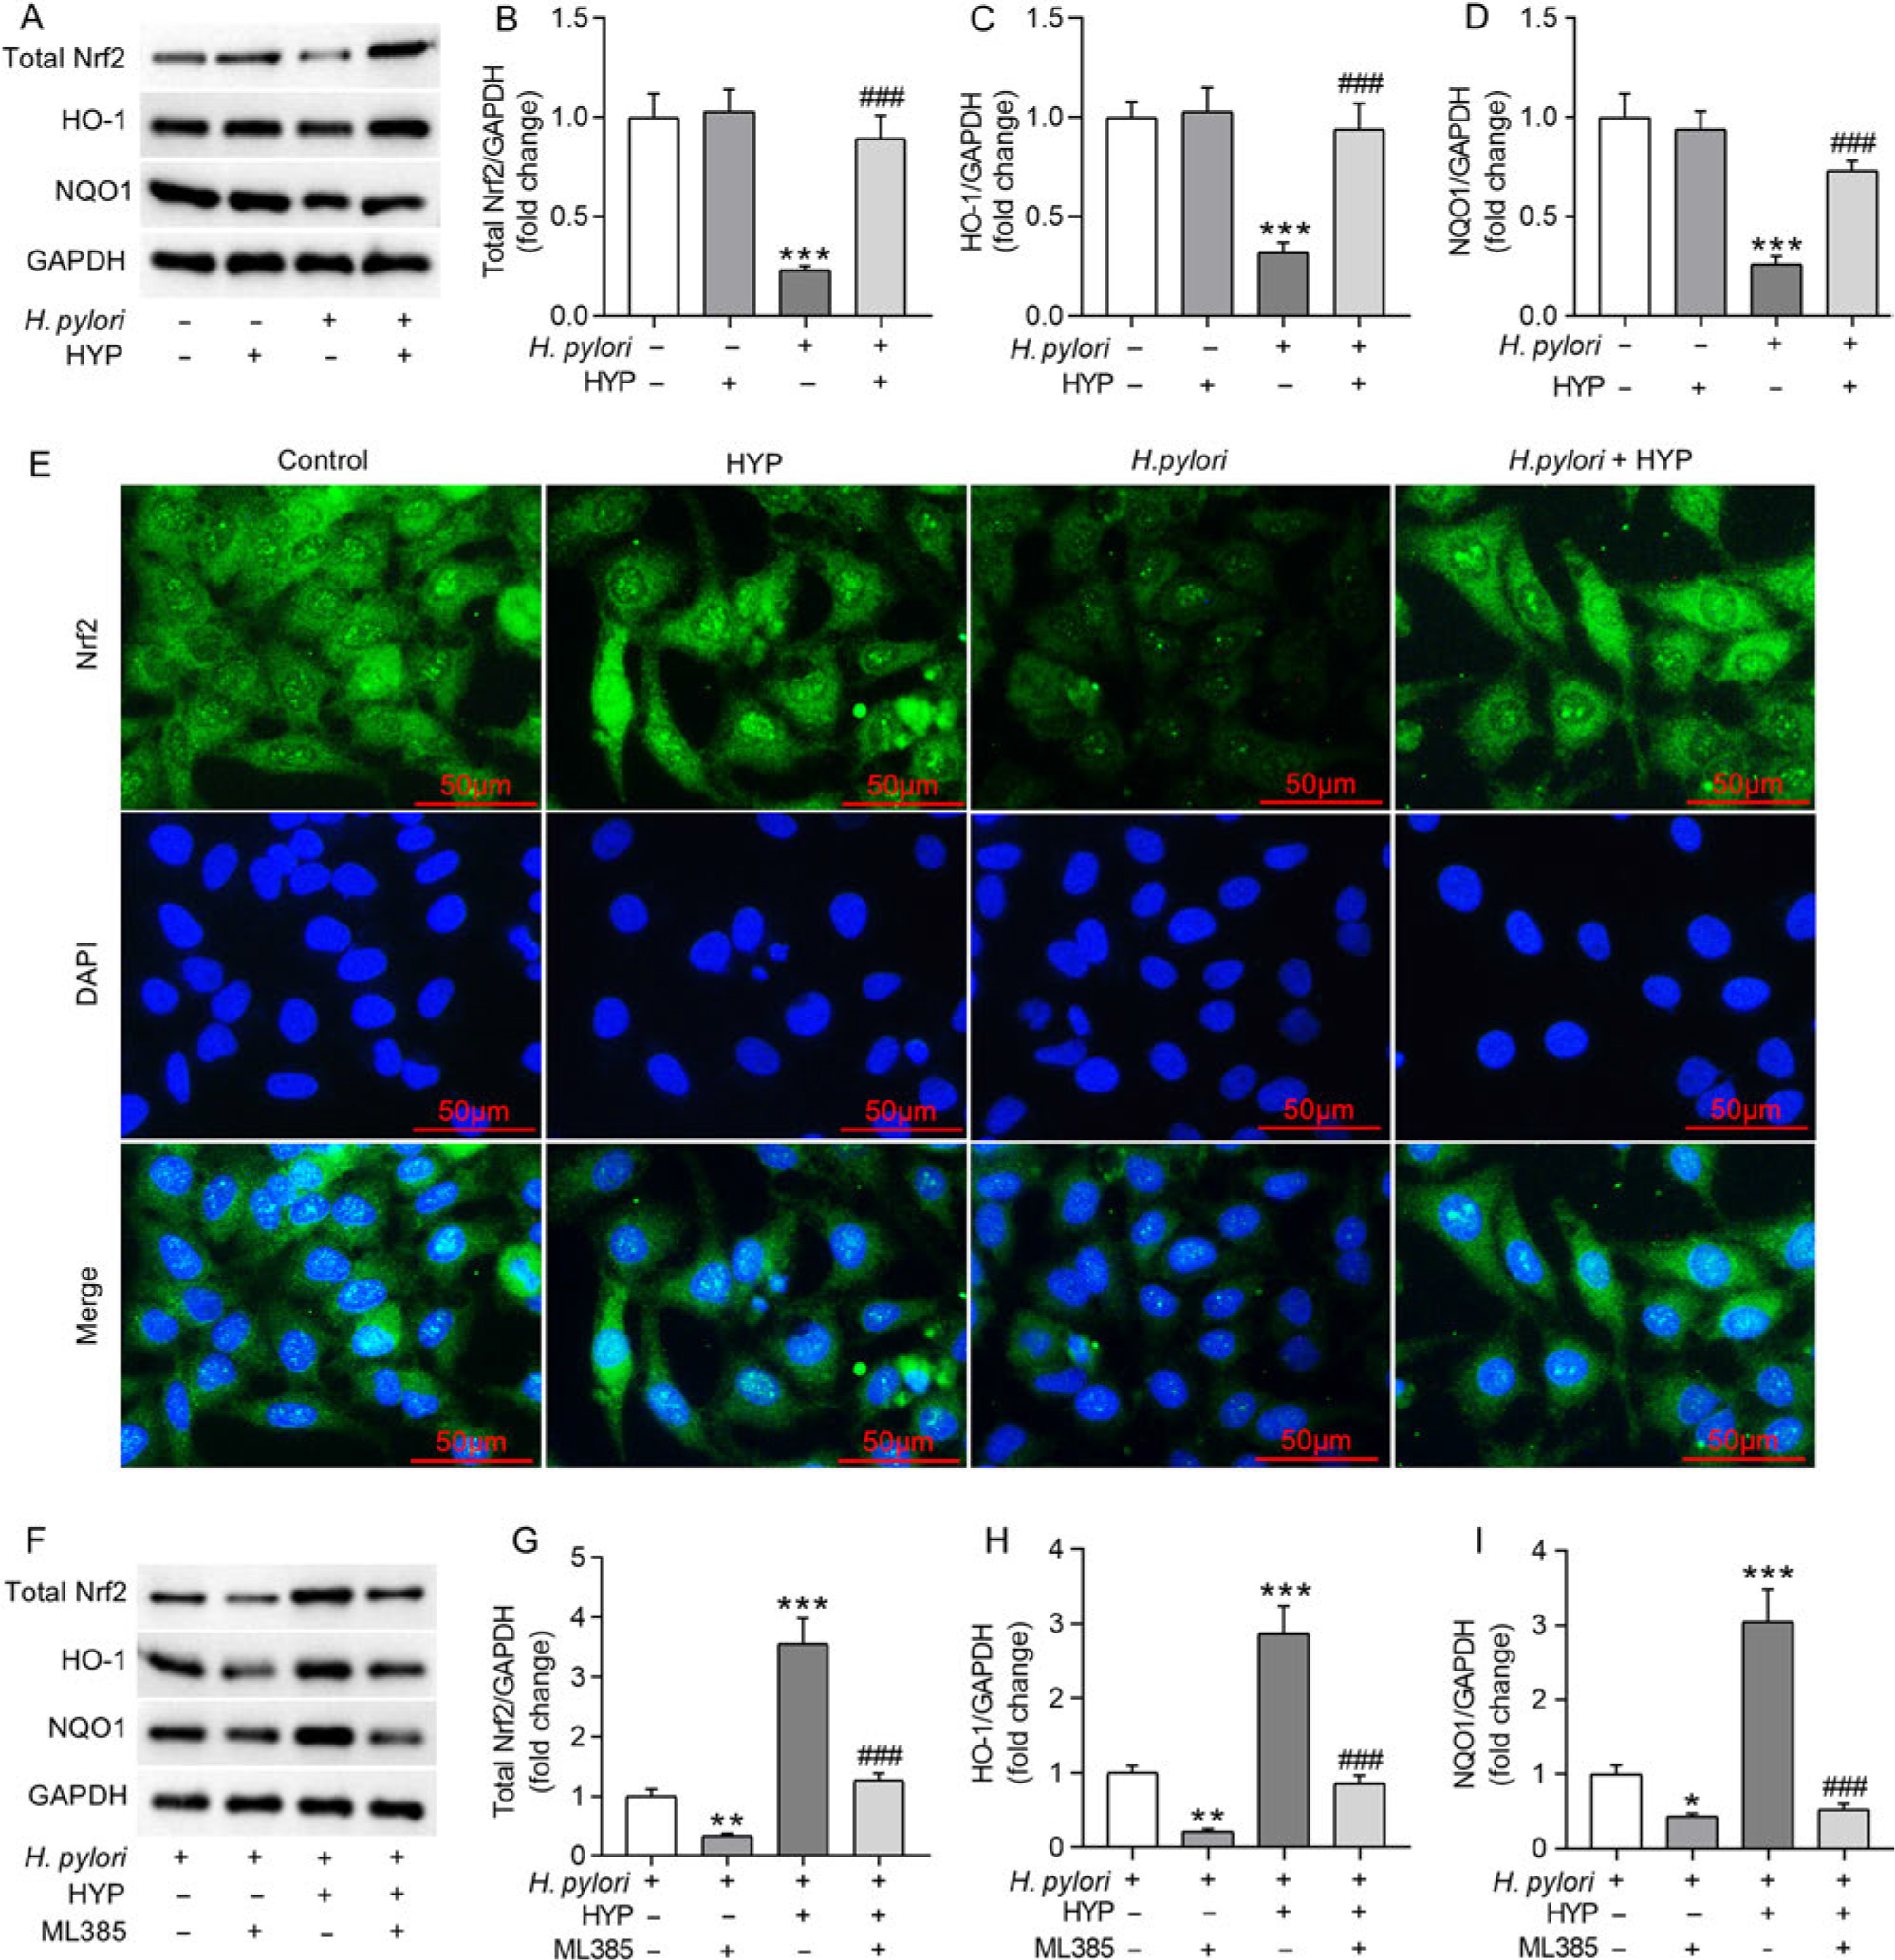
Fig. 4.
HYP activates the Nrf2/HO-1 signaling in Helicobacter pylori-infected GES-1 cells. GES-1 cells were pre-treated with HYP (80 μM) for 4 h, followed by H. pylori infection for 24 h.
A–D) Determination of Nrf2, HO-1, and NQO1 protein levels in GES-1 cells by western blotting. ***p < 0.001 versus control; ###p < 0.001 versus H. pylori;
E) representative immunofluorescence staining images showing Nrf2 expression (green) in GES-1 cells. Nuclei were stained with DAPI (blue);
F–I) estimation of Nrf2, HO-1, and NQO1 protein levels in GES-1 cells that were pre-treated with HYP (80 μM) and ML385 (5 μM) for 4 h before infection with H. pylori through western blotting. **p < 0.01, ***p < 0.001 vs. H. pylori; ###p < 0.001 vs. H. pylori + HYP.
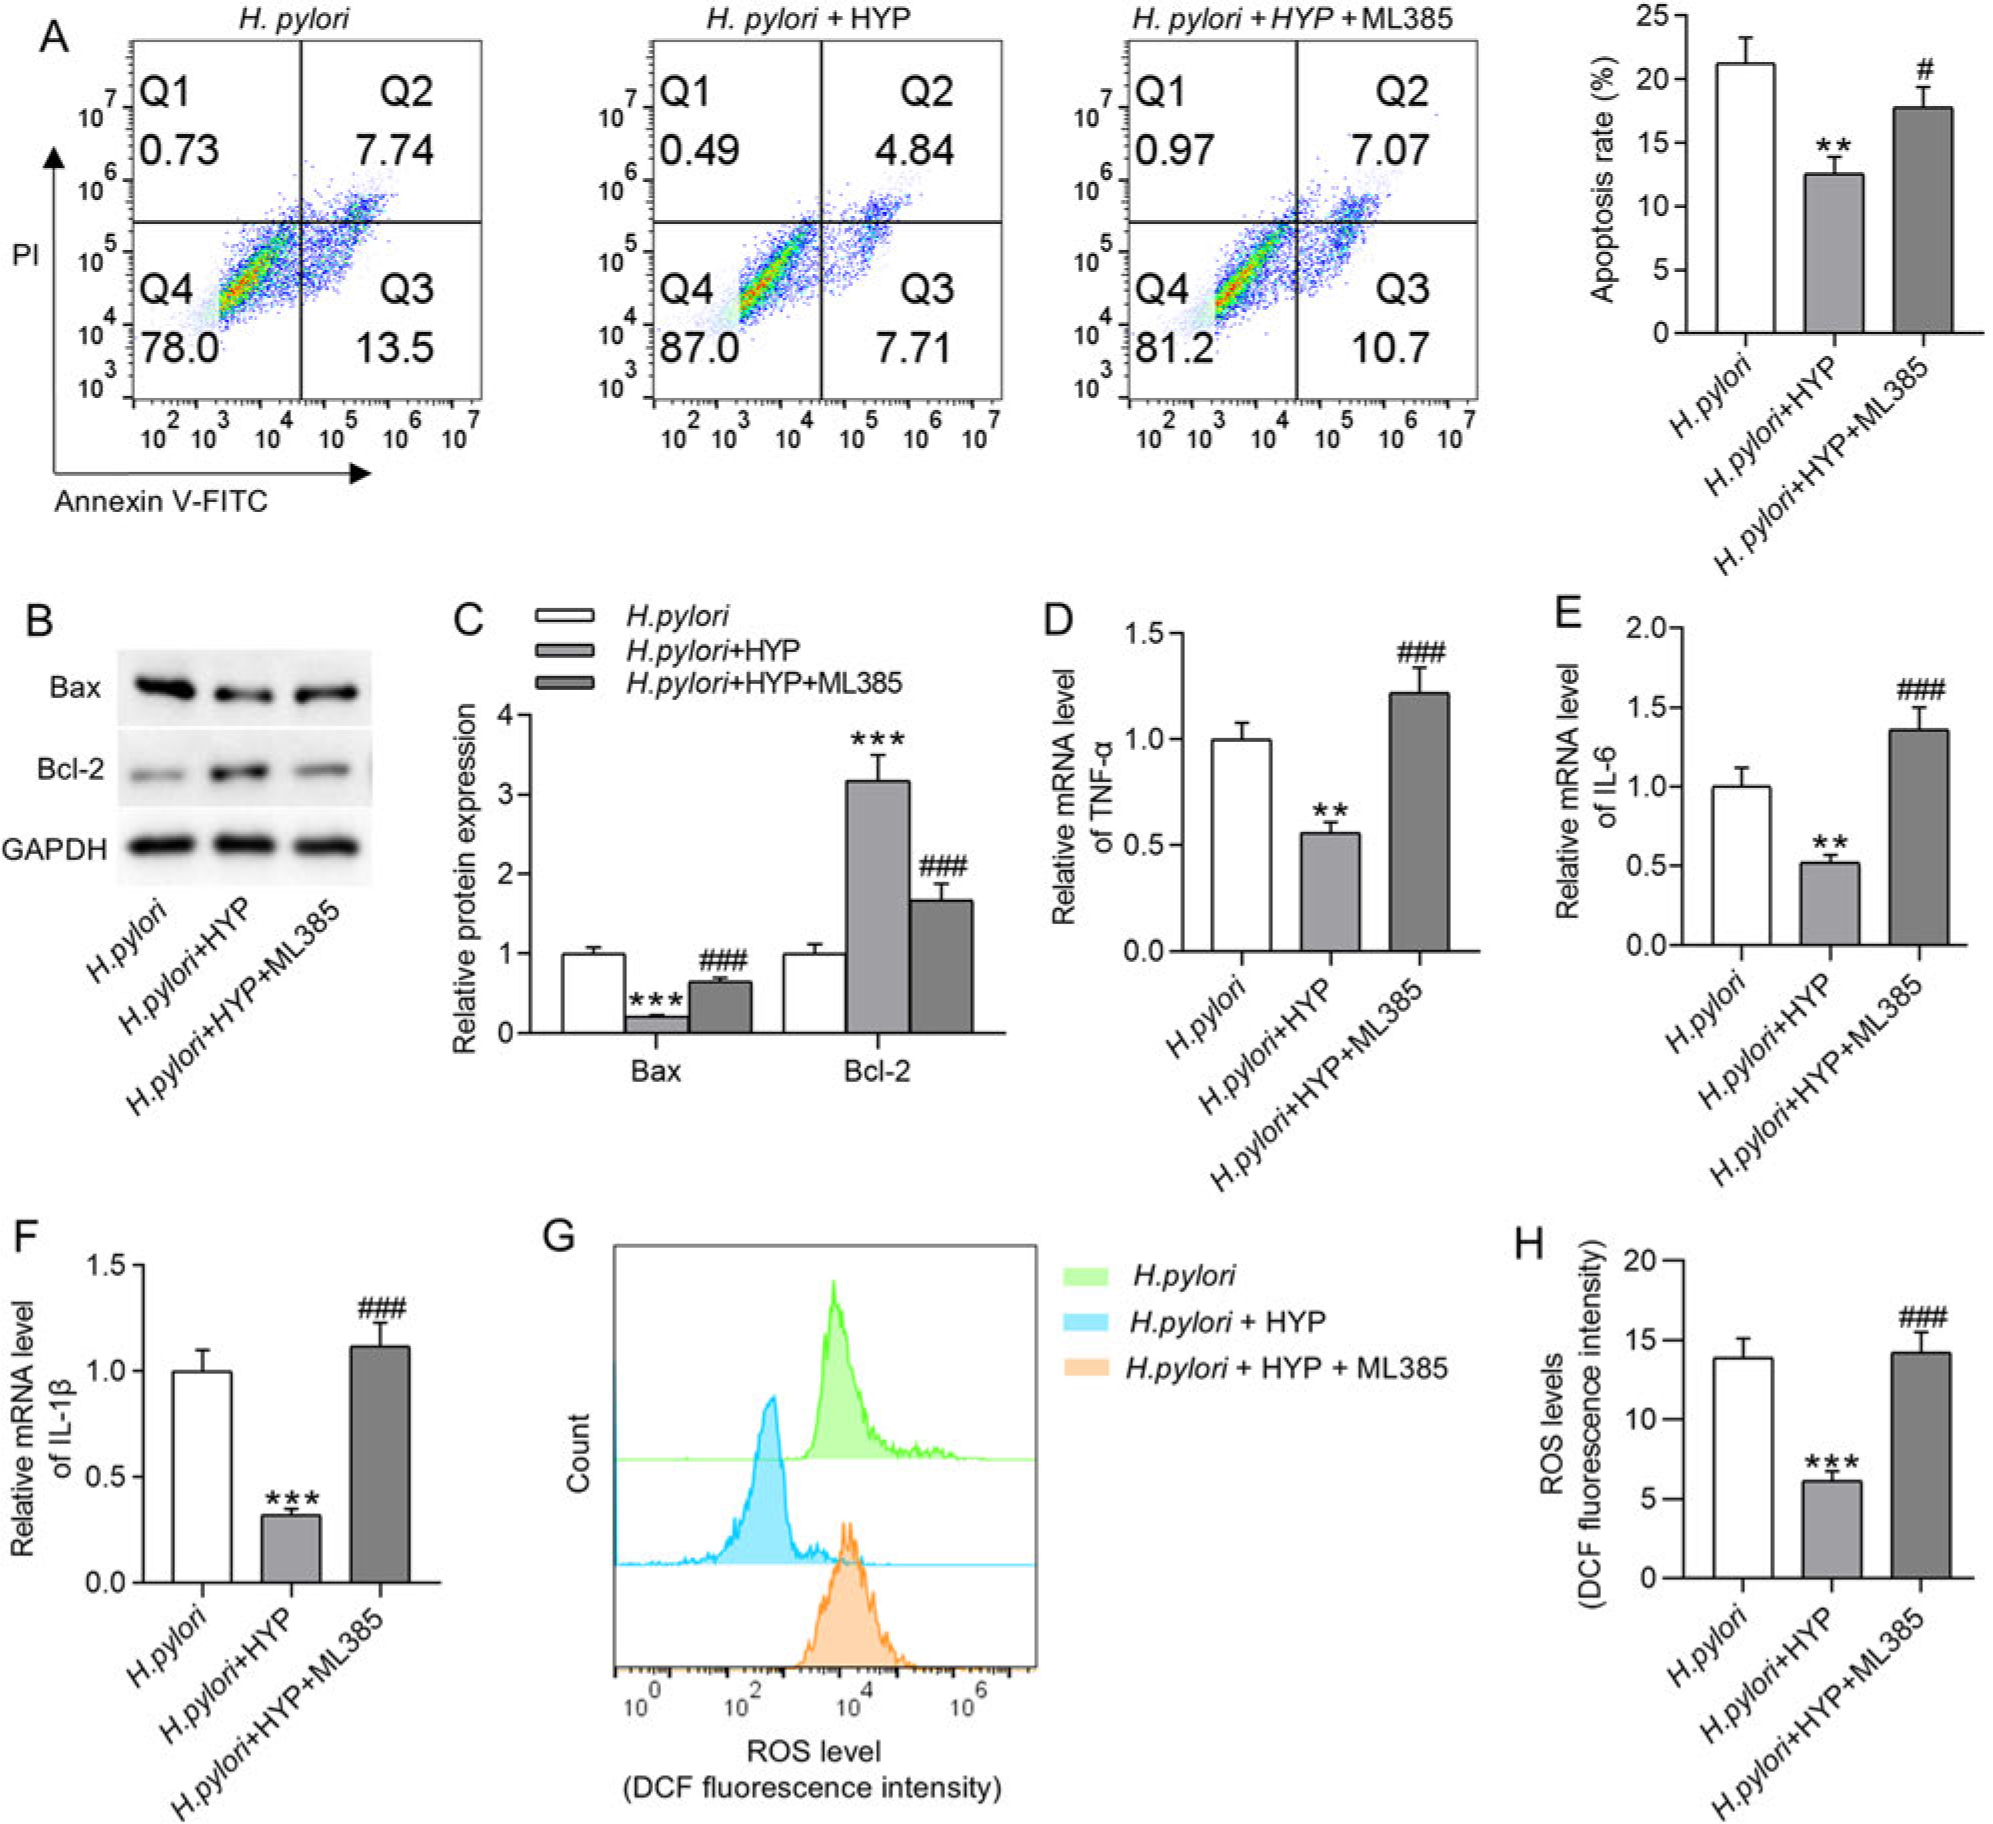
Fig. 5.
The Nrf2 inhibitor ML385 reverses Helicobacter pylori-induced GES-1 cell injury. GES-1 cells were pre-treated with HYP (80 μM) and ML385 (5 μM) for 4 h before infection with H. pylori.
A) Evaluation of GES-1 cell apoptosis using flow cytometry assay; B)–C) examination of Bax and Bcl-2 protein levels in GES-1 cells through western blotting;
D)–F) analysis of TNF-α, IL-6, and IL-1β mRNA levels in GES-1 cells via RT-qPCR; G) assessment of DCF fluorescence intensity in GES-1 cells using flow cytometry; H) quantification of intracellular ROS production by measuring DCF fluorescence intensity. **p < 0.01, ***p < 0.001 vs. H. pylori; #p < 0.05, ###p < 0.001 versus H. pylori + HYP.