
Table I
Physiological and biochemical tests and sugar fermentation tests results of strain N3-4.
| Physiological and biochemical characterization experiments | Sugar fermentation test | ||
|---|---|---|---|
| Indole test | + | Glucose | + |
| Citrate salt test | - | Fructose | + |
| Methyl Red test | + | Xylose | + |
| V-P test | + | Rhamnose | + |
| Gelatin hydrolysis test | + | Sucrose | + |
| Starch hydrolysis test | - | Arabinose | + |
| / | / | Marshmallow | - |
| / | / | Mannitol | + |
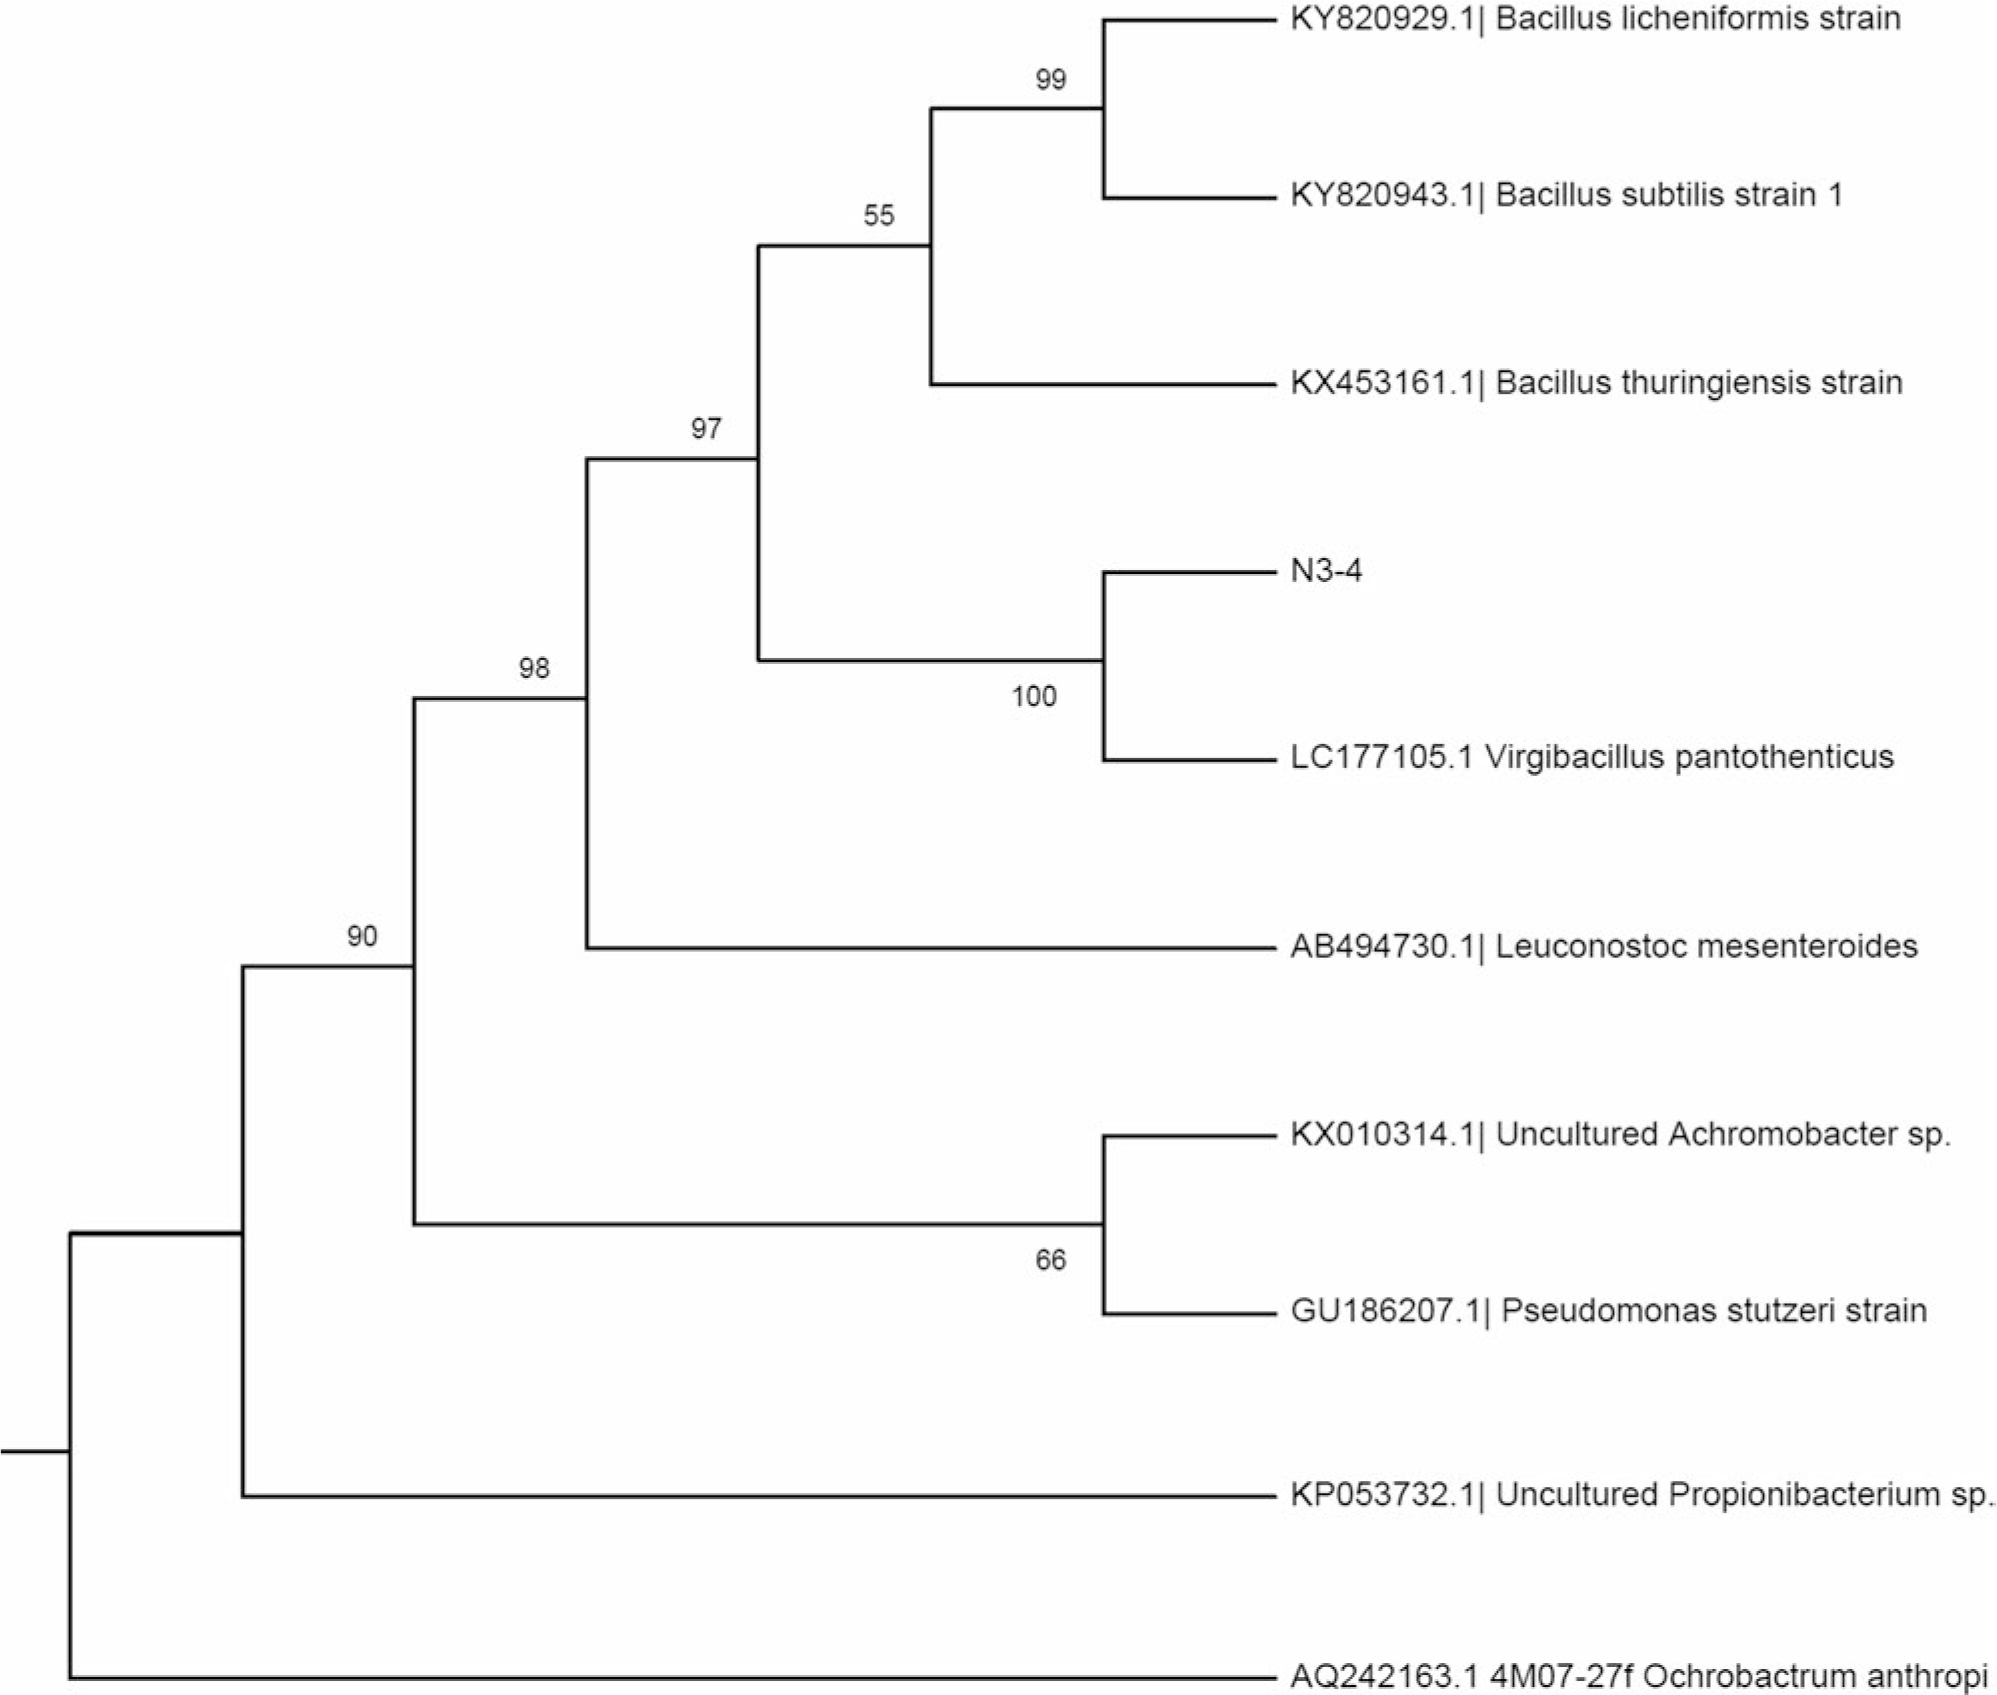
Fig 1.
Phylogenetic tree of strain N3-4 based on 16S rRNA sequence.
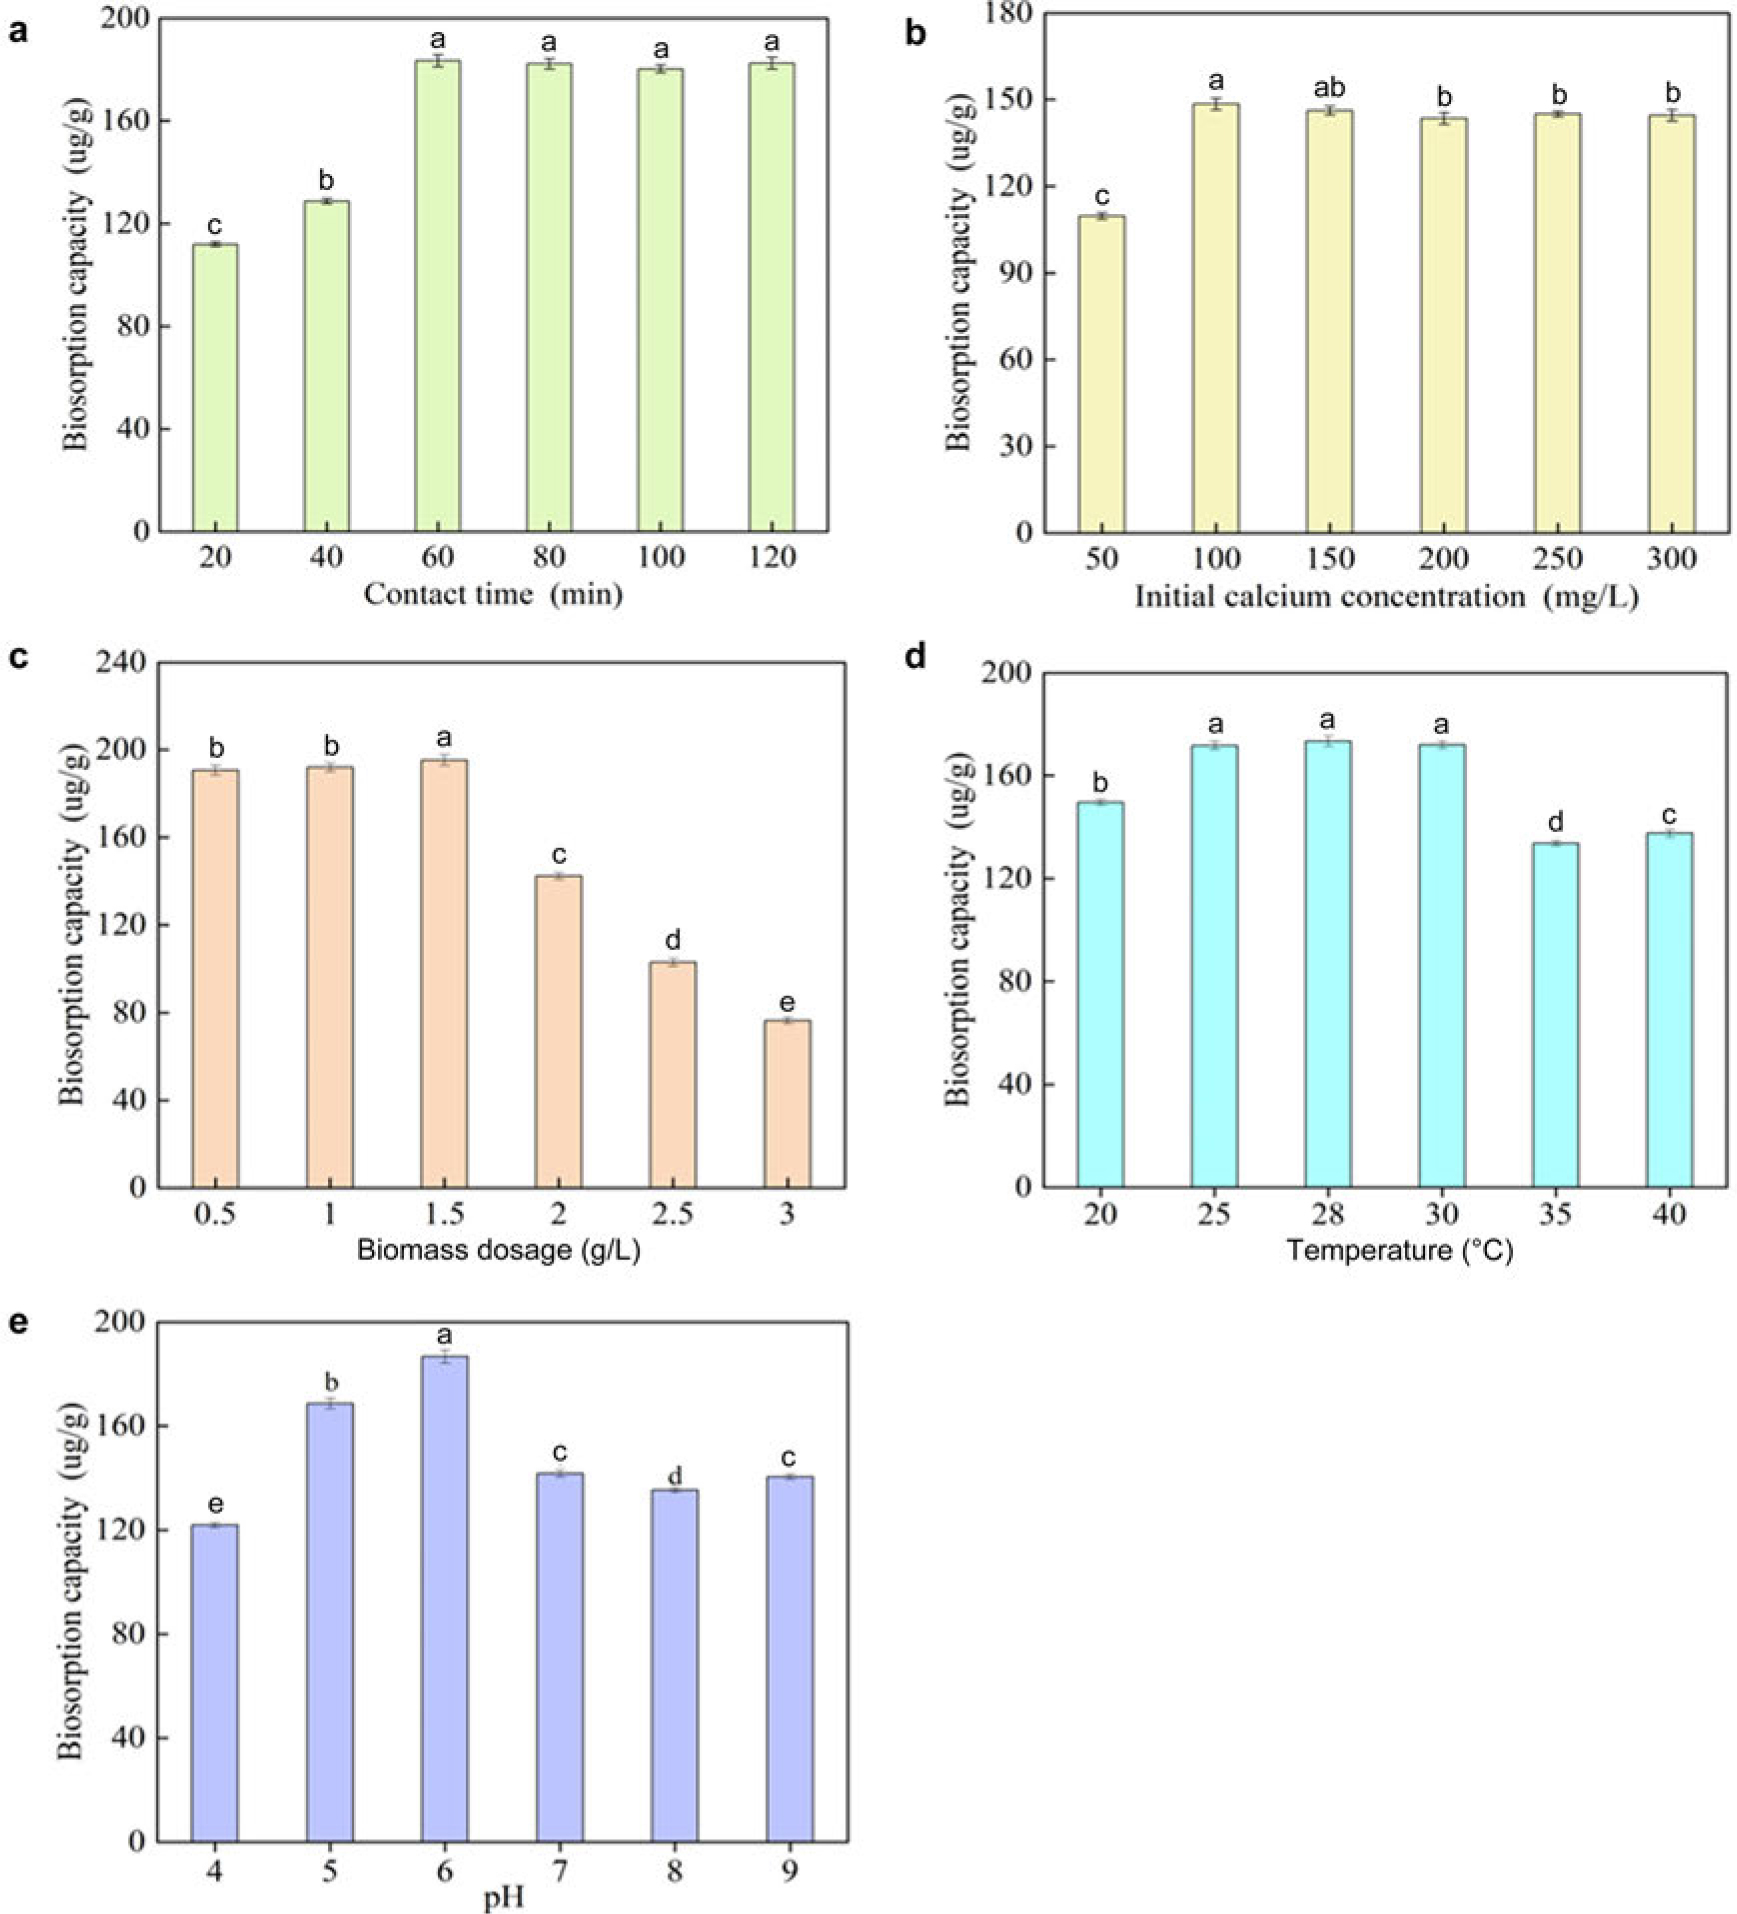
Fig. 2.
Effect of different parameters on biosorption capacity a) contact time; b) initial calcium concentration; c) biomass dosage; d) temperature, e) pH.
Different lowercase letters indicate significant differences (p < 0.05).
Table II
Experimental and predicted response for calcium biosorption using Virgibacillus pantothenticus.
| Run order | A Initial calcium concentration | B Contact time | C Biomass dosage | Biosorption capacity |
|---|---|---|---|---|
| 1 | 150 | 60 | 1.0 | 540.47 |
| 2 | 100 | 60 | 1.5 | 506.53 |
| 3 | 100 | 60 | 1.5 | 507.36 |
| 4 | 50 | 60 | 1.0 | 407.77 |
| 5 | 100 | 60 | 1.5 | 517.87 |
| 6 | 50 | 40 | 1.5 | 300.87 |
| 7 | 50 | 80 | 1.5 | 432.80 |
| 8 | 50 | 60 | 2.0 | 301.13 |
| 9 | 150 | 60 | 2.0 | 451.23 |
| 10 | 150 | 40 | 1.5 | 452.42 |
| 11 | 100 | 80 | 1.0 | 520.87 |
| 12 | 100 | 60 | 1.5 | 514.87 |
| 13 | 100 | 40 | 2.0 | 314.55 |
| 14 | 150 | 80 | 1.5 | 559.02 |
| 15 | 100 | 60 | 1.5 | 529.02 |
| 16 | 100 | 80 | 2.0 | 439.98 |
| 17 | 100 | 40 | 1.0 | 417.93 |
Table III
ANOVA results for calcium biosorption parameters.
| Source | Sum of squares | df | Mean square | F value | p-value | Significance |
|---|---|---|---|---|---|---|
| Model | 1.121E + 005 | 9 | 12459.59 | 236.49 | < 0.0001 | *** |
| A | 39379.40 | 1 | 39379.40 | 747.46 | < 0.0001 | *** |
| B | 27332.39 | 1 | 27332.39 | 518.79 | < 0.0001 | *** |
| C | 18064.25 | 1 | 18064.25 | 342.88 | < 0.0001 | *** |
| AB | 151.54 | 1 | 151.54 | 2.88 | 0.1337/ | |
| AC | 75.69 | 1 | 75.69 | 1.44 | 0.2697/ | |
| BC | 126.45 | 1 | 126.45 | 2.40 | 0.1653/ | |
| A2 | 6217.97 | 1 | 6217.97 | 118.02 | < 0.0001 | *** |
| B2 | 6820.04 | 1 | 6820.04 | 129.45 | < 0.0001 | *** |
| C2 | 11189.61 | 1 | 11189.61 | 212.39 | < 0.0001 | *** |
| Residual | 368.79 | 7 | 52.68 | / | / / | |
| Lack of Fit | 33.95 | 3 | 11.32 | 0.14 | 0.9340/ | |
| Pure Error | 334.84 | 4 | 83.71 | / | / | / |
| Cor Total | 1.125E + 005 | 16 | / | / | / | / |
| R2 | 0.9968/ | / | / | / | / | |
| Adj: R2 | 0.9928/ | / | / | / | / |
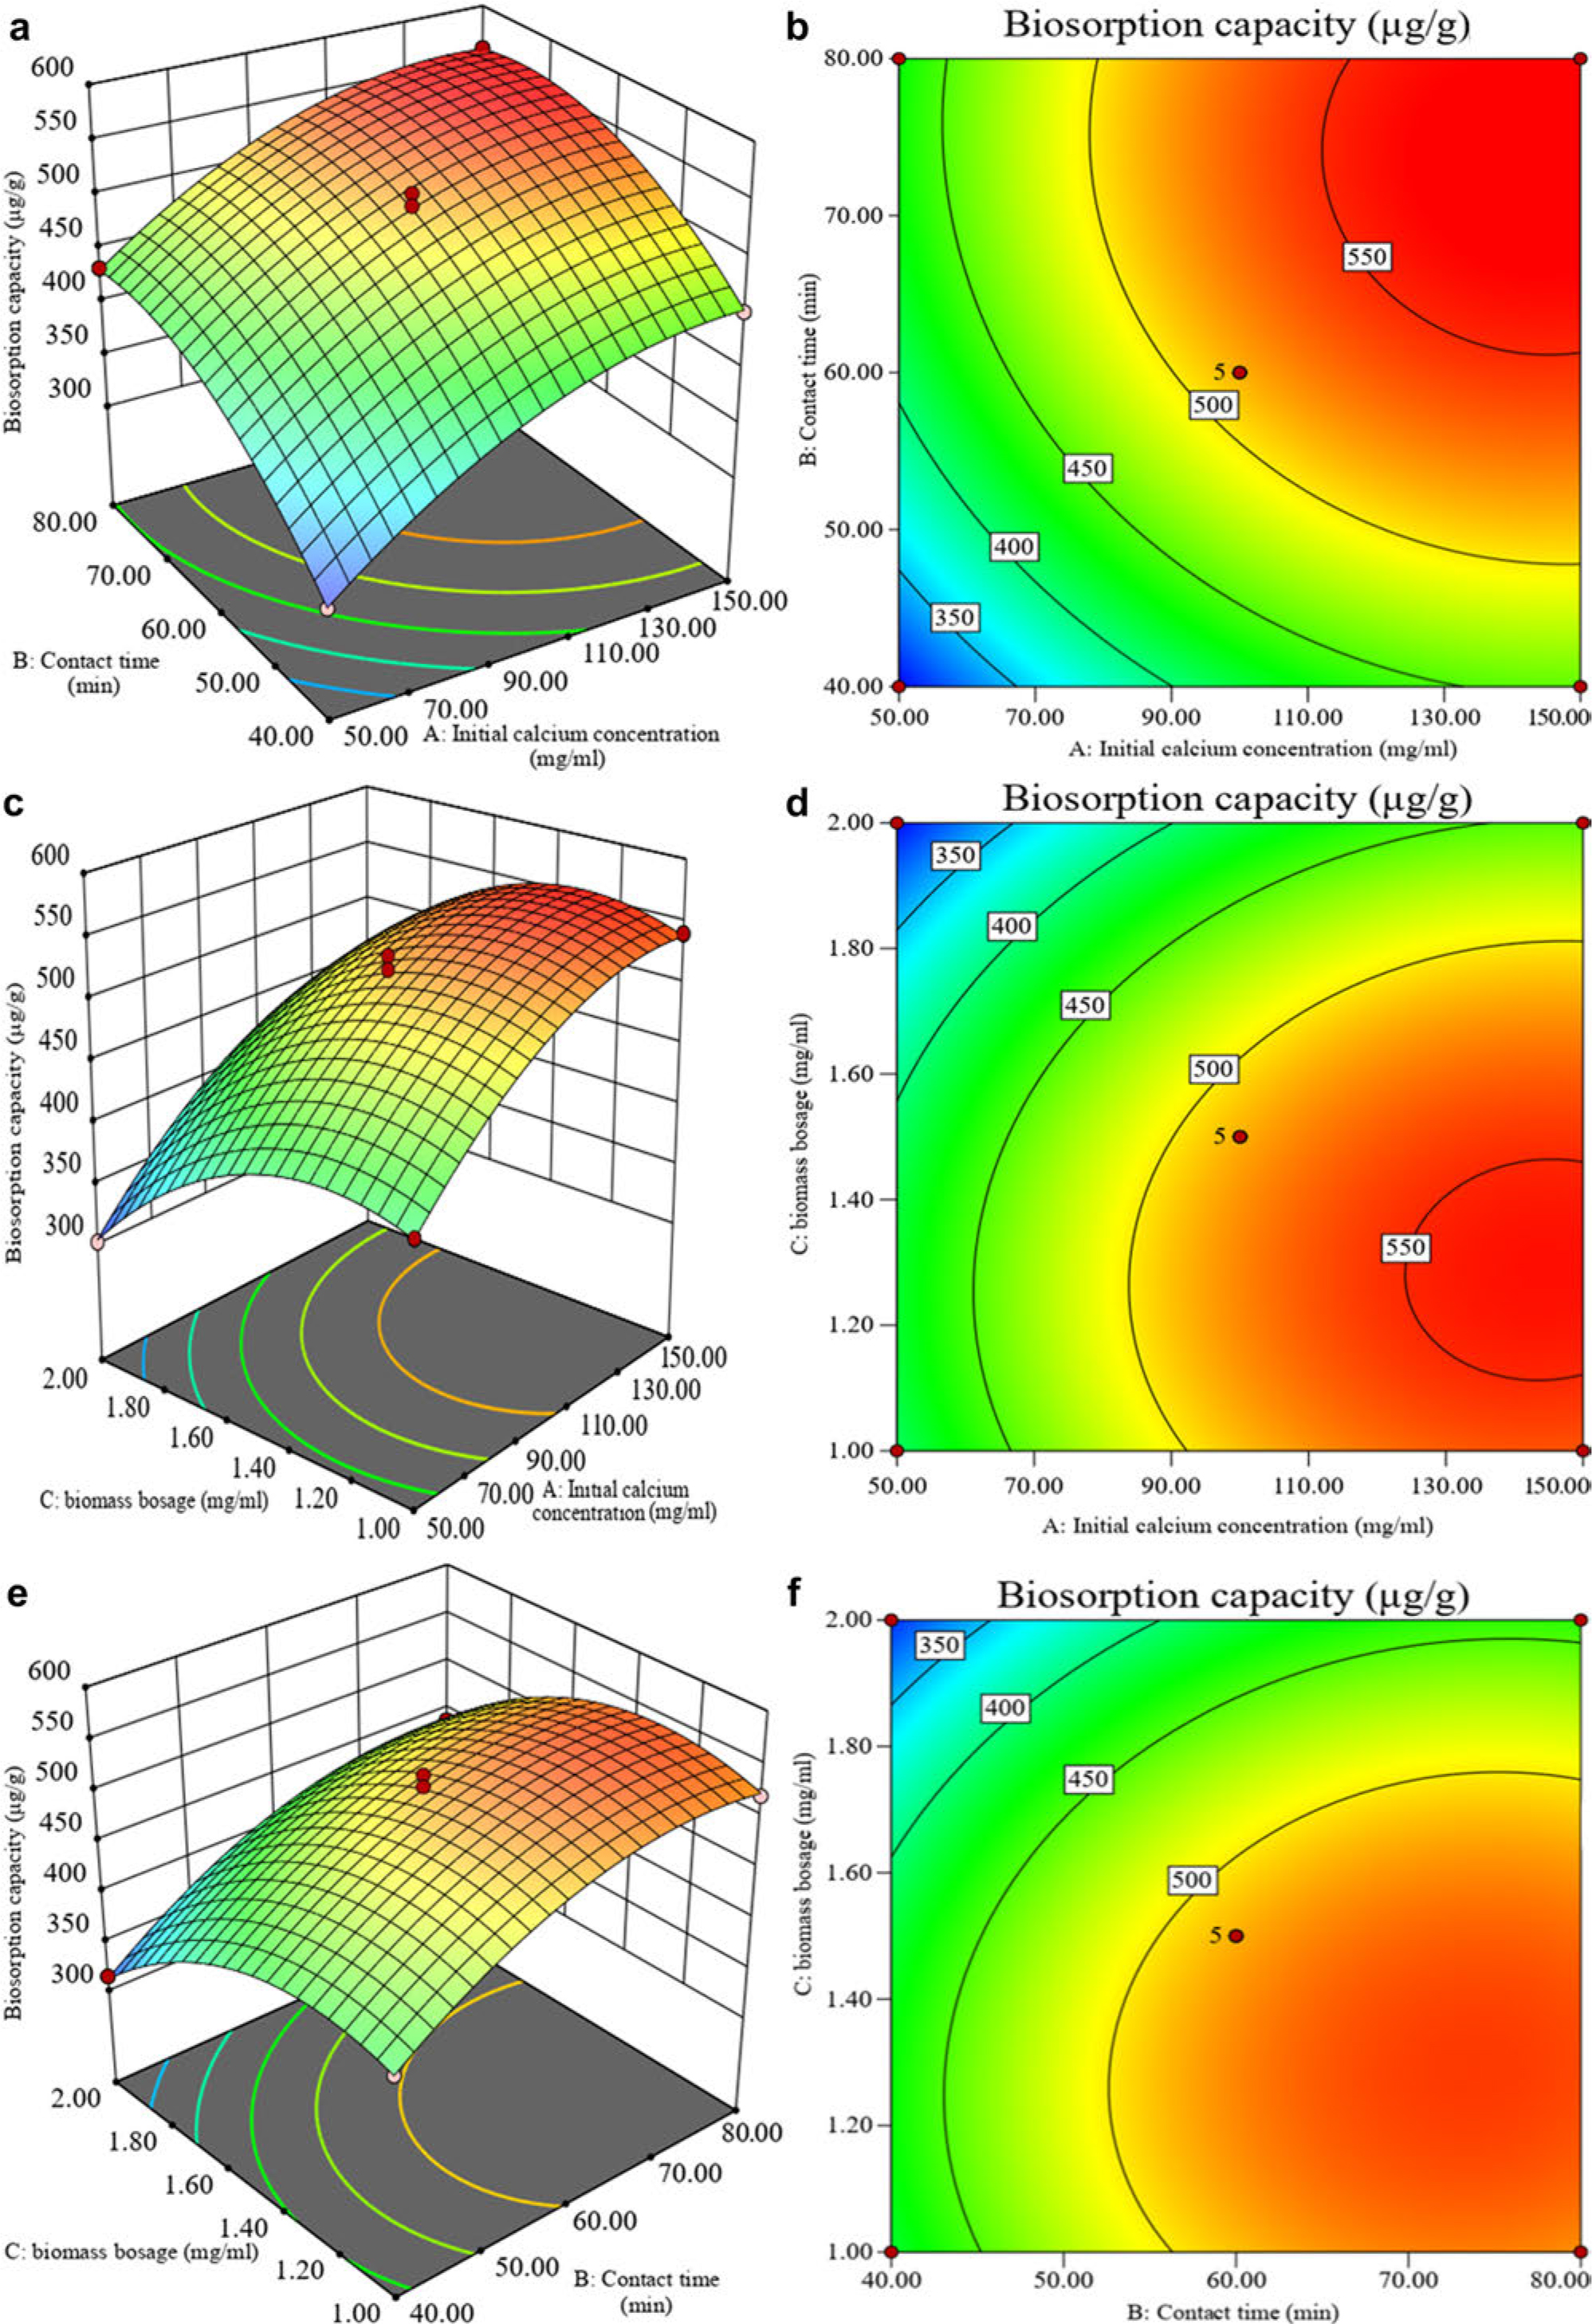
Fig. 3.
The binary interactions of factors of calcium biosorption capacity by response surface and contour a) and b) contact time and initial calcium ion concentration interact to affect the contour of bacterial adsorption capacity; c) and d) Biomass dosage and initial calcium ion concentration affects contours of bacterial adsorption capacity; e) and f) Biomass dosage and contact time affects contours of bacterial adsorption capacity.
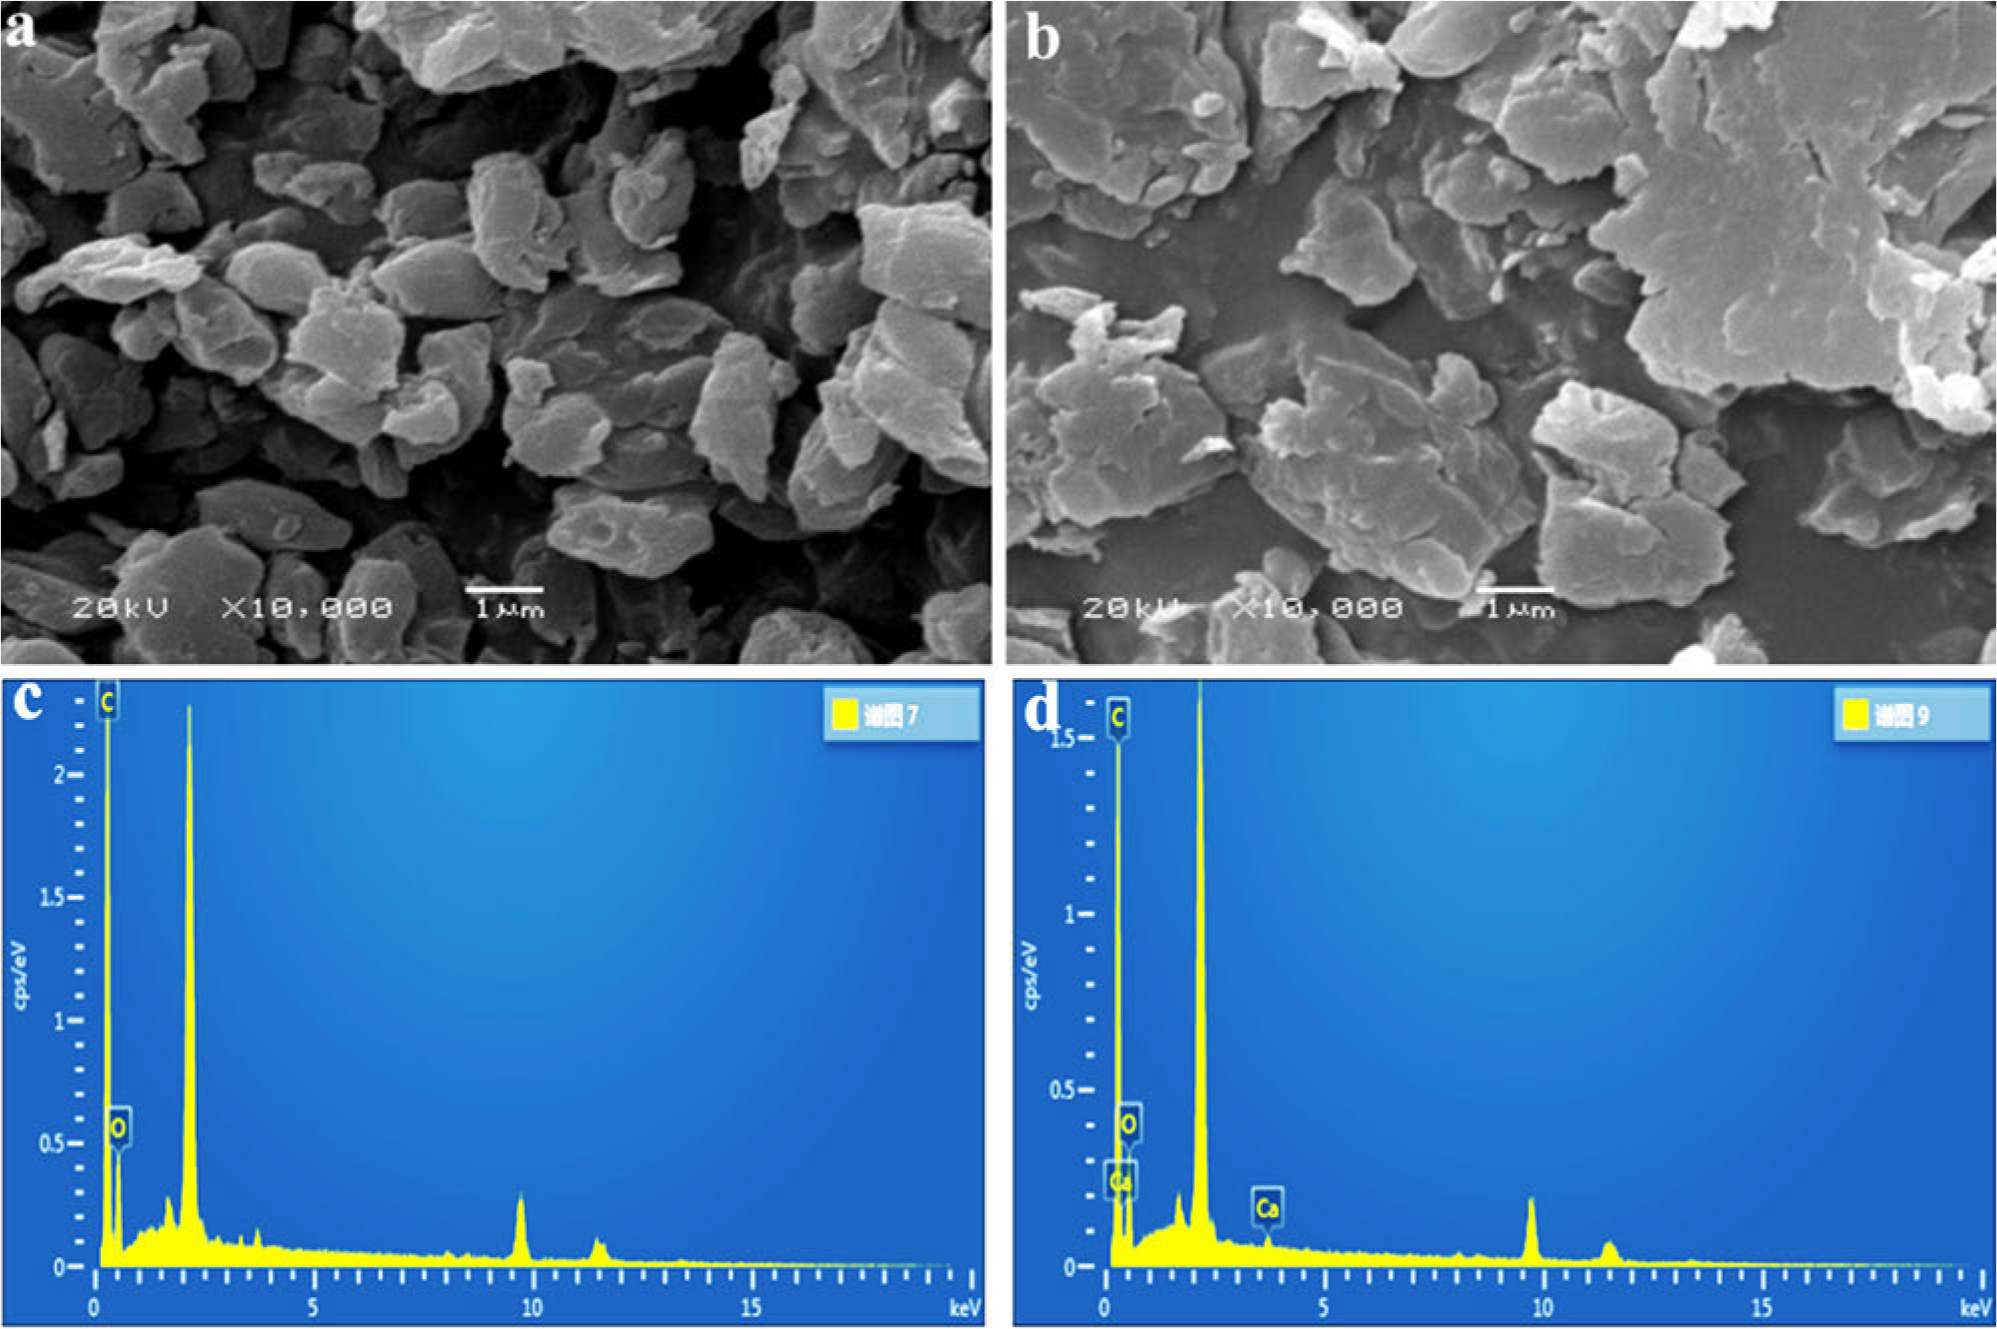
Fig. 4.
SEM images and EDS spectra of Virgibacillus pantothenticus biomass: a) non-adsorbed biomass, b) Ca(II)-adsorbed biomass, c) EDS spectrum of non-adsorbed biomass and d) EDS spectrum of Ca(II)-adsorbed biomass.
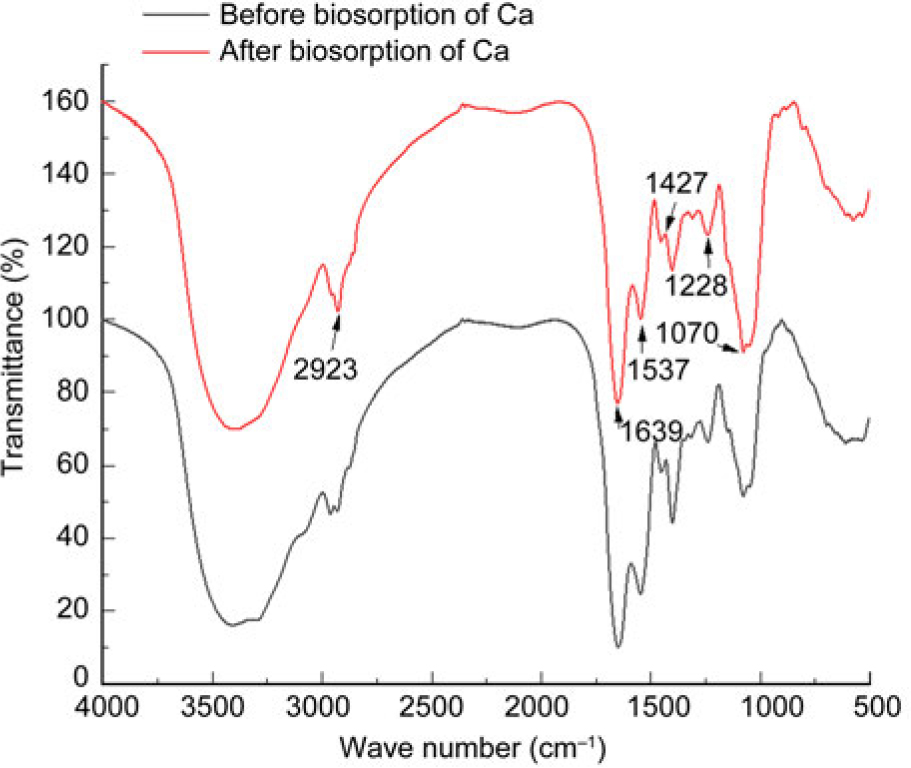
Fig. 5.
FTIR spectra of Virgibacillus pantothenticus cells before and after calcium biosorption.
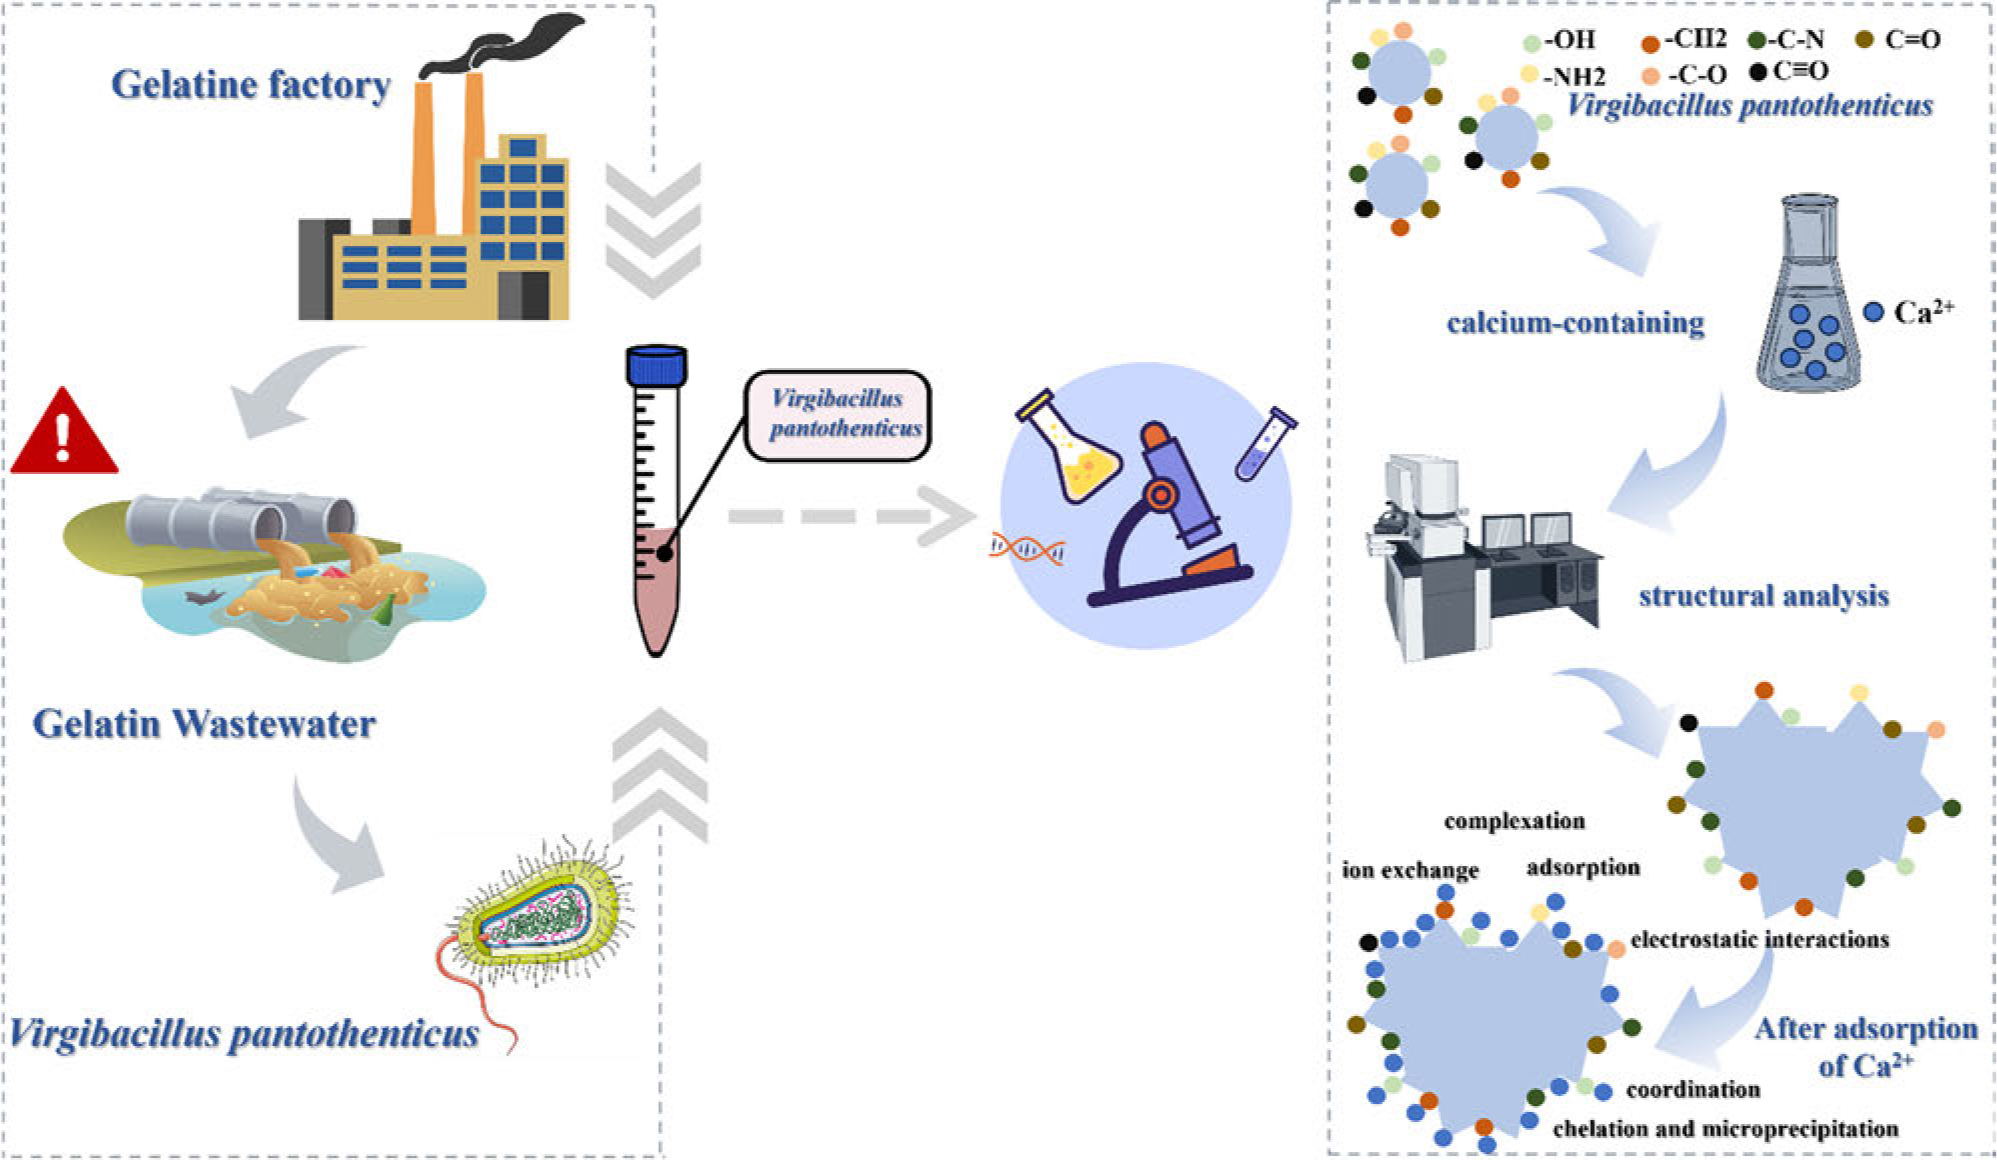
Fig. 6.
Schematic diagram of the adsorption mechanism of Virgibacillus pantothenticus.